AI PPT Maker
Templates
PPT Bundles
Design Services
Business PPTs
Business Plan
Management
Strategy
Introduction PPT
Roadmap
Self Introduction
Timelines
Process
Marketing
Agenda
Technology
Medical
Startup Business Plan
Cyber Security
Dashboards
SWOT
Proposals
Education
Pitch Deck
Digital Marketing
KPIs
Project Management
Product Management
Artificial Intelligence
Target Market
Communication
Supply Chain
Google Slides
Research Services
 One Pagers
All Categories
-
Home
- Customer Favorites
- Scoring Chart
Scoring Chart

Cross Functional Hr And Accounting Procedure Flow Chart Sample PDF
This slide consists of a diagrammatical representation of cross functional flow chart which provides insights about the human resource and accounting process. The elements are closed payroll cycle, enter new employee information, enter correct information, verify, send for review etc. Showcasing this set of slides titled Cross Functional Hr And Accounting Procedure Flow Chart Sample PDF. The topics addressed in these templates are Correct Information, Employee Information, Overtime Approval. All the content presented in this PPT design is completely editable. Download it and make adjustments in color, background, font etc. as per your unique business setting.

Big Data Analytics Procedure Flow Chart Portrait PDF
This slide showcases big data analysis process to enable access of enormous information and extracting meaningful insights. It includes elements such as data gathering, data integration, data cleaning, extraction and transformation Pitch your topic with ease and precision using this Big Data Analytics Procedure Flow Chart Portrait PDF. This layout presents information on Raw Data, Flow Chart, Big Data. It is also available for immediate download and adjustment. So, changes can be made in the color, design, graphics or any other component to create a unique layout.

Five Factors Of Brand Equity Chart Presentation Images
This is a five factors of brand equity chart presentation images. This is a five stage process. The stages in this process are awareness, differentiation, consumer connection, accessibility, value. \n \n \n \n \n \n \n \n \n \n

Approve Leads Flow Chart Powerpoint Slide Presentation Tips
This is a approve leads flow chart powerpoint slide presentation tips. This is a seven stage process. The stages in this process are awareness, interest, decision, action, permission, engagement, call to action.
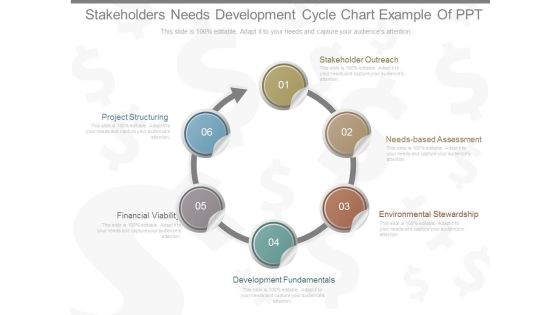
Stakeholders Needs Development Cycle Chart Example Of Ppt
This is a stakeholders needs development cycle chart example of ppt. This is a six stage process. The stages in this process are stakeholder outreach, needs based assessment, environmental stewardship,, development fundamentals, financial viability, project structuring.

Corporate Public Relation Puzzle Chart Powerpoint Slide Show
This is a corporate public relation puzzle chart powerpoint slide show. This is a nine stage process. The stages in this process are business partners, media, employees, customers, shareholders, investors, financial marketing, politics and state administration, pr.

Operational Flow Of Financial Services Chart Example Of Ppt
This is a operational flow of financial services chart example of ppt. This is a five stage process. The stages in this process are customer, mobile, atm, employees, high finance trading.

Real Estate Investing Cash Flow Chart Powerpoint Templates
This is a real estate investing cash flow chart powerpoint templates. This is a four stage process. The stages in this process are cash flow, tax benefits, debt pay down, appreciation.

Business And It Alignment Strategy Chart Powerpoint Slide Template
This is a business and it alignment strategy chart powerpoint slide template. This is a four stage process. The stages in this process are business strategy, it strategy, it architecture, business architecture.
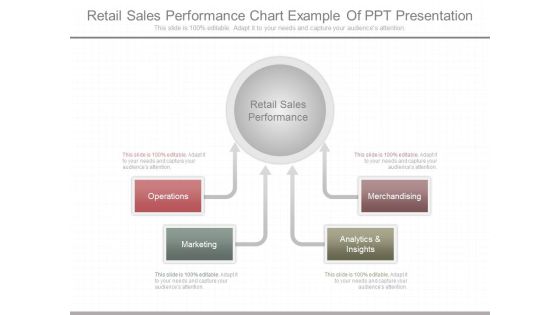
Retail Sales Performance Chart Example Of Ppt Presentation
This is a retail sales performance chart example of ppt presentation. This is a four stage process. The stages in this process are operations, marketing, analytics and insights, merchandising, retail sales performance.

Areas Of Qualitative Research Chart Powerpoint Slide Show
This is a areas of qualitative research chart powerpoint slide show. This is a nine stage process. The stages in this process are commercial, healthcare, communication, manufacturing, legal, financial,, education, government, technology.
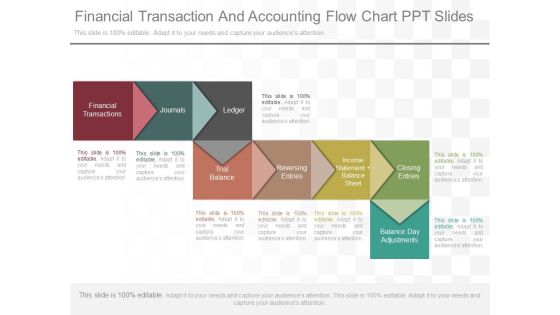
Financial Transaction And Accounting Flow Chart Ppt Slides
This is a financial transaction and accounting flow chart ppt slides. This is a eight stage process. The stages in this process are financial transactions, journals, ledger, trial balance, reversing entries, income statement balance sheet, closing entries, balance day adjustments.

Corporate Structure And Organization Chart Development Ppt Powerpoint Guide
This is a corporate structure and organization chart development ppt powerpoint guide. This is a six stage process. The stages in this process are relationship, structure, purpose, mechanisms, rewards, leadership.

Smart Business Solution Infographic Chart Example Of Ppt
This is a smart business solution infographic chart example of ppt. This is a nine stage process. The stages in this process are balance, vision, strategy, knowledge, mission, portfolio, precision, one touch, creativity.
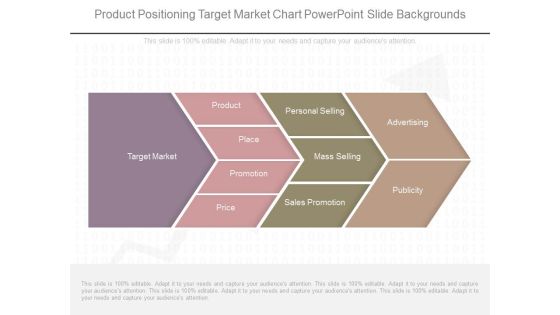
Product Positioning Target Market Chart Powerpoint Slide Backgrounds
This is a product positioning target market chart powerpoint slide backgrounds. This is a four stage process. The stages in this process are target market, product, place, promotion, price, personal selling, mass selling, sales promotion, advertising, publicity.
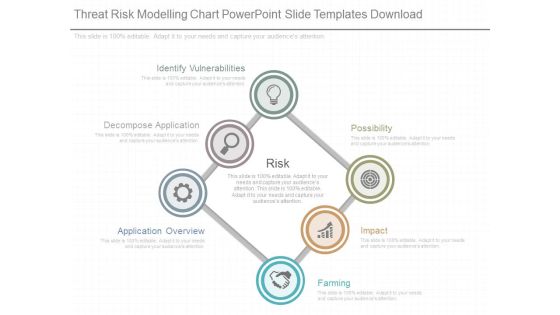
Threat Risk Modelling Chart Powerpoint Slide Templates Download
This is a threat risk modelling chart powerpoint slide templates download. This is a six stage process. The stages in this process are identify vulnerabilities, decompose application, application overview, possibility, impact, farming, risk.
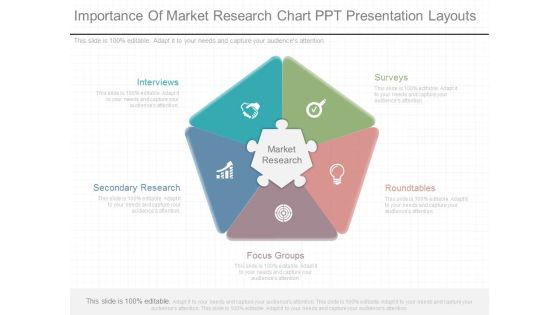
Importance Of Market Research Chart Ppt Presentation Layouts
This is a importance of market research chart ppt presentation layouts. This is a five stage process. The stages in this process are interviews, secondary research, market research, focus groups, surveys, roundtables.

Design Development New Product Chart Good Ppt Example
This is a design development new product chart good ppt example. This is a six stage process. The stages in this process are idea generation, marketing strategy development, product development, idea screening, concept development and testing, test marketing.
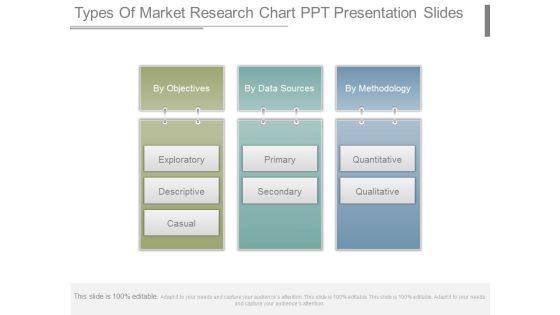
Types Of Market Research Chart Ppt Presentation Slides
This is a types of market research chart ppt presentation slides. This is a three stage process. The stages in this process are by objectives, exploratory, descriptive, causal, by data sources, primary, secondary, by methodology, quantitative, qualitative.
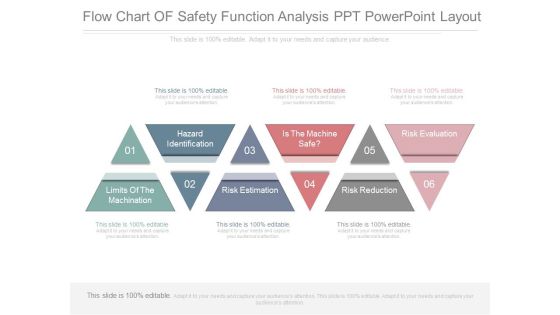
Flow Chart Of Safety Function Analysis Ppt Powerpoint Layout
This is a flow chart of safety function analysis ppt powerpoint layout. This is a six stage process. The stages in this process are hazard identification, limits of the machination, risk estimation, is the machine safe, risk reduction, risk evaluation.
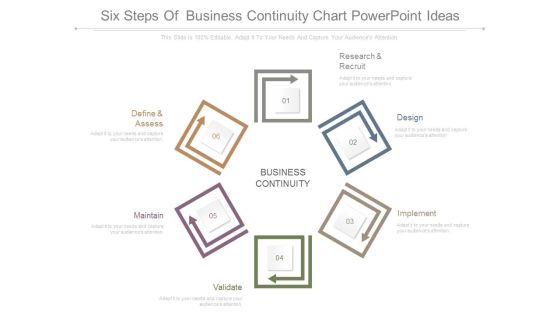
Six Steps Of Business Continuity Chart Powerpoint Ideas
This is a six steps of business continuity chart powerpoint ideas. This is a six stage process. The stages in this process are define and assess, research and recruit, design, implement, validate, maintain, business continuity.

International Market Segmentation Sample Flow Chart Powerpoint Layout
This is a international market segmentation sample flow chart powerpoint layout. This is a six stage process. The stages in this process are geographic, cultural, the firm, economic, industrial markets, political legal.
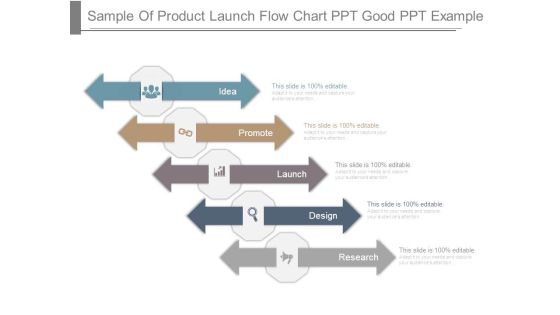
Sample Of Product Launch Flow Chart Ppt Good Ppt Example
This is a sample of product launch flow chart ppt good ppt example. This is a five stage process. The stages in this process are idea, promote, launch, design, research.
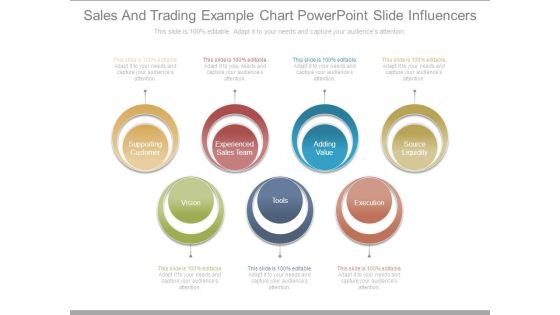
Sales And Trading Example Chart Powerpoint Slide Influencers
This is a sales and trading example chart powerpoint slide influencers. This is a seven stage process. The stages in this process are supporting customer, experienced sales team, adding value, source liquidity, vision, tools, execution.
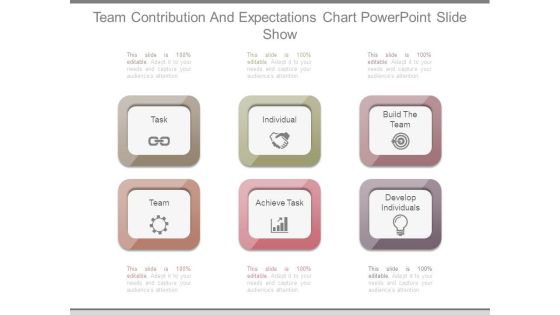
Team Contribution And Expectations Chart Powerpoint Slide Show
This is a team contribution and expectations chart powerpoint slide show. This is a six stage process. The stages in this process are task, individual, build the team, team, achieve task, develop individuals.

Tools To Measure Event Marketing Chart Powerpoint Slides Deck Template
This is a tools to measure event marketing chart powerpoint slides deck template. This is a six stage process. The stages in this process are cross functional, business intelligence, sales and promotion, going viral, driving roi, growing fans.

Business Intelligence Ecosystem Chart Example Of Ppt Presentation
This is a business intelligence ecosystem chart example of ppt presentation. This is a eight stage process. The stages in this process are strategy, data mining, customers, market, business outcome, leadership skills, suppliers, competition.

Enterprise Value Timing Factors Chart Ppt Examples Professional
This is a enterprise value timing factors chart ppt examples professional. This is a four stage process. The stages in this process are industry dynamics, company performance, organic growth, strategic acquisitions.

Cash Flow From Operations Chart Ppt Sample Presentations
This is a cash flow from operations chart ppt sample presentations. This is a six stage process. The stages in this process are uses of cash, operating activities, sources of cash, financing activities, investing activities, change in cash balance.

Closed Loop Life Cycle Chart Powerpoint Slide Backgrounds
This is a closed loop life cycle chart powerpoint slide backgrounds. This is a seven stage process. The stages in this process are consumption and use, results, manufacturing, materials sourcing, distribution logistics, sale and retail, underlying assumption.
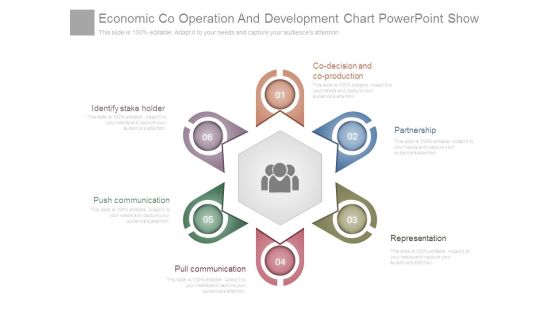
Economic Co Operation And Development Chart Powerpoint Show
This is a economic co operation and development chart powerpoint show. This is a six stage process. The stages in this process are co decision and co production, partnership, representation, pull communication, push communication, identify stake holder.
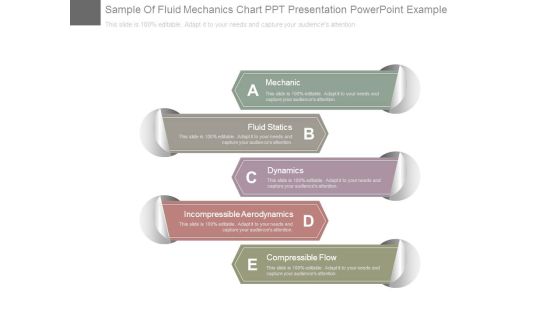
Sample Of Fluid Mechanics Chart Ppt Presentation Powerpoint Example
This is a sample of fluid mechanics chart ppt presentation powerpoint example. This is a five stage process. The stages in this process are mechanic, fluid statics, dynamics, incompressible aerodynamics, compressible flow.
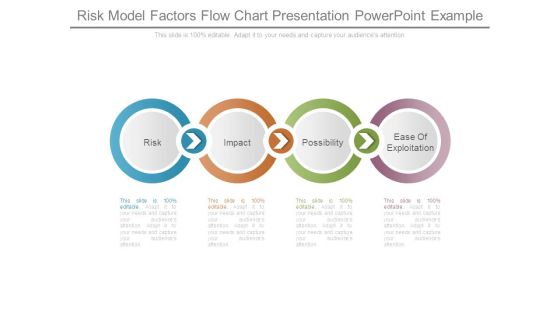
Risk Model Factors Flow Chart Presentation Powerpoint Example
This is a risk model factors flow chart presentation powerpoint example. This is a four stage process. The stages in this process are risk, impact, possibility, ease of exploitation.

Marketing Org Chart Example Powerpoint Slide Design Ideas
This is a marketing org chart example powerpoint slide design ideas. This is a four stage process. The stages in this process are strategic marketing, product marketing, interactive marketing, marketing organization.
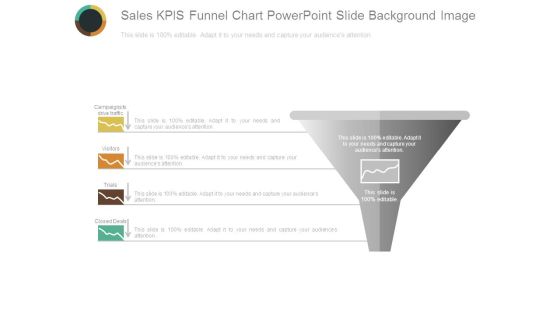
Sales Kpis Funnel Chart Powerpoint Slide Background Image
This is a sales kpis funnel chart powerpoint slide background image. This is a one stage process. The stages in this process are campaigns to drive traffic, visitors, trials, closed deals, sales.

Break Point Chart For Quality Analysis Powerpoint Slide Show
This is a break point chart for quality analysis powerpoint slide show. This is a one stage process. The stages in this process are total variable costs, fixed costs, quality sold.

Our Product Vs Competition Analysis Chart Powerpoint Slide Background Designs
This is a our product vs competition analysis chart powerpoint slide background designs. This is a four stage process. The stages in this process are business, marketing, success, strategy, compare.
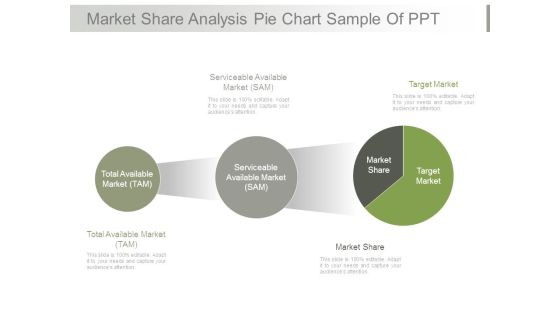
Market Share Analysis Pie Chart Sample Of Ppt
This is a market share analysis pie chart sample of ppt. This is a three stage process. The stages in this process are serviceable available market sam, target market, total available market tam, market share.

And R Chart For Six Sigma Powerpoint Slide Background Designs
This is a and r chart for six sigma powerpoint slide background designs. This is a two stage process. The stages in this process are subtitle, option, lcl, ucl.

Kano Analysis Line Chart Powerpoint Slide Design Ideas
This is a kano analysis line chart powerpoint slide design ideas. This is a three stage process. The stages in this process are customer needs in the kano model, exciter, performance, basic, implementation level.

Possible Solutions Puzzle Circular Chart Powerpoint Slide Background Image
This is a possible solutions puzzle circular chart powerpoint slide background image. This is a four stage process. The stages in this process are puzzles, business, problem, solution, game pieces, marketing.

Six Sigma Linear Circles Chart Presentation Powerpoint Templates
This is a six sigma linear circles chart presentation powerpoint templates. This is a five stage process. The stages in this process are bottom line, trained individuals, engagement, project by project, customer focused.

Approaches Of Market Targeting Chart Ppt Images Gallery
This is a approaches of market targeting chart ppt images gallery. This is a three stage process. The stages in this process are undifferentiated approaches, differentiated approaches, concentrated approaches.
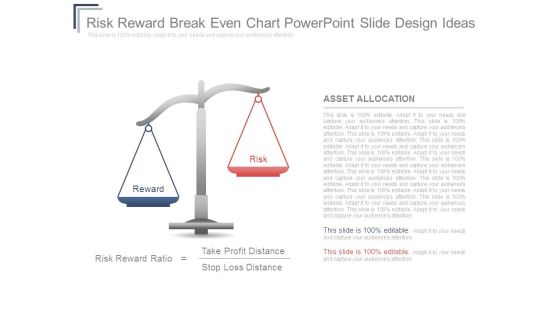
Risk Reward Breakeven Chart Powerpoint Slide Design Ideas
This is a risk reward breakeven chart powerpoint slide design ideas. This is a two stage process. The stages in this process are reward, risk, asset allocation, risk reward ratio, take profit distance, stop loss distance.
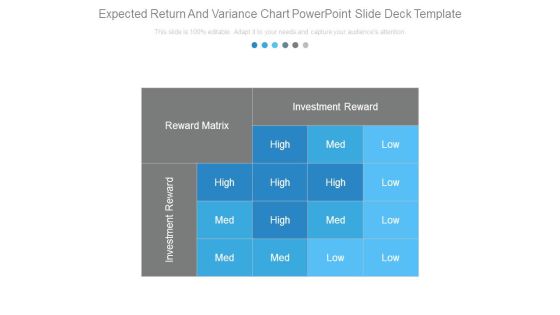
Expected Return And Variance Chart Powerpoint Slide Deck Template
This is a expected return and variance chart powerpoint slide deck template. This is a one stage process. The stages in this process are investment reward, reward matrix, high, med, low.
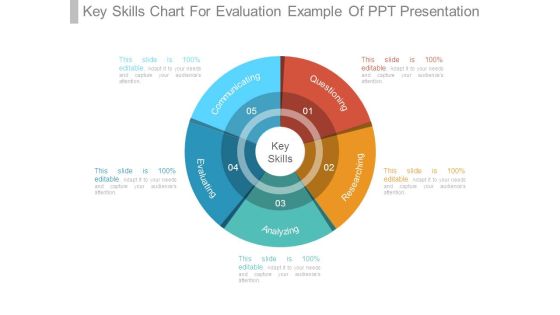
Key Skills Chart For Evaluation Example Of Ppt Presentation
This is a key skills chart for evaluation example of ppt presentation. This is a five stage process. The stages in this process are communicating, questioning, researching, analyzing, evaluating, key skills.
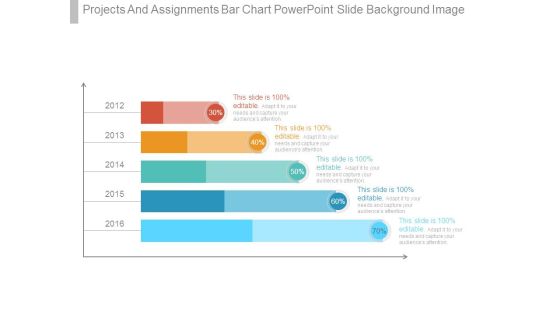
Projects And Assignments Bar Chart Powerpoint Slide Background Image
This is a projects and assignments bar chart powerpoint slide background image. This is a five stage process. The stages in this process are finance, presentation, business, strategy, marketing.

Customer Loyalty Circle Chart Powerpoint Slide Templates Download
This is a customer loyalty circle chart powerpoint slide templates download. This is a six stage process. The stages in this process are grow, engage, attract, reward, retain, loyalty.
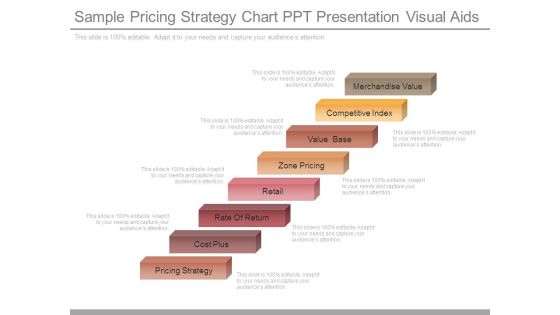
Sample Pricing Strategy Chart Ppt Presentation Visual Aids
This is a sample pricing strategy chart ppt presentation visual aids. This is a eight stage process. The stages in this process are merchandise value, competitive index, value base, zone pricing, retail, rate of return, cost plus, pricing strategy.

Corporate Strategy Hierarchy Chart Powerpoint Slide Presentation Tips
This is a corporate strategy hierarchy chart powerpoint slide presentation tips. This is a four stage process. The stages in this process are corporate strategy, business strategy, functional area strategies, operating strategies.
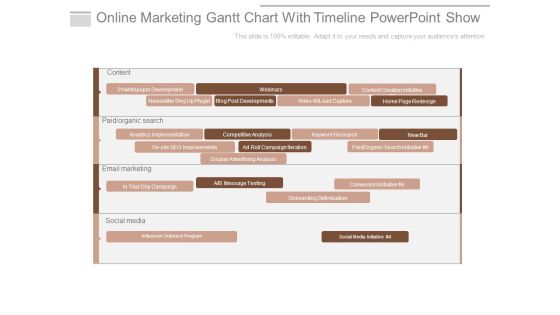
Online Marketing Gantt Chart With Timeline Powerpoint Show
This is a online marketing gantt chart with timeline powerpoint show. This is a four stage process. The stages in this process are content, whitepaper development, webinars, email marketing, social media, content creation initiative, conversion initiative.

Competitor Analysis 2 X 2 Matrix Chart Powerpoint Slide Show
This is a competitor analysis 2 x 2 matrix chart powerpoint slide show. This is a four stage process. The stages in this process are competitor, your company, competitor, complex, simple, fast, slow.

Four Steps Chart For Formation Of Strategy Powerpoint Templates
This is a four steps chart for formation of strategy powerpoint templates. This is a four stage process. The stages in this process are corporate strategy, business strategy, functional area strategies, operating strategies.
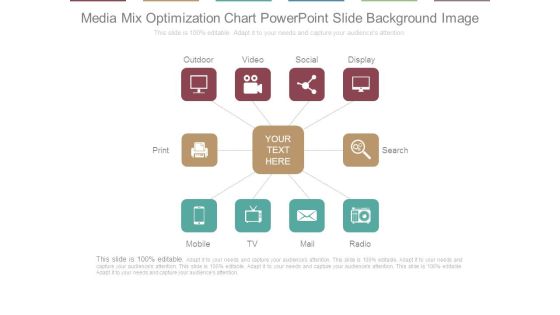
Media Mix Optimization Chart Powerpoint Slide Background Image
This is a media mix optimization chart powerpoint slide background image. This is a ten stage process. The stages in this process are outdoor, video, social, display, search, radio, mail, tv, mobile, print.

Curve Chart For Product Life Cycle Presentation Outline
This is a curve chart for product life cycle presentation outline. This is a five stage process. The stages in this process are sales over time, product extension, introduction, growth, maturity, decline, time.

Product Roadmap Product Launch Deliverables Gantt Chart Ppt Example
This is a product roadmap product launch deliverables gantt chart ppt example. This is a three stage process. The stages in this process are product launch deliverables, product family, product.
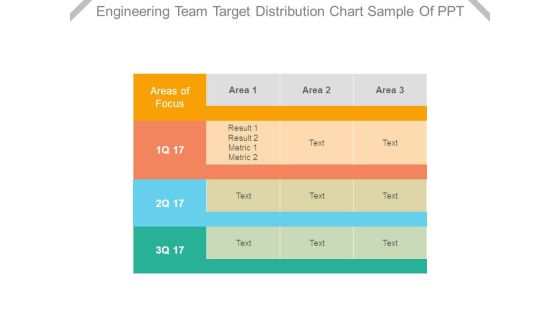
Engineering Team Target Distribution Chart Sample Of Ppt
This is a engineering team target distribution chart sample of ppt. This is a three stage process. The stages in this process are areas of focus, area, result, metric.

Pie Chart For Current Sources Of Profit Ppt Background Template
This is a pie chart for current sources of profit ppt background template. This is a five stage process. The stages in this process are finance, success, business, marketing, percentage, donut.
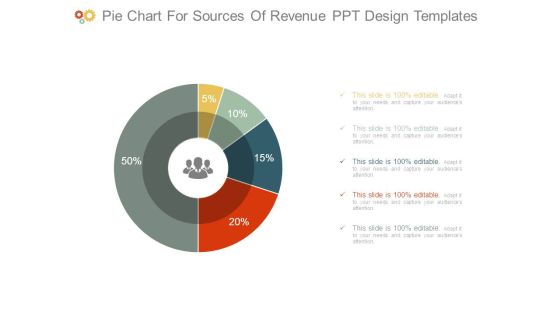
Pie Chart For Sources Of Revenue Ppt Design Templates
This is a pie chart for sources of revenue ppt design templates. This is a five stage process. The stages in this process are finance, success, business, marketing, percentage, donut.
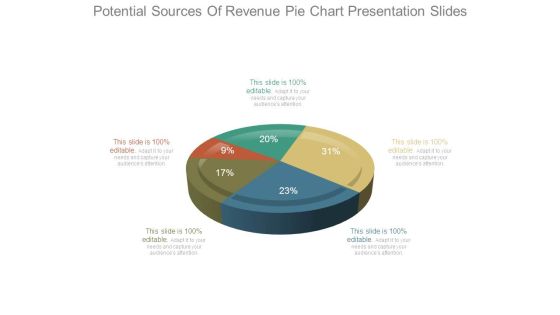
Potential Sources Of Revenue Pie Chart Presentation Slides
This is a potential sources of revenue pie chart presentation slides. This is a five stage process. The stages in this process are finance, success, business, marketing, percentage, pie.

Changes In Competitive Environment Bar Chart Sample Of Ppt Presentation
This is a changes in competitive environment bar chart sample of ppt presentation. This is a four stage process. The stages in this process are engagement, brand, monthly, weekly.

Key Performance Indicators Pie Chart Powerpoint Slide Ideas
This is a key performance indicators pie chart powerpoint slide ideas. This is a four stage process. The stages in this process are focus, objectives, measures, targets, invites, vision and strategy, area of focus.
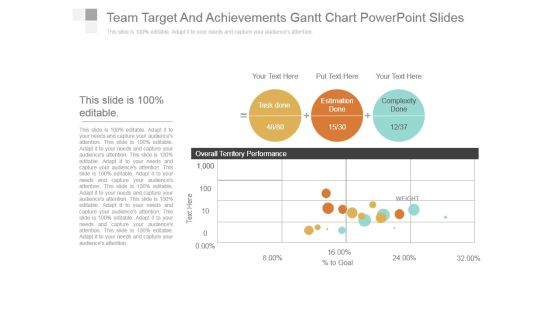
Team Target And Achievements Gantt Chart Powerpoint Slides
This is a team target and achievements gantt chart powerpoint slides. This is a three stage process. The stages in this process are task done, estimation done, complexity done, overall territory performance.

Profit After Tax Pat Growth Chart Powerpoint Slide Designs Download
This is a profit after tax pat growth chart powerpoint slide designs download. This is a five stage process. The stages in this process are growth, success, business, strategy, marketing.
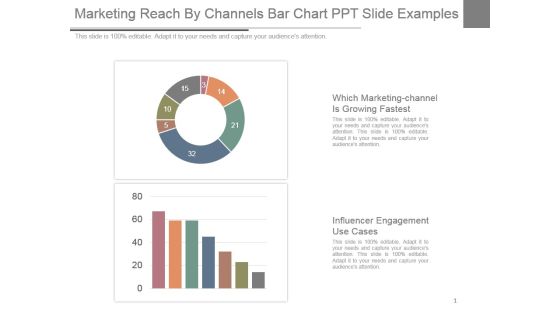
Marketing Reach By Channels Bar Chart Ppt Slide Examples
This is a marketing reach by channels bar chart ppt slide examples. This is a two stage process. The stages in this process are which marketing-channel is growing fastest, influencer engagement use cases.
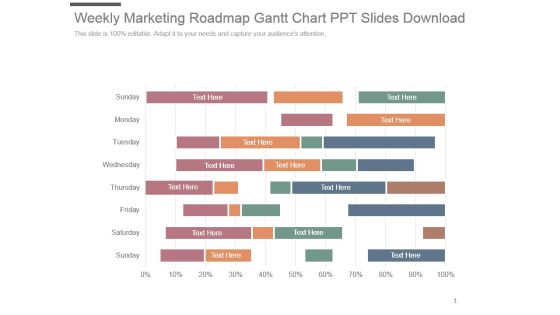
Weekly Marketing Roadmap Gantt Chart Ppt Slides Download
This is a weekly marketing roadmap gantt chart ppt slides download. This is a eight stage process. The stages in this process are sunday, monday, tuesday, wednesday, thursday, friday, saturday, Sunday.

Xbar And R Chart Ppt PowerPoint Presentation Example 2015
This is a xbar and r chart ppt powerpoint presentation example 2015. This is a two stage process. The stages in this process are business, strategy, marketing, success, growth strategy.

Competitive Analysis Matrix Chart Template 1 Ppt PowerPoint Presentation Deck
This is a competitive analysis matrix chart template 1 ppt powerpoint presentation deck. This is a six stage process. The stages in this process are product quality, product fidelity, after sales service, customer service, shipping speed.

Competitive Analysis Scatter Chart Template 2 Ppt PowerPoint Presentation Files
This is a competitive analysis scatter chart template 2 ppt powerpoint presentation files. This is a nine stage process. The stages in this process are users interface, data import, example, pricing, support, update.
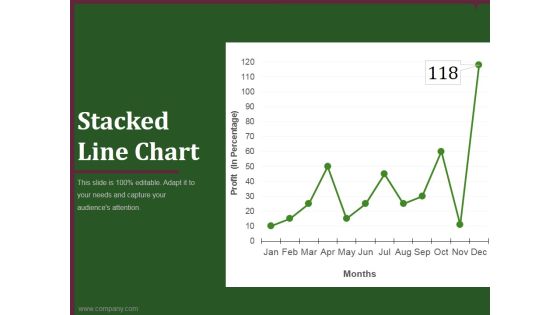
Stacked Line Chart Ppt PowerPoint Presentation Background Image
This is a stacked line chart ppt powerpoint presentation background image. This is a twelve stage process. The stages in this process are business, marketing, analysis, finance, growth strategy.

Volume High Low Close Chart Ppt PowerPoint Presentation Shapes
This is a volume high low close chart ppt powerpoint presentation shapes. This is a five stage process. The stages in this process are business, strategy, analysis, marketing, finance, growth.

Donut Pie Chart Ppt PowerPoint Presentation Infographic Template Layout Ideas
This is a donut pie chart ppt powerpoint presentation infographic template layout ideas. This is a five stage process. The stages in this process are product, business, finance, marketing.

High Low Close Chart Ppt PowerPoint Presentation Layouts Visual Aids
This is a high low close chart ppt powerpoint presentation layouts visual aids. This is a ten stage process. The stages in this process are volume, high, low, close.

High Low Close Chart Ppt PowerPoint Presentation Professional Background Images
This is a high low close chart ppt powerpoint presentation professional background images. This is a five stage process. The stages in this process are close, high, volume, low, open.

Volume High Low Close Chart Ppt PowerPoint Presentation Show Outfit
This is a volume high low close chart ppt powerpoint presentation show outfit. This is a five stage process. The stages in this process are business, strategy, marketing, success, finance, growth.

Volume High Low Close Chart Ppt PowerPoint Presentation Outline Examples
This is a volume high low close chart ppt powerpoint presentation outline examples. This is a five stage process. The stages in this process are high, low, volume, graph, business.

Line Chart Ppt PowerPoint Presentation Model Design Templates
This is a line chart ppt powerpoint presentation model design templates. This is a two stage process. The stages in this process are sales in percentage, financial years, product.

Area Chart Ppt PowerPoint Presentation Show Layout Ideas
This is a area chart ppt powerpoint presentation show layout ideas. This is a two stage process. The stages in this process are product, in percentage, financial year, growth.

Combo Chart Ppt PowerPoint Presentation Infographic Template Brochure
This is a combo chart ppt powerpoint presentation infographic template brochure. This is a eight stage process. The stages in this process are product, market size, strategy, business, marketing.

Scatter Bubble Chart Ppt PowerPoint Presentation Infographics Backgrounds
This is a scatter bubble chart ppt powerpoint presentation infographics backgrounds. This is a five stage process. The stages in this process are highest sale, in price, growth, success, business.
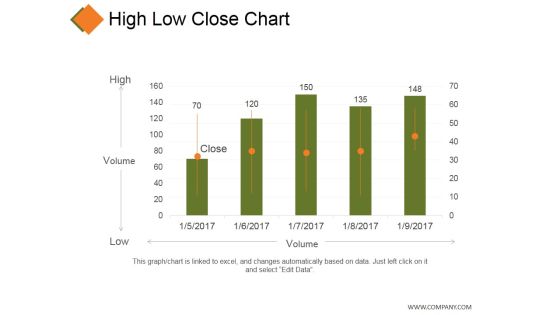
High Low Close Chart Ppt PowerPoint Presentation Model Grid
This is a high low close chart ppt powerpoint presentation model grid. This is a five stage process. The stages in this process are business, high, volume, low, marketing.

Line Bubble Chart Ppt PowerPoint Presentation Professional Infographic Template
This is a line bubble chart ppt powerpoint presentation professional infographic template. This is a five stage process. The stages in this process are product, in price, highest sale, business, finance.

High Low Close Chart Ppt PowerPoint Presentation Styles Display
This is a high low close chart ppt powerpoint presentation styles display. This is a ten stage process. The stages in this process are high, volume, low, close, finance.
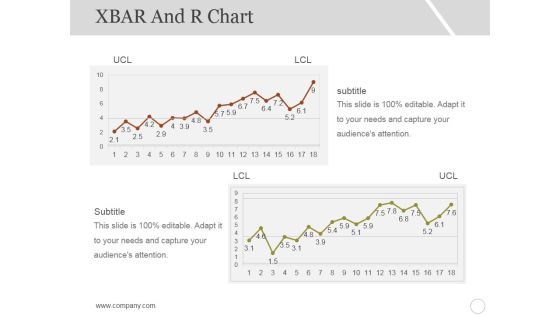
Xbar And R Chart Ppt PowerPoint Presentation Inspiration Styles
This is a xbar and r chart ppt powerpoint presentation inspiration styles. This is a two stage process. The stages in this process are subtitle, lcl, ucl, growth, graph.

Column Chart Ppt PowerPoint Presentation Styles Graphic Tips
This is a column chart ppt powerpoint presentation styles graphic tips. This is a six stage process. The stages in this process are slide bar, business, marketing, strategy, finance.
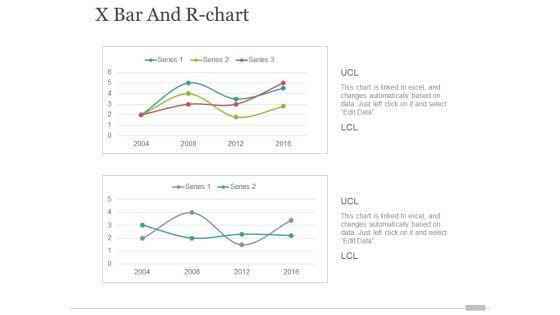
x bar and r chart ppt powerpoint presentation portfolio elements
This is a x bar and r chart ppt powerpoint presentation portfolio elements. This is a two stage process. The stages in this process are finance, business, marketing, growth.

Donut Pie Chart Ppt PowerPoint Presentation Infographics Background Designs
This is a donut pie chart ppt powerpoint presentation infographics background designs. This is a three stage process. The stages in this process are finance, business, marketing, strategy, percentage.
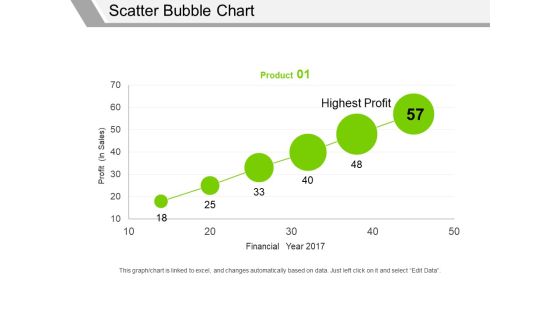
Scatter Bubble Chart Ppt PowerPoint Presentation Professional Graphics Pictures
This is a scatter bubble chart ppt powerpoint presentation professional graphics pictures. This is a one stage process. The stages in this process are profit in sales, financial year, highest profit, product.

High Low Close Chart Ppt PowerPoint Presentation Infographic Template Vector
This is a high low close chart ppt powerpoint presentation infographic template vector. This is a ten stage process. The stages in this process are high, volume, low, product, close.
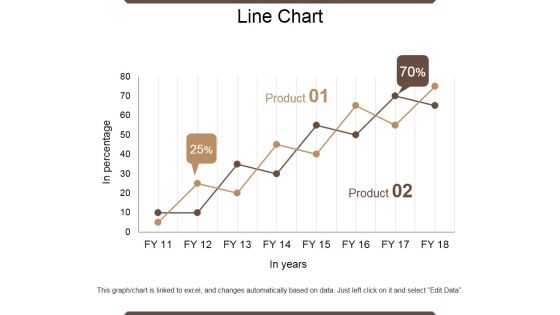
Line Chart Ppt PowerPoint Presentation Outline Infographic Template
This is a line chart ppt powerpoint presentation outline infographic template. This is a two stage process. The stages in this process are in percentage, product, in year, growth, success.

Scatter Bubble Chart Ppt PowerPoint Presentation Summary Files
This is a scatter bubble chart ppt powerpoint presentation summary files. This is a six stage process. The stages in this process are product, financial year, profit, highest profit.

Stock Chart Ppt PowerPoint Presentation Outline Graphics Example
This is a stock chart ppt powerpoint presentation outline graphics example. This is a five stage process. The stages in this process are close, volume, low, high, open, product.

Volume High Low Close Chart Ppt PowerPoint Presentation Gallery Shapes
This is a volume high low close chart ppt powerpoint presentation gallery shapes. This is a five stage process. The stages in this process are high, volume, low, close, finance.

Area Chart Ppt PowerPoint Presentation Infographic Template Samples
This is a area chart ppt powerpoint presentation infographic template samples. This is a two stage process. The stages in this process are in percentage product, business, marketing, growth.
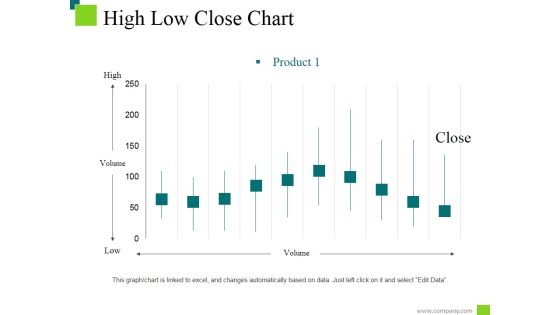
High Low Close Chart Ppt PowerPoint Presentation Styles Information
This is a high low close chart ppt powerpoint presentation styles information. This is a ten stage process. The stages in this process are low, high, product, volume, close.
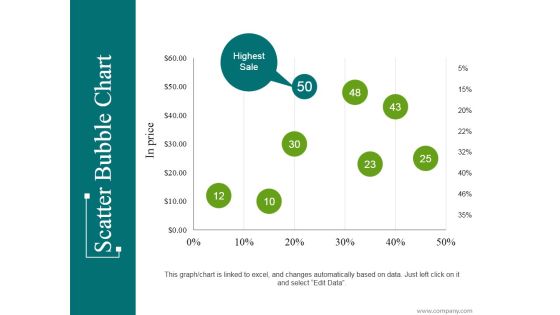
Scatter Bubble Chart Ppt PowerPoint Presentation Infographic Template Introduction
This is a scatter bubble chart ppt powerpoint presentation infographic template introduction. This is a eight stage process. The stages in this process are highest sale, business, marketing, percentage, finance.

High Low Close Chart Ppt PowerPoint Presentation Show Ideas
This is a high low close chart ppt powerpoint presentation show ideas. This is a ten stage process. The stages in this process are high, volume, low, close, finance.
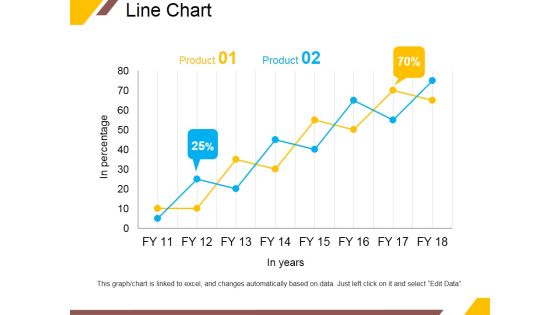
Line Chart Ppt PowerPoint Presentation Portfolio Infographic Template
This is a line chart ppt powerpoint presentation portfolio infographic template. This is a two stage process. The stages in this process are product, in years, business, percentage, growth.

Area Chart Ppt PowerPoint Presentation File Graphic Tips
This is a area chart ppt powerpoint presentation file graphic tips. This is a two stage process. The stages in this process are product, in percentage, financial year, business, growth.
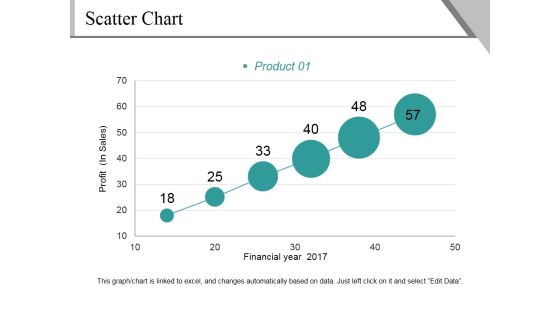
Scatter Chart Ppt PowerPoint Presentation File Background Image
This is a scatter chart ppt powerpoint presentation file background image. This is a six stage process. The stages in this process are profit, financial year, product, growth, success.
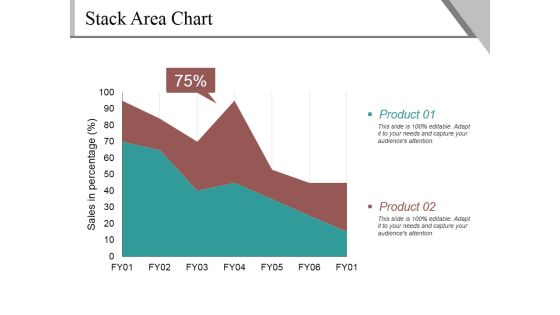
Stack Area Chart Ppt PowerPoint Presentation Gallery Guidelines
This is a stack area chart ppt powerpoint presentation gallery guidelines. This is a two stage process. The stages in this process are sales in percentage, product, percentage, business.

Stack Area Chart Ppt PowerPoint Presentation Example File
This is a stack area chart ppt powerpoint presentation example file. This is a two stage process. The stages in this process are product, sales in percentage, percentage, finance.
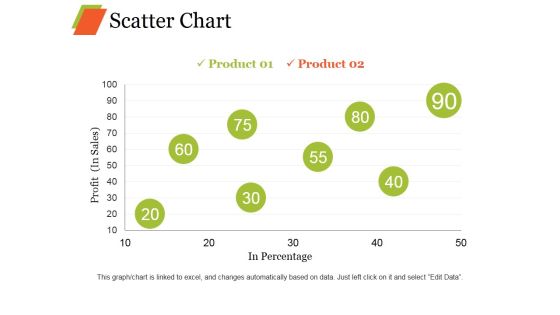
Scatter Chart Ppt PowerPoint Presentation Professional Graphic Images
This is a scatter chart ppt powerpoint presentation professional graphic images. This is a eight stage process. The stages in this process are product, profit, in percentage growth, business.
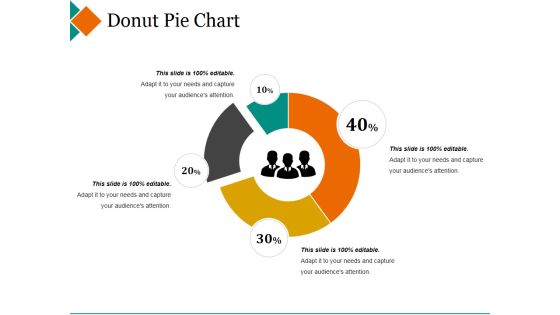
Donut Pie Chart Ppt PowerPoint Presentation Pictures Design Inspiration
This is a donut pie chart ppt powerpoint presentation pictures design inspiration. This is a four stage process. The stages in this process are maximum, donut, minimum, percentage, finance.
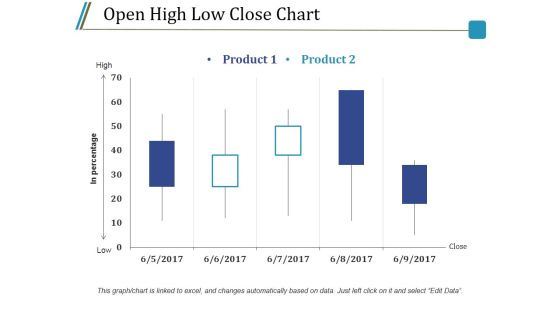
Open High Low Close Chart Ppt PowerPoint Presentation Styles Model
This is a open high low close chart ppt powerpoint presentation styles model. This is a five stage process. The stages in this process are product, high, low, in percentage, close.

Column Chart Ppt PowerPoint Presentation Gallery Graphics Example
This is a column chart ppt powerpoint presentation gallery graphics example. This is a two stage process. The stages in this process are expenditure in, years, business, marketing, growth.
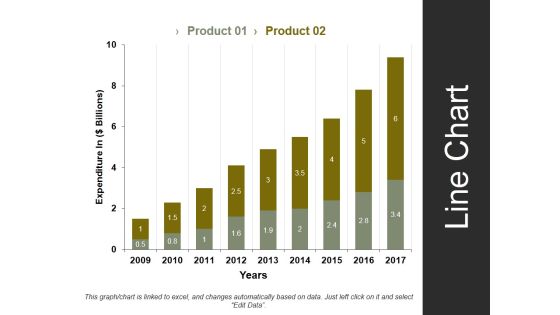
Line Chart Template 1 Ppt PowerPoint Presentation Styles Summary
This is a line chart template 1 ppt powerpoint presentation styles summary. This is a two stage process. The stages in this process are expenditure in, years, business, marketing, strategy.

Stock Chart Template 2 Ppt PowerPoint Presentation Infographic Template Styles
This is a stock chart template 2 ppt powerpoint presentation infographic template styles. This is a one stage process. The stages in this process are high, volume, low, product, volume.

Open High Low Close Chart Ppt PowerPoint Presentation Outline Rules
This is a open high low close chart ppt powerpoint presentation outline rules. This is a two stage process. The stages in this process are product, high, low, close, in percentage.
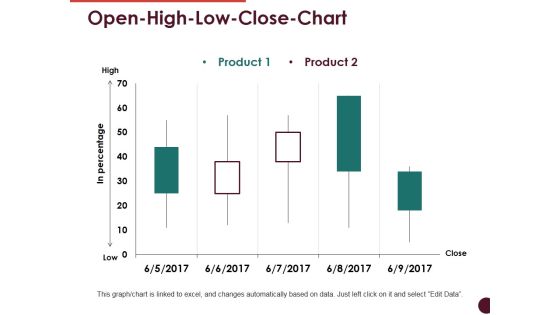
Open High Low Close Chart Ppt PowerPoint Presentation Professional Visuals
This is a open high low close chart ppt powerpoint presentation professional visuals. This is a two stage process. The stages in this process are high, low, in percentage, product, close.

Volume High Low Close Chart Ppt PowerPoint Presentation Infographics Good
This is a volume high low close chart ppt powerpoint presentation infographics good. This is a two stage process. The stages in this process are high, volume, low, product, close.
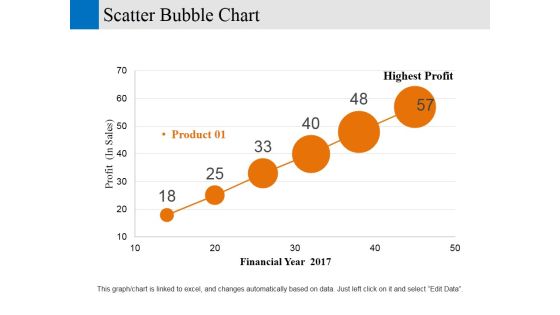
Scatter Bubble Chart Ppt PowerPoint Presentation Gallery Designs Download
This is a scatter bubble chart ppt powerpoint presentation gallery designs download. This is a six stage process. The stages in this process are financial year, profit, business, marketing, strategy.

Scatter Chart Ppt PowerPoint Presentation Ideas Designs Download
This is a scatter chart ppt powerpoint presentation ideas designs download. This is a one stage process. The stages in this process are product, dollar, in percentage, growth, success.

Brand Positioning Chart Ppt PowerPoint Presentation Show Example File
This is a brand positioning chart ppt powerpoint presentation show example file. This is a five stage process. The stages in this process are own product, business, marketing, strategy, analysis.
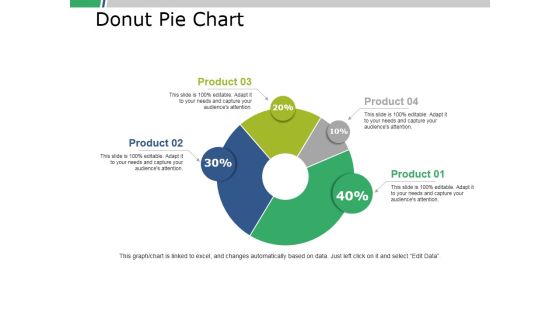
Donut Pie Chart Ppt PowerPoint Presentation Portfolio Slide Download
This is a donut pie chart ppt powerpoint presentation portfolio slide download. This is a four stage process. The stages in this process are business, marketing, finance, percent, donut.

Scatter Bubble Chart Ppt PowerPoint Presentation Styles Objects
This is a scatter bubble chart ppt powerpoint presentation styles objects. This is a two stage process. The stages in this process are product, in price, highest sale, percentage, finance.

Bar Chart Ppt PowerPoint Presentation Infographic Template Master Slide
This is a bar chart ppt powerpoint presentation infographic template master slide. This is a two stage process. The stages in this process are growth, finance, business, analysis, marketing.

Column Chart Ppt PowerPoint Presentation Infographic Template Example File
This is a column chart ppt powerpoint presentation infographic template example file. This is a two stage process. The stages in this process are growth, finance, business, marketing, analysis.
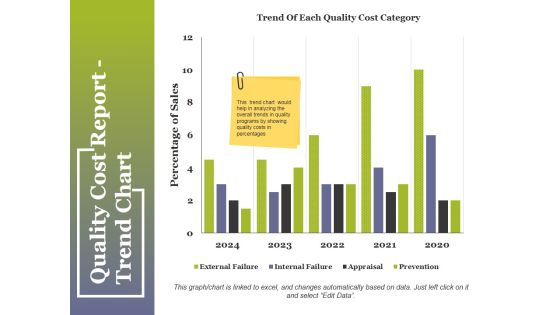
Quality Cost Report Trend Chart Ppt PowerPoint Presentation Summary Pictures
This is a quality cost report trend chart ppt powerpoint presentation summary pictures. This is a two stage process. The stages in this process are compare, business, table, marketing, strategy.

Quality Cost Report Trend Chart Ppt PowerPoint Presentation Outline Guidelines
This is a quality cost report trend chart ppt powerpoint presentation outline guidelines. This is a two stage process. The stages in this process are quality cost, appraisal cost, internal failure cost, external failure cost.
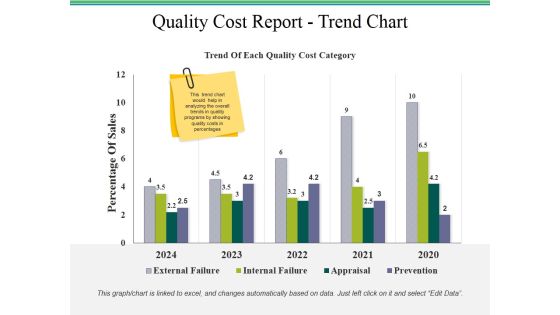
Quality Cost Report Trend Chart Ppt PowerPoint Presentation Styles Templates
This is a quality cost report trend chart ppt powerpoint presentation styles templates. This is a two stage process. The stages in this process are quality cost report, business, finance, marketing, strategy.

quality cost report trend chart ppt powerpoint presentation pictures vector
This is a quality cost report trend chart ppt powerpoint presentation pictures vector. This is a four stage process. The stages in this process are business, finance, marketing, strategy, analysis.
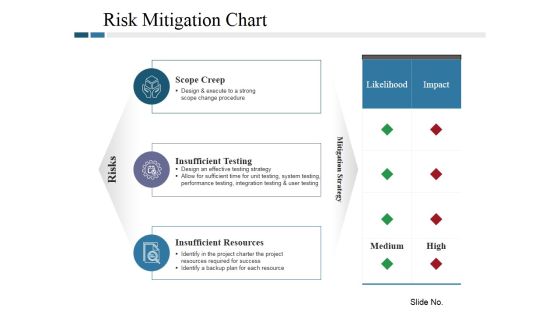
Risk Mitigation Chart Ppt PowerPoint Presentation Model Tips
This is a risk mitigation chart ppt powerpoint presentation model tips. This is a three stage process. The stages in this process are scope creep, insufficient testing, insufficient resources, risks, likelihood.
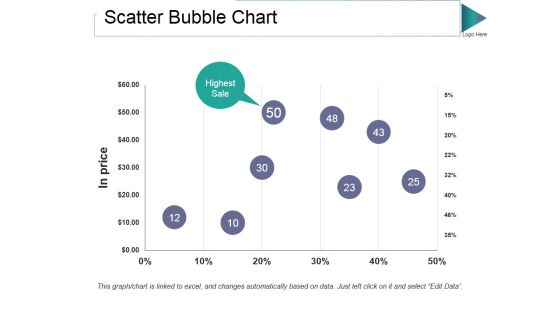
Scatter Bubble Chart Ppt PowerPoint Presentation Gallery Guidelines
This is a scatter bubble chart ppt powerpoint presentation gallery guidelines. This is a one stage process. The stages in this process are in price, highest sale, percentage, finance, business.
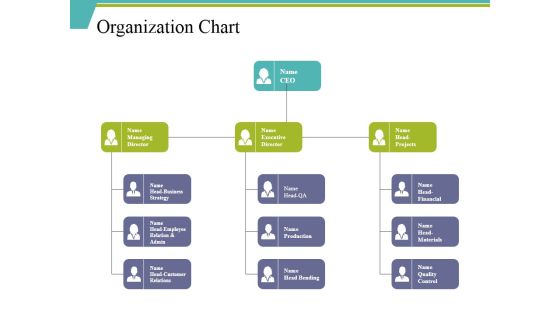
Organization Chart Ppt PowerPoint Presentation File Background Designs
This is a organization chart ppt powerpoint presentation file background designs. This is a three stage process. The stages in this process are ceo, executive director, head financial, production, head bending.
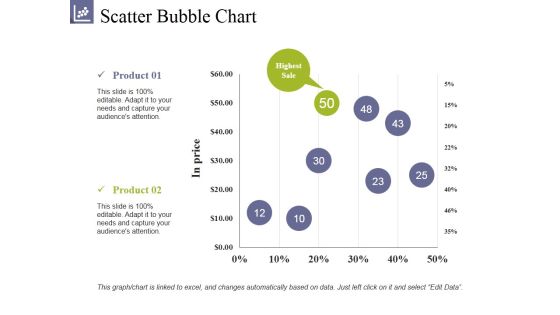
Scatter Bubble Chart Ppt PowerPoint Presentation Summary Clipart
This is a scatter bubble chart ppt powerpoint presentation summary clipart. This is a two stage process. The stages in this process are product, highest sale, in prices, growth, success.

Donut Pie Chart Ppt PowerPoint Presentation Professional Graphic Images
This is a donut pie chart ppt powerpoint presentation professional graphic images. This is a three stage process. The stages in this process are percentage, finance, donut, business, marketing.

Bubble Chart Ppt PowerPoint Presentation Layouts Clipart Images
This is a bubble chart ppt powerpoint presentation layouts clipart images. This is a two stage process. The stages in this process are business, marketing, profit, innovation, technology, idea bulb.

Bar Chart Ppt PowerPoint Presentation Slides Example File
This is a bar chart ppt powerpoint presentation slides example file. This is a two stage process. The stages in this process are product, financial years, sales in percentage.
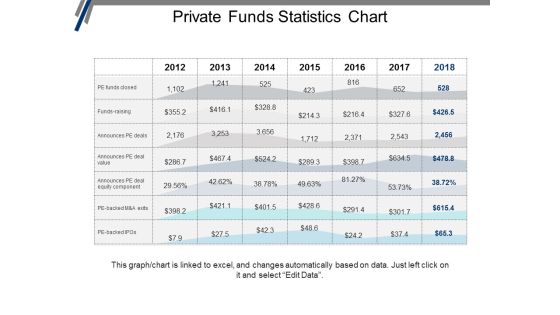
Private Funds Statistics Chart Ppt PowerPoint Presentation Portfolio Graphics Design
This is a private funds statistics chart ppt powerpoint presentation portfolio graphics design. This is a seven stage process. The stages in this process are investment, funding, private equity, venture capital.

Open High Low Close Chart Ppt PowerPoint Presentation Professional Inspiration
This is a open high low close chart ppt powerpoint presentation professional inspiration. This is a five stage process. The stages in this process are high, low, close, business, finance.

Corporate Structure Business ORG Chart Ppt PowerPoint Presentation Slides Template
This is a corporate structure business org chart ppt powerpoint presentation slides template. This is a five stage process. The stages in this process are project governance, governance structure, project structure.

Cost Benefit Analysis Chart Ppt PowerPoint Presentation Slides Example File
This is a cost benefit analysis chart ppt powerpoint presentation slides example file. This is a two stage process. The stages in this process are increase salary, cost benefit, reduced costs, analysis, operating cost.

Donut Pie Chart Ppt PowerPoint Presentation Show Graphics Download
This is a donut pie chart ppt powerpoint presentation show graphics download. This is a three stage process. The stages in this process are percentage, finance, donut, business, marketing.
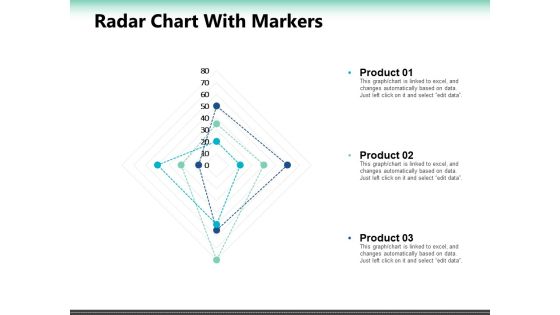
Radar Chart With Markers Ppt PowerPoint Presentation Summary Slide Portrait
This is a radar chart with markers ppt powerpoint presentation summary slide portrait. This is a seven stage process. The stages in this process are percentage, product, business, marketing.

Cost Benefit Analysis Chart Ppt PowerPoint Presentation Ideas Shapes
This is a cost benefit analysis chart ppt powerpoint presentation ideas shapes. This is a two stage process. The stages in this process are reduced costs, operating cost, benefits, costs, increase salary.

Hierarchical Organization Chart Ppt PowerPoint Presentation Ideas Skills
This is a hierarchical organization chart ppt powerpoint presentation ideas skills. This is a three stage process. The stages in this process are business ownership, family business, owned business.
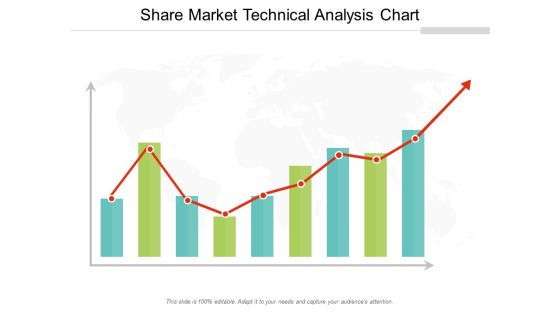
Share Market Technical Analysis Chart Ppt Powerpoint Presentation Professional Rules
This is a share market technical analysis chart ppt powerpoint presentation professional rules. This is a three stage process. The stages in this process are stock market, financial market, bull market.

Mobile With Analytics Chart Ppt PowerPoint Presentation Layouts Graphics
This is a mobile with analytics chart ppt powerpoint presentation layouts graphics. This is a four stage process. The stages in this process are mobile analytics, mobile tracking, mobile web analytics.

Retail Performance Measurement Chart Ppt PowerPoint Presentation Ideas Structure
This is a retail performance measurement chart ppt powerpoint presentation ideas structure. This is a four stage process. The stages in this process are product distribution, distribution system, numeric distribution.

Scatter Bubble Chart Finance Ppt Powerpoint Presentation Layouts Summary
This is a scatter bubble chart finance ppt powerpoint presentation layouts summary. This is a two stage process. The stages in this process are financial, minimum, maximum, marketing, strategy.
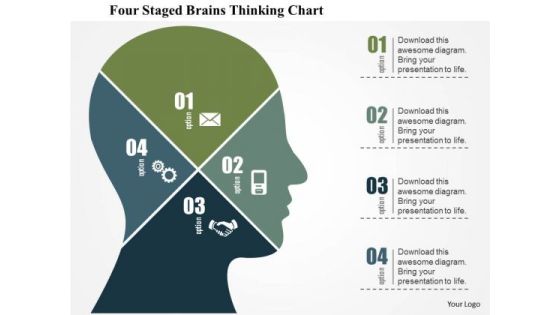
Business Diagram Four Staged Brains Thinking Chart Presentation Template
Graphic of four staged chart in human brain has been used to design this business diagram. This slide depicts concept of thinking process and analysis. Make your presentation more interactive with this business slide.
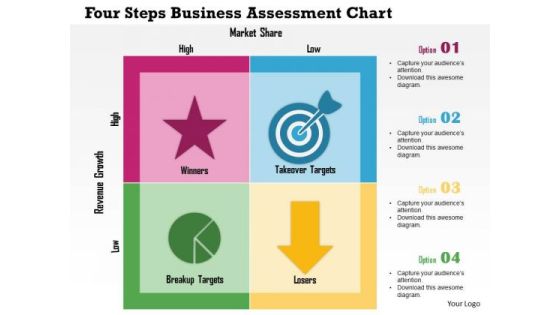
Business Diagram Four Steps Business Assessment Chart Presentation Template
Graphic of four steps assessment chart has been used to design this power point template. This PPT contains the concept of business assessment process. This PPT is suitable for business and marketing related presentations.

Flow Chart Of Software Release Procedure Professional PDF
This slide shows flow chart which can be used by organizations to release software. It includes various stages such as release awareness and assessment, SDS change, build approval, design, build, test, etc. Persuade your audience using this Flow Chart Of Software Release Procedure Professional PDF. This PPT design covers one stages, thus making it a great tool to use. It also caters to a variety of topics including Design, Patching Process, Development. Download this PPT design now to present a convincing pitch that not only emphasizes the topic but also showcases your presentation skills.

Venn Business Chart With Percentage Value Powerpoint Template
This PPT slide contains Venn business chart with percentage values. This PPT diagram is suitable to present data comparison and analysis. Enlighten others on the process with this innovative PowerPoint template.

Outstanding Accounting Payable Procedure Flow Chart Introduction PDF
This slide consists flow chart which shows the sequence of events to be followed by accounts payable department in order to complete a transaction. Key elements include complete purchase worksheet, forward invoice, purchase order sorting, delivery of mail, verification of accounting documents etc. Showcasing this set of slides titled Outstanding Accounting Payable Procedure Flow Chart Introduction PDF. The topics addressed in these templates are Purchase Department, Place Order, Accounting. All the content presented in this PPT design is completely editable. Download it and make adjustments in color, background, font etc. as per your unique business setting.
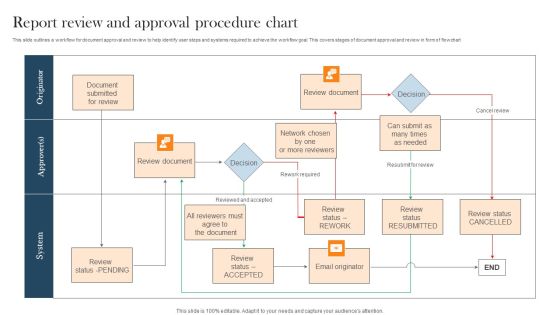
Report Review And Approval Procedure Chart Pictures PDF
This slide outlines a workflow for document approval and review to help identify user steps and systems required to achieve the workflow goal. This covers stages of document approval and review in form of flowchart Showcasing this set of slides titled Report Review And Approval Procedure Chart Pictures PDF. The topics addressed in these templates are Review Document, Chart, Decision. All the content presented in this PPT design is completely editable. Download it and make adjustments in color, background, font etc. as per your unique business setting.

Clinical Trial Phases Chart With Dose Details Graphics PDF
This slide covers the detailed description of the multiple stages of the clinical research process to check new drug efficacy. Also, information regarding the number of subjects who underwent trials is tabulated.Deliver an awe inspiring pitch with this creative Clinical Trial Phases Chart With Dose Details Graphics PDF bundle. Topics like Clinical Trial Phases Chart With Dose Details can be discussed with this completely editable template. It is available for immediate download depending on the needs and requirements of the user.
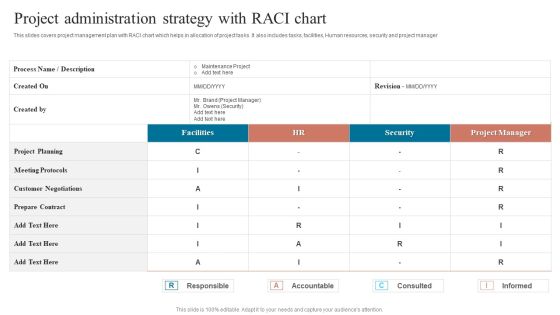
Project Administration Strategy With Raci Chart Rules PDF
This slides covers project management plan with RACI chart which helps in allocation of project tasks. It also includes tasks, facilities, Human resources, security and project manager. Showcasing this set of slides titled Project Administration Strategy With Raci Chart Rules PDF. The topics addressed in these templates are Meeting Protocols, Customer Negotiations, Meeting Protocols. All the content presented in this PPT design is completely editable. Download it and make adjustments in color, background, font etc. as per your unique business setting.

Project Budgeting And Cost Summary Report Chart Demonstration PDF
This slide represents project budgeting and cost summary chart illustrating project designing, project development, project delivery and project management. Pitch your topic with ease and precision using this Project Budgeting And Cost Summary Report Chart Demonstration PDF. This layout presents information on Project Management, Project Delivery, Project Development. It is also available for immediate download and adjustment. So, changes can be made in the color, design, graphics or any other component to create a unique layout.
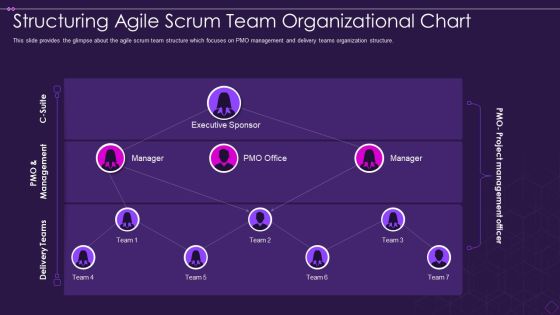
Structuring Agile Scrum Team Organizational Chart Ideas PDF
This slide provides the glimpse about the agile scrum team structure which focuses on PMO management and delivery teams organization structure. Deliver an awe inspiring pitch with this creative structuring agile scrum team organizational chart ideas pdf bundle. Topics like structuring agile scrum team organizational chart can be discussed with this completely editable template. It is available for immediate download depending on the needs and requirements of the user.
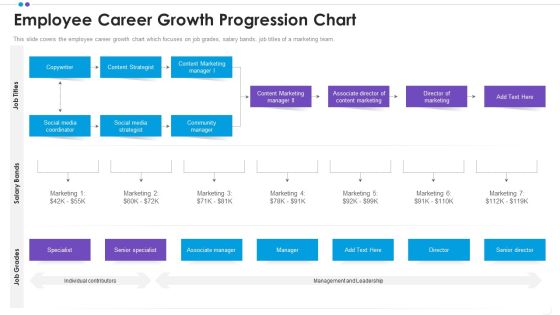
Employee Professional Development Employee Career Growth Progression Chart Formats PDF
This slide covers the employee career growth chart which focuses on job grades, salary bands, job titles of a marketing team.Deliver and pitch your topic in the best possible manner with this employee professional development employee career growth progression chart formats pdf Use them to share invaluable insights on social media coordinator, social media strategist, community manager and impress your audience. This template can be altered and modified as per your expectations. So, grab it now.

RACI Chart For Launching Advertising Campaign Ideas PDF
The purpose of this template is to provide RACI chart for launching marketing campaigns . It covers information about responsible, accountable, consulted and informed team members. Pitch your topic with ease and precision using this RACI Chart For Launching Advertising Campaign Ideas PDF. This layout presents information on Project Management, Webpage Design, Tracking And Reporting. It is also available for immediate download and adjustment. So, changes can be made in the color, design, graphics or any other component to create a unique layout.

Drug Detection And Advancement Activity Chart Brochure PDF
This slide provides information about drug discovery and development activity chart with details such as drug discovery and development process in brief, testing population at each stage, purpose of each step, success rate etc. Deliver an awe inspiring pitch with this creative drug detection and advancement activity chart brochure pdf bundle. Topics like process, development, success rate, patient volunteers can be discussed with this completely editable template. It is available for immediate download depending on the needs and requirements of the user.

Vehicle Management System Process Flow Chart Introduction PDF
This slide represents the flow chart for effectively tracking and managing activities of vehicles such as trucks, cards and construction equipment. It starts with planning, dispatching end ends with control unit and user interface. Showcasing this set of slides titled Vehicle Management System Process Flow Chart Introduction PDF. The topics addressed in these templates are Central Computer, Communication Device, Data Logging. All the content presented in this PPT design is completely editable. Download it and make adjustments in color, background, font etc. as per your unique business setting.

Flow Chart Depicting Working Of Product Development Strategy Sample PDF
This slide showcases a flow chart depicting a product development strategy that assists in turning a concept into a product. It also includes stages such as analyzing current market, identifying potential new markets, getting new ideas, etc. Showcasing this set of slides titled Flow Chart Depicting Working Of Product Development Strategy Sample PDF. The topics addressed in these templates are Existing Market, Profitability, Production Cost. All the content presented in this PPT design is completely editable. Download it and make adjustments in color, background, font etc. as per your unique business setting.

5 Reinforcing Components Arrow Diagram Chart Business Prototyping PowerPoint Slides
We present our 5 reinforcing components arrow diagram chart business prototyping PowerPoint Slides.Use our Arrows PowerPoint Templates because it shows the pyramid which is a symbol of the desire to reach the top in a steady manner. Present our Business PowerPoint Templates because watch the excitement levels rise as they realise their worth. Download and present our Competition PowerPoint Templates because you know your business and have a vision for it. Use our Design PowerPoint Templates because your business and plans for its growth consist of processes that are highly co-related. Download and present our Shapes PowerPoint Templates because the atmosphere in the worplace is electric.Use these PowerPoint slides for presentations relating to arrow, arrows, block, business, chart, design, development, diagram, direction, element, flow, flowchart, graph, linear, management, organization, process, program, section, sign, solution, symbol. The prominent colors used in the PowerPoint template are Blue, Gray, Black. Professionals tell us our 5 reinforcing components arrow diagram chart business prototyping PowerPoint Slides are Efficacious. The feedback we get is that our block PowerPoint templates and PPT Slides are Appealing. We assure you our 5 reinforcing components arrow diagram chart business prototyping PowerPoint Slides are designed by professionals Customers tell us our chart PowerPoint templates and PPT Slides are Fantastic. Presenters tell us our 5 reinforcing components arrow diagram chart business prototyping PowerPoint Slides are Fun. People tell us our block PowerPoint templates and PPT Slides are Nice.
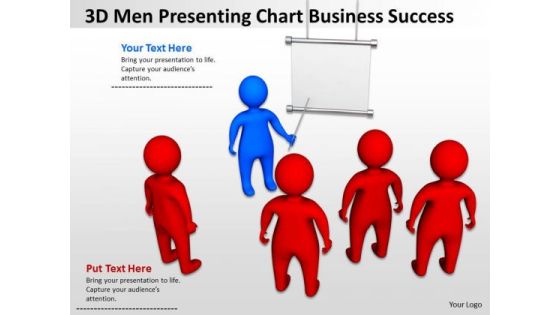
Business Organizational Chart Examples 3d Men Pressenting Success PowerPoint Slides
We present our business organizational chart examples 3d men pressenting success PowerPoint Slides.Present our Communication PowerPoint Templates because Our PowerPoint Templates and Slides ensures Effective communication. They help you put across your views with precision and clarity. Download and present our Business PowerPoint Templates because Our PowerPoint Templates and Slides will let your ideas bloom. Create a bed of roses for your audience. Use our Shapes PowerPoint Templates because Our PowerPoint Templates and Slides will Embellish your thoughts. They will help you illustrate the brilliance of your ideas. Download and present our People PowerPoint Templates because It can Bubble and burst with your ideas. Present our Leadership PowerPoint Templates because Our PowerPoint Templates and Slides will effectively help you save your valuable time. They are readymade to fit into any presentation structure. Use these PowerPoint slides for presentations relating to 3d, Background, Blank, Board, Business, Character, Chart, Communication, Computer, Concept, Consultant, Cooperation, Cute, Dialogue, Discussion, Easel, Empty, Expert, Expertise, Figure, Flipchart, Graphic, Group, Guy, Human, Icon, Idea, Illustration, Leader, Leadership, Manager, Meeting, Men, People, Person, Plan, Pointing, Present, Presentation, Puppet, Speaker, Speech, Teamwork, Whiteboard. The prominent colors used in the PowerPoint template are Red, White, Blue. Presenters tell us our business organizational chart examples 3d men pressenting success PowerPoint Slides are visually appealing. PowerPoint presentation experts tell us our Chart PowerPoint templates and PPT Slides are designed by professionals Professionals tell us our business organizational chart examples 3d men pressenting success PowerPoint Slides will make you look like a winner. People tell us our Chart PowerPoint templates and PPT Slides are designed by a team of presentation professionals. The feedback we get is that our business organizational chart examples 3d men pressenting success PowerPoint Slides are designed by professionals Customers tell us our Chart PowerPoint templates and PPT Slides will get their audience's attention.

Working Capital Modelling Chart Ppt PowerPoint Presentation Slides Deck
Presenting this set of slides with name working capital modelling chart ppt powerpoint presentation slides deck. The topics discussed in these slides are business, management, planning, strategy, marketing. This is a completely editable PowerPoint presentation and is available for immediate download. Download now and impress your audience.
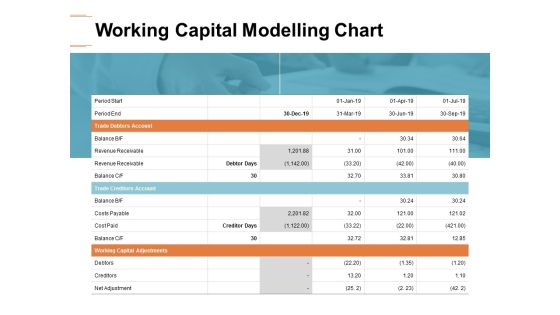
Working Capital Modelling Chart Ppt PowerPoint Presentation Visual Aids Pictures
presenting this set of slides with name working capital modelling chart ppt powerpoint presentation visual aids pictures. the topics discussed in these slides are trade debtors account, trade creditors account, working capital adjustments. this is a completely editable powerpoint presentation and is available for immediate download. download now and impress your audience.

Flow Chart Implementation Business Plans Ppt Sales Template PowerPoint Templates
We present our flow_chart_implementation_business_plans_ppt_sales_template_PowerPoint_templates.Present our Process and Flows PowerPoint Templates because Our PowerPoint Templates and Slides will let your ideas bloom. Create a bed of roses for your audience. Present our Circle Charts PowerPoint Templates because Timeline crunches are a fact of life. Meet all deadlines using our PowerPoint Templates and Slides. Present our Business PowerPoint Templates because Our PowerPoint Templates and Slides will Embellish your thoughts. They will help you illustrate the brilliance of your ideas. Use our Shapes PowerPoint Templates because Our PowerPoint Templates and Slides are created by a hardworking bunch of busybees. Always flitting around with solutions gauranteed to please. Use our Marketing PowerPoint Templates because You canTake a leap off the starting blocks with our PowerPoint Templates and Slides. They will put you ahead of the competition in quick
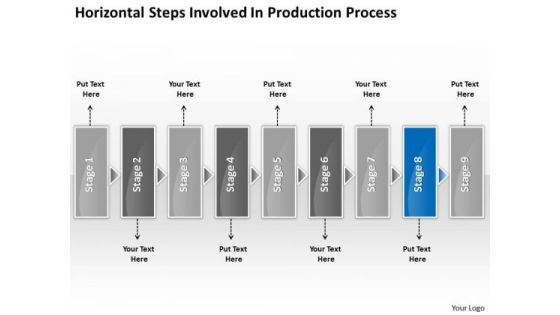
Horizontal Steps Involved Production Processs Business Fishbone Chart PowerPoint Templates
We present our horizontal steps involved production processs business fishbone chart PowerPoint templates.Download and present our Arrows PowerPoint Templates because this layout helps you to see satisfaction spread across the room as they unravel your gifted views. Use our Shapes PowerPoint Templates because you should take your team soaring to the pinnacle they crave. Present our Business PowerPoint Templates because this is the unerring accuracy in reaching the target. the effortless ability to launch into flight. Use our Boxes PowerPoint Templates because your listeners do not have to put on their thinking caps. Download our Communication PowerPoint Templates because you can gain the success to desired levels in one go.Use these PowerPoint slides for presentations relating to abstract, arrow, blank, business, chart, circular, circulation, concept, conceptual, design, diagram, executive, flow, horizontal, icon, idea, illustration, management, model, numbers, organization, process, progression, resource, sequence, stages, steps, strategy. The prominent colors used in the PowerPoint template are Blue, Gray, Black. The feedback we get is that our horizontal steps involved production processs business fishbone chart PowerPoint templates are Magnificent. PowerPoint presentation experts tell us our chart PowerPoint templates and PPT Slides are Elegant. People tell us our horizontal steps involved production processs business fishbone chart PowerPoint templates are Nice. Professionals tell us our circulation PowerPoint templates and PPT Slides are Colorful. You can be sure our horizontal steps involved production processs business fishbone chart PowerPoint templates are Fun. We assure you our concept PowerPoint templates and PPT Slides are designed by a team of presentation professionals.

Project Closure Chart With Version Control Ppt Professional Deck PDF
Showcasing this set of slides titled project closure chart with version control ppt professional deck pdf. The topics addressed in these templates are project closure report, project closure report version control. All the content presented in this PPT design is completely editable. Download it and make adjustments in color, background, font etc. as per your unique business setting.

Fire Detection System And Control Panel Comparison Chart Information PDF
Pitch your topic with ease and precision using this Fire Detection System And Control Panel Comparison Chart Information PDF. This layout presents information on Digital Communicator, System Voltage, Remote Annunciator. It is also available for immediate download and adjustment. So, changes can be made in the color, design, graphics or any other component to create a unique layout.
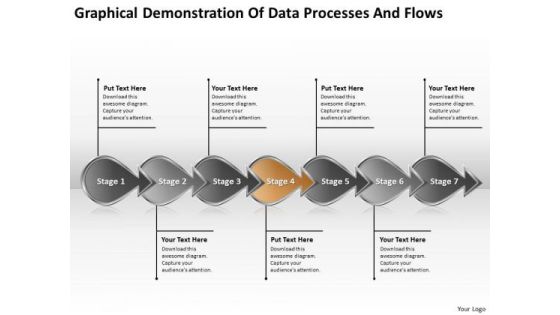
Demonstration Of Data Processes And Flows Chart Flowcharting PowerPoint Templates
We present our demonstration of data processes and flows chart flowcharting PowerPoint templates.Download and present our Leadership PowerPoint Templates because you know what it takes to keep it fit and healthy. Use our Business PowerPoint Templates because this template helps you to grab the attention of your listeners. Download our Arrows PowerPoint Templates because it helps to anticipate the doubts and questions in the minds of your colleagues and enlighten them with your inspired strategy to garner desired success. Download our Marketing PowerPoint Templates because the mind is always whirring with new ideas. Use our Process and Flows PowerPoint Templates because forward thinking is the way to go.Use these PowerPoint slides for presentations relating to Arrow Arrows Block Business Chart Design Development Diagram Direction Element Flow Flowchart Graph Linear Management Organization Process Program Section Sign Solution Symbol. The prominent colors used in the PowerPoint template are Orange, Gray, Black. Use our demonstration of data processes and flows chart flowcharting PowerPoint templates are Gorgeous. Presenters tell us our Block PowerPoint templates and PPT Slides are Radiant. Presenters tell us our demonstration of data processes and flows chart flowcharting PowerPoint templates are Tasteful. You can be sure our Development PowerPoint templates and PPT Slides are Versatile. PowerPoint presentation experts tell us our demonstration of data processes and flows chart flowcharting PowerPoint templates are Clever. Professionals tell us our Block PowerPoint templates and PPT Slides are Second to none.
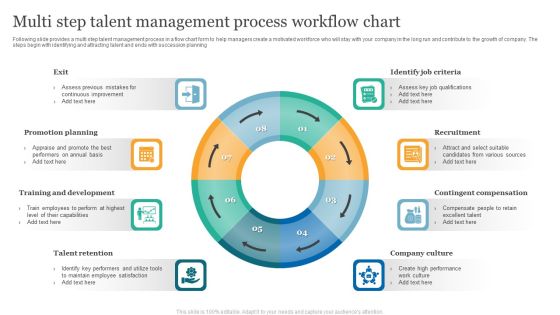
Multi Step Talent Management Process Workflow Chart Background PDF
Following slide provides a multi step talent management process in a flow chart form to help managers create a motivated workforce who will stay with your company in the long run and contribute to the growth of company. The steps begin with identifying and attracting talent and ends with succession planning. Presenting Multi Step Talent Management Process Workflow Chart Background PDF to dispense important information. This template comprises Eight stages. It also presents valuable insights into the topics including Promotion Planning, Training And Development, Talent Retention. This is a completely customizable PowerPoint theme that can be put to use immediately. So, download it and address the topic impactfully.

PowerPoint Presentation Process Layoutchart Business Flow Chart Slides
We present our powerpoint presentation process layoutchart business flow chart Slides.Use our Marketing PowerPoint Templates because it Saves your time as a prized possession, an ideal aid to give an ideal presentation. Download our Leadership PowerPoint Templates because by using this slide you can Heighten the anticipation of your audience listing . Use our Business PowerPoint Templates because watch the excitement levels rise as they realise their worth. Download our Shapes PowerPoint Templates because you can Show them how you can save the day. Present our Arrows PowerPoint Templates because there is a very good saying that prevention is better than cure, either way you have a store of knowledge for sure.Use these PowerPoint slides for presentations relating to Abstract, Arrow, Arrows, Business, Chart, Design, Development, Diagram, Direction, Element, Flow, Flowchart, Graph, Linear, Management, Model, Motion, Organization, Plan, Process, Program, Section, Segment, Set, Sign, Solution, Strategy, Symbol, Technology,,. The prominent colors used in the PowerPoint template are White, Green, Gray. PowerPoint presentation experts tell us our powerpoint presentation process layoutchart business flow chart Slides are Chic. Customers tell us our Direction PowerPoint templates and PPT Slides are Spectacular. Use our powerpoint presentation process layoutchart business flow chart Slides are Magnificent. Use our Direction PowerPoint templates and PPT Slides are designed by a team of presentation professionals. We assure you our powerpoint presentation process layoutchart business flow chart Slides look good visually. People tell us our Diagram PowerPoint templates and PPT Slides look good visually.
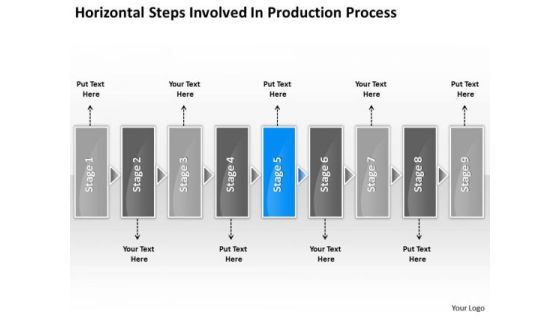
Horizontal Steps Involved Production Process Slides Flow Chart PowerPoint Templates
We present our horizontal steps involved production process Slides flow chart PowerPoint templates.Download our Arrows PowerPoint Templates because it gives a core idea about various enveloping layers. Download our Shapes PowerPoint Templates because you can Take your team along by explaining your plans. Use our Business PowerPoint Templates because maximising sales of your product is the intended destination. Use our Boxes PowerPoint Templates because our template will help pinpoint their viability. Use our Communication PowerPoint Templates because it can illustrate your chain of ideas focusing on that aspect or resource in order to enhance the quality of your product.Use these PowerPoint slides for presentations relating to abstract, arrow, blank, business, chart, circular, circulation, concept, conceptual, design, diagram, executive, flow, horizontal, icon, idea, illustration, management, model, numbers, organization, process, progression, resource, sequence, stages, steps, strategy. The prominent colors used in the PowerPoint template are Blue, Gray, Black. The feedback we get is that our horizontal steps involved production process Slides flow chart PowerPoint templates are Magnificent. PowerPoint presentation experts tell us our circulation PowerPoint templates and PPT Slides are Second to none. People tell us our horizontal steps involved production process Slides flow chart PowerPoint templates are Spiffy. Professionals tell us our concept PowerPoint templates and PPT Slides are Breathtaking. You can be sure our horizontal steps involved production process Slides flow chart PowerPoint templates are No-nonsense. We assure you our concept PowerPoint templates and PPT Slides are Radiant.
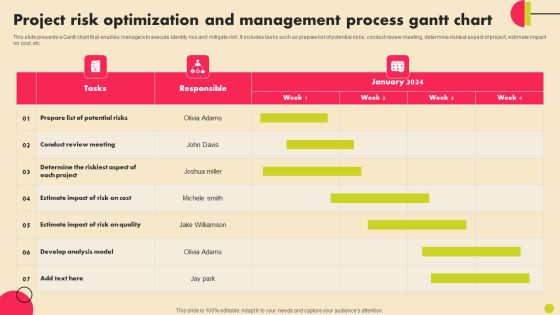
Project Risk Optimization And Management Process Gantt Chart Introduction PDF
This slide presents a Gantt chart that enables managers to execute identity risk and mitigate risk. It includes tasks such as prepare list of potential risks, conduct review meeting, determine riskiest aspect of project, estimate impact on cost, etc. Pitch your topic with ease and precision using this Project Risk Optimization And Management Process Gantt Chart Introduction PDF. This layout presents information on Determine, Develop Analysis Model, Potential Risks. It is also available for immediate download and adjustment. So, changes can be made in the color, design, graphics or any other component to create a unique layout.
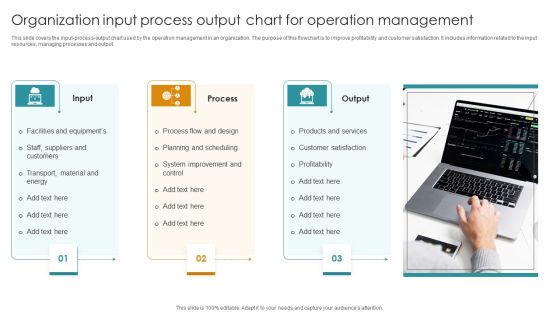
Organization Input Process Output Chart For Operation Management Designs PDF
This slide covers the input-process-output chart used by the operation management in an organization. The purpose of this flowchart is to improve profitability and customer satisfaction. It includes information related to the input resources, managing processes and output. Presenting Organization Input Process Output Chart For Operation Management Designs PDF to dispense important information. This template comprises Three stages. It also presents valuable insights into the topics including Process Flow And Design, Products And Services Transport, Material And Energy. This is a completely customizable PowerPoint theme that can be put to use immediately. So, download it and address the topic impactfully.
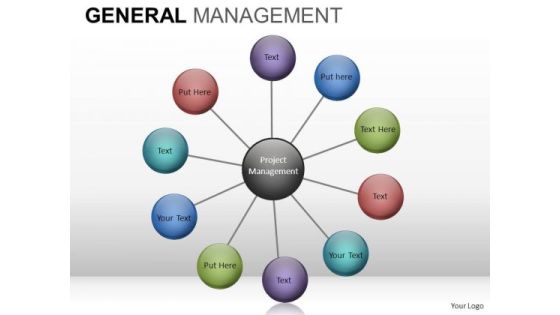
Wheel Chart Diagram PowerPoint Slides And Editable Ppt Templates Download
Wheel_Chart_Diagram_PowerPoint_slides_and_Editable_PPT_templates_Download-These high quality powerpoint pre-designed slides and powerpoint templates have been carefully created by our professional team to help you impress your audience. All slides have been created and are 100% editable in powerpoint. Each and every property of any graphic - color, size, orientation, shading, outline etc. can be modified to help you build an effective powerpoint presentation. Any text can be entered at any point in the powerpoint template or slide. Simply DOWNLOAD, TYPE and PRESENT! These PowerPoint presentation slides can be used to represent themes relating to --Abstract, action, analysis, blank, business, chart, clipart, commerce, concept, conceptual, design, diagram, direction, flow, generic, goals, guide, guidelines, heirarchy, icon, idea, illustration, lingakes, links, manage, management, mba, model, organization, performance, plan, process, project, relationship, representation, resource, steps, strategy, success, tactics, theoretical, theory, tool, workflow-Wheel_Chart_Diagram_PowerPoint_slides_and_Editable_PPT_templates_Download

Working Capital Modelling Chart Ppt PowerPoint Presentation Model Deck
Presenting this set of slides with name working capital modelling chart ppt powerpoint presentation model deck. The topics discussed in these slides are business, management, planning, strategy, marketing. This is a completely editable PowerPoint presentation and is available for immediate download. Download now and impress your audience.

7 Arrows Diverging Representing Process Model Circular Chart PowerPoint Templates
We present our 7 arrows diverging representing process model Circular Chart PowerPoint templates.Use our Sale PowerPoint Templates because you can Highlight the key components of your entire manufacturing/ business process. Download our Arrows PowerPoint Templates because this template with an image of helps you chart the course of your presentation. Present our Process and Flows PowerPoint Templates because our creative template will lay down your views. Present our Business PowerPoint Templates because you too have got the framework of your companys growth in place. Download and present our Shapes PowerPoint Templates because your listeners do not have to put on their thinking caps.Use these PowerPoint slides for presentations relating to Abstract, Arrow, Art, Artistic, Background, Banner, Boost, Box, Business, Clip Art, Color, Colorful, Concept, Cover, Creative, Decide, Decision, Design, Direction, Finance, Futuristic, Graphic, Icon, Idea, Illustration, Increase, Info, Information, Journey, Label, Modern, Path, Pattern, Pop, Print, Process, Sale, Solution, Statistic, Sticker, Stylish, Template. The prominent colors used in the PowerPoint template are Blue, Gray, Black. PowerPoint presentation experts tell us our 7 arrows diverging representing process model Circular Chart PowerPoint templates are Radiant. People tell us our Background PowerPoint templates and PPT Slides are Upbeat. People tell us our 7 arrows diverging representing process model Circular Chart PowerPoint templates are Sparkling. Presenters tell us our Background PowerPoint templates and PPT Slides are Functional. Customers tell us our 7 arrows diverging representing process model Circular Chart PowerPoint templates are Delightful. The feedback we get is that our Boost PowerPoint templates and PPT Slides are Festive.
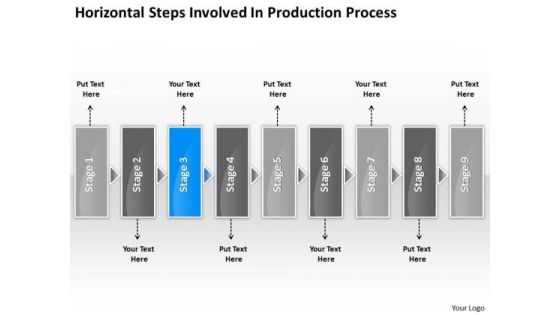
Steps Involved Production Processs Chart Electrical Design PowerPoint Slides
We present our steps involved production processs chart electrical design PowerPoint Slides.Download and present our Advertising PowerPoint Templates because you require care and diligence to function well. Download and present our Business PowerPoint Templates because you can see clearly through to the bigger bowl ahead. Time your jump to perfection and hit the nail on the head. Download and present our Shapes PowerPoint Templates because you have the people in place, selected the team leaders and all are raring to go. Download our Process and Flow PowerPoint Templates because there is a very good saying that prevention is better than cure, either way you have a store of knowledge for sure. Present our Arrows PowerPoint Templates because excite your audience with the brilliance of your thoughts.Use these PowerPoint slides for presentations relating to Abstract, Action, Attach, Box, Business, Center, Chain, Chart, Color, Communication, Concept, Connection, Cube, Cycle, Data, Diagram, Flow, Globe, Horizontal, Idea, Illustration, Information, Interaction, Jigsaw, Join, Link, Pieces, Process, Puzzle, Relation, Relationship, Shape, Success. The prominent colors used in the PowerPoint template are Blue, Gray, White. PowerPoint presentation experts tell us our steps involved production processs chart electrical design PowerPoint Slides will help you be quick off the draw. Just enter your specific text and see your points hit home. Customers tell us our Chart PowerPoint templates and PPT Slides are Flirty. Use our steps involved production processs chart electrical design PowerPoint Slides are Elevated. Use our Box PowerPoint templates and PPT Slides are Graceful. We assure you our steps involved production processs chart electrical design PowerPoint Slides are Majestic. People tell us our Chart PowerPoint templates and PPT Slides are Versatile.

Arrows Pointing Different Directions Circular Flow Process Chart PowerPoint Slide
We present our arrows pointing different directions Circular Flow Process Chart PowerPoint Slide.Present our Arrows PowerPoint Templates because your team and you always raise a toast. Use our Process and Flows PowerPoint Templates because this template with an image of helps you chart the course of your presentation. Download and present our Business PowerPoint Templates because the fruits of your labour are beginning to show.Enlighten them on the great plans you have for their enjoyment. Present our Marketing PowerPoint Templates because this emphasises on the relevance and importance of all milestones along the way. Download our Shapes PowerPoint Templates because you can Determine your targets and sequence them as per your priorities.Use these PowerPoint slides for presentations relating to Process,arrow, background, banner,blue, , choice, concept,creative, design, direction, flow, four,illustration, infographic, instruction, label,layout, manual, marketing, modern, next,number, offer, one, options, order, pointer, process, product,promotion, sequence, simple, special,step, symbol, business. The prominent colors used in the PowerPoint template are Green lime, White, Black. You can be sure our arrows pointing different directions Circular Flow Process Chart PowerPoint Slide are Reminiscent. PowerPoint presentation experts tell us our choice PowerPoint templates and PPT Slides are Colorful. Professionals tell us our arrows pointing different directions Circular Flow Process Chart PowerPoint Slide are Nostalgic. Presenters tell us our creative PowerPoint templates and PPT Slides are Romantic. Professionals tell us our arrows pointing different directions Circular Flow Process Chart PowerPoint Slide are Delightful. Customers tell us our choice PowerPoint templates and PPT Slides are Delightful.
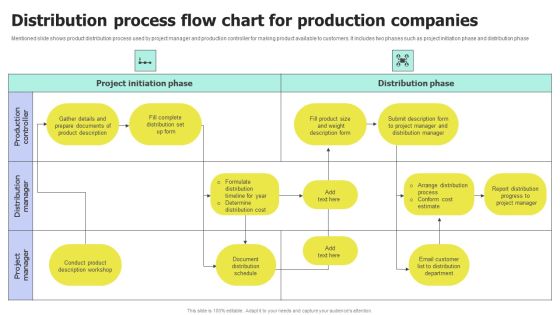
Distribution Process Flow Chart For Production Companies Portrait PDF
Mentioned slide shows product distribution process used by project manager and production controller for making product available to customers. It includes two phases such as project initiation phase and distribution phase. Showcasing this set of slides titled Distribution Process Flow Chart for Production Companies Portrait PDF. The topics addressed in these templates are Process Flow Chart, Production Companies. All the content presented in this PPT design is completely editable. Download it and make adjustments in color, background, font etc. as per your unique business setting.

Six Sigma Circular Chart With Down Arrows Powerpoint Slide Images
This is a six sigma circular chart with down arrows powerpoint slide images. This is a five stage process. The stages in this process are recognize, realize, measure, define, analyze, improve, control, voice of customer and voice of process, practical problem, statistical problem, statistical solution, practical solution, control plan, result.

PMP Procedure Chart IT Roadmap Ppt Outline Gallery PDF
This is a pmp procedure chart it poste it notes ppt portfolio guidelines pdf template with various stages. Focus and dispense information on four stages using this creative set, that comes with editable features. It contains large content boxes to add your information on topics like roadmap. You can also showcase facts, figures, and other relevant content using this PPT layout. Grab it now.
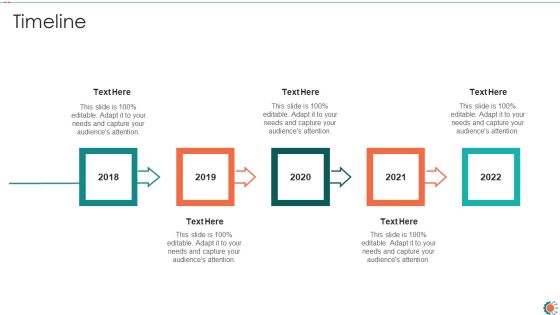
PMP Procedure Chart IT Timeline Ppt Portfolio Outline PDF
Presenting pmp procedure chart it poste it notes ppt portfolio guidelines pdf to provide visual cues and insights. Share and navigate important information on five stages that need your due attention. This template can be used to pitch topics like timeline, 2018 to 2021. In addtion, this PPT design contains high resolution images, graphics, etc, that are easily editable and available for immediate download.
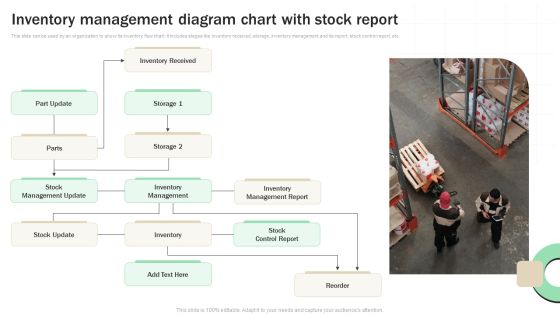
Inventory Management Diagram Chart With Stock Report Topics PDF
This slide can be used by an organization to show its inventory flow chart. It includes stages like inventory received, storage, inventory management and its report, stock control report, etc. Persuade your audience using this Inventory Management Diagram Chart With Stock Report Topics PDF. This PPT design covers one stages, thus making it a great tool to use. It also caters to a variety of topics including Inventory Management Report, Stock Control Report, Stock Report. Download this PPT design now to present a convincing pitch that not only emphasizes the topic but also showcases your presentation skills.
