AI PPT Maker
Templates
PPT Bundles
Design Services
Business PPTs
Business Plan
Management
Strategy
Introduction PPT
Roadmap
Self Introduction
Timelines
Process
Marketing
Agenda
Technology
Medical
Startup Business Plan
Cyber Security
Dashboards
SWOT
Proposals
Education
Pitch Deck
Digital Marketing
KPIs
Project Management
Product Management
Artificial Intelligence
Target Market
Communication
Supply Chain
Google Slides
Research Services
 One Pagers
All Categories
-
Home
- Customer Favorites
- Scoring Chart
Scoring Chart

Donut Pie Chart Finance Ppt PowerPoint Presentation Styles Summary
This is a donut pie chart finance ppt powerpoint presentation styles summary. This is a three stage process. The stages in this process are finance, marketing, management, investment, analysis.

Organizational Stakeholder Engagement And Management Comparative Analysis Chart Professional PDF
This slide exhibits stakeholder analysis comparative chart. It includes stakeholder name, position role, power, interest and support of stakeholders. Showcasing this set of slides titled Organizational Stakeholder Engagement And Management Comparative Analysis Chart Professional PDF. The topics addressed in these templates are Finance Manager, Operation Manager, Developer. All the content presented in this PPT design is completely editable. Download it and make adjustments in color, background, font etc. as per your unique business setting.
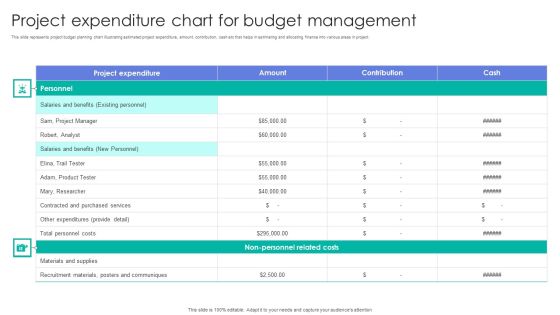
Project Expenditure Chart For Budget Management Graphics PDF
This slide represents project budget planning chart illustrating estimated project expenditure, amount, contribution, cash etc that helps in estimating and allocating finance into various areas in project. Showcasing this set of slides titled Project Expenditure Chart For Budget Management Graphics PDF. The topics addressed in these templates are Materials And Supplies, Recruitment Materials, Costs. All the content presented in this PPT design is completely editable. Download it and make adjustments in color, background, font etc. as per your unique business setting.
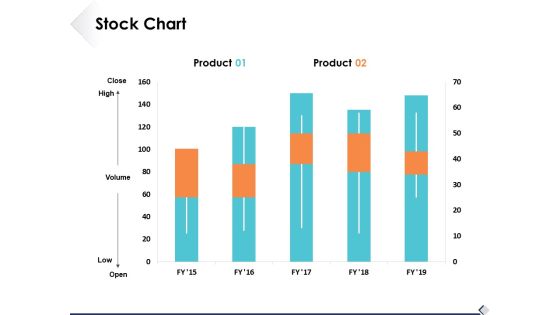
Stock Chart Finance Ppt PowerPoint Presentation Styles Background Image
This is a stock chart finance ppt powerpoint presentation styles background image. This is a two stage process. The stages in this process are analysis, marketing, icons, finance, strategy.

Aviation Services Management Gantt Chart One Pager Sample Example Document
Presenting you an exemplary Aviation Services Management Gantt Chart One Pager Sample Example Document Our one-pager comprises all the must have essentials of an inclusive document. You can edit it with ease, as its layout is completely editable. With such freedom, you can tweak its design and other elements to your requirements. Download this Aviation Services Management Gantt Chart One Pager Sample Example Document brilliant piece now.

Donut Pie Chart Ppt PowerPoint Presentation Ideas Design Templates
This is a donut pie chart ppt powerpoint presentation ideas design templates. This is a four stage process. The stages in this process are analysis finance, investment, business, planning, marketing.

Task Based Recognition Chart Ppt PowerPoint Presentation Inspiration Vector
This is a task based recognition chart ppt powerpoint presentation inspiration vector. This is a two stage process. The stages in this process are business, planning, strategy, detail, particular.
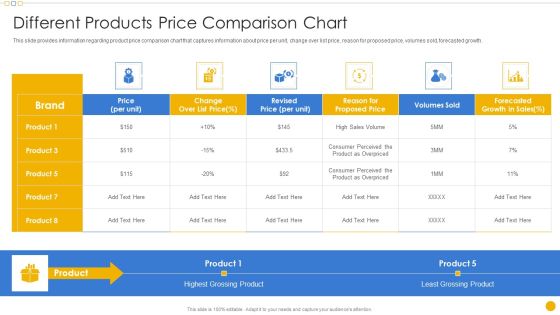
Sales Management Playbook Different Products Price Comparison Chart Professional PDF
This slide provides information regarding ideal customer profile that defines perfect customer fit to realize optimum value from product or solution rendered by identifying organizational concerns, pain points, value proposition, etc.Deliver and pitch your topic in the best possible manner with this Sales Management Playbook Different Products Price Comparison Chart Professional PDF Use them to share invaluable insights on Different Products Price Comparison Chart and impress your audience. This template can be altered and modified as per your expectations. So, grab it now.

Business And Strategy Display Results With Grass Bar Chart Images
Analyze Ailments On Our business and strategy display results with grass bar chart images Powerpoint Templates. Bring Out The Thinking Doctor In You. Dock Your Thoughts With Our Agriculture Powerpoint Templates. They Will Launch Them Into Orbit.

Pie Chart On Magnifying Glass For Business Analysis PowerPoint Template
Visually support your presentation with our above template showing pie chart on magnifying glass. This slide has been professionally designed to emphasize the concept of market research and analysis. Deliver amazing presentations to mesmerize your audience.

Team Target And Achievements Scatter Chart Ppt PowerPoint Presentation Example
This is a team target and achievements scatter chart ppt powerpoint presentation example. This is a three stage process. The stages in this process are overall territory performance, task done, estimation done, complexity done.

Competitive Analysis Template 6 Scatter Chart Ppt PowerPoint Presentation Shapes
This is a competitive analysis template 6 scatter chart ppt powerpoint presentation shapes. This is a one stage process. The stages in this process are users interface, data import, example, pricing, support update, tutorials, easy to use.

Competitive Analysis Template 8 Matrix Chart Ppt PowerPoint Presentation Templates
This is a competitive analysis template 8 matrix chart ppt powerpoint presentation templates. This is a six stage process. The stages in this process are our business, product quality, product fidelity, after sales service, customer service, price, shipping speed, competitor.

Competitive Analysis Matrix Chart Ppt PowerPoint Presentation Gallery
This is a competitive analysis matrix chart ppt powerpoint presentation gallery. This is a seven stage process. The stages in this process are our business, product quality, product fidelity, after sales service, customer service, price, shipping speed.
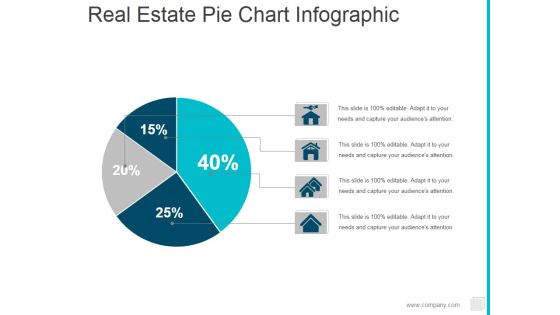
Real Estate Pie Chart Infographic Ppt PowerPoint Presentation Ideas Shapes
This is a real estate pie chart infographic ppt powerpoint presentation ideas shapes. This is a four stage process. The stages in this process are pie, finance, marketing, percentage.

Basic Gap Analysis Chart Ppt PowerPoint Presentation Pictures Design Ideas
This is a basic gap analysis chart ppt powerpoint presentation pictures design ideas. This is a five stage process. The stages in this process are business, finance, marketing, analysis, investment.
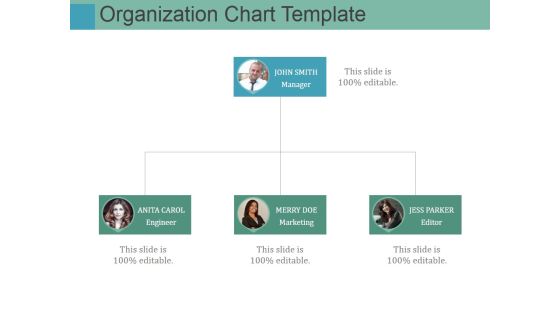
Organization Chart Template Ppt PowerPoint Presentation Infographic Template Styles
This is a organization chart template ppt powerpoint presentation infographic template styles. This is a four stage process. The stages in this process are john smith, anita carol, merry doe, jess parker.

Line Chart Ppt Powerpoint Presentation Infographic Template Format
This is a line chart ppt powerpoint presentation infographic template format. This is a two stage process. The stages in this process are jan, feb, mar, apr, may, financial.

Scatter Bubble Chart Ppt PowerPoint Presentation Professional Model
This is a scatter bubble chart ppt powerpoint presentation professional model. This is a six stage process. The stages in this process are sales in profit, financial year, growth, business, marketing, strategy.

Pie Chart Finance Ppt PowerPoint Presentation Styles Graphics Template
This is a pie chart finance ppt powerpoint presentation styles graphics template. This is a three stage process. The stages in this process are financial, minimum, medium, maximum, marketing.

Combo Chart Graph Ppt PowerPoint Presentation Gallery Designs Download
This is a combo chart graph ppt powerpoint presentation gallery designs download. This is a three stage process. The stages in this process are finance, marketing, analysis, investment, million.
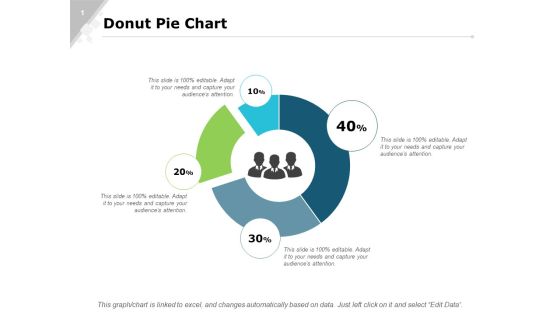
Donut Pie Chart Bar Ppt PowerPoint Presentation Infographics Slide Portrait
This is a donut pie chart bar ppt powerpoint presentation infographics slide portrait. This is a four stage process. The stages in this process are finance, marketing, analysis, investment, million.

Area Chart Graph Ppt PowerPoint Presentation Professional Format Ideas
This is a column chart graph ppt powerpoint presentation slides file formats. This is a stage three process. The stages in this process are finance, marketing, analysis, investment, million.

Competitive Analysis Bubble Chart Ppt PowerPoint Presentation Pictures Mockup
This is a competitive analysis bubble chart ppt powerpoint presentation pictures mockup. This is a six stage process. The stages in this process are product, table, business, marketing, management.

Product Marketing Department Team Organizational Chart Icon Professional PDF
Persuade your audience using this Product Marketing Department Team Organizational Chart Icon Professional PDF. This PPT design covers three stages, thus making it a great tool to use. It also caters to a variety of topics including Team Organizational Chart Icon, Product Marketing Department. Download this PPT design now to present a convincing pitch that not only emphasizes the topic but also showcases your presentation skills.

Confidence Chart Ppt PowerPoint Presentation Icon Background Cpb Pdf
Presenting this set of slides with name confidence chart ppt powerpoint presentation icon background cpb pdf. This is an editable Powerpoint five stages graphic that deals with topics like confidence chart to help convey your message better graphically. This product is a premium product available for immediate download and is 100 percent editable in Powerpoint. Download this now and use it in your presentations to impress your audience.
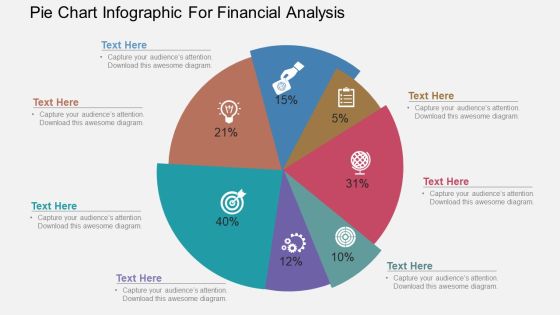
Pie Chart Infographic For Financial Analysis Powerpoint Template
Our above PowerPoint template has been designed with pie chart infographic. This slide is suitable to present financial analysis. Use this business diagram to present your work in a more smart and precise manner.

Business Team With Pie Chart For Comparison Powerpoint Template
This business slide contains graphics of pie chart with team members. This PowerPoint template is suitable to present comparison of teams performances. Use this business diagram to present your work in a more smart and precise manner.
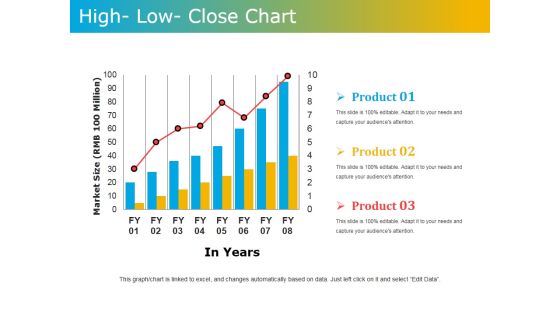
High Low Close Chart Ppt PowerPoint Presentation Model Graphics Tutorials
This is a high low close chart ppt powerpoint presentation model graphics tutorials. This is a three stage process. The stages in this process are market size, in years, product.

Successive Demonstration Using Hands Production Planning Flow Chart PowerPoint Templates
We present our successive demonstration using hands production planning flow chart PowerPoint templates. Use our Symbol PowerPoint Templates because; In any endeavor people matter most. Use our Business PowerPoint Templates because, Marketing Strategy Business Template:- Maximizing sales of your product is the intended destination. Use our Metaphor PowerPoint Templates because; educate your staff on the means to provide the required support for speedy recovery. Use our Abstract PowerPoint Templates because; Use our creative template to lay down your views. Use our Process and Flows PowerPoint Templates because, Our PowerPoint templates designed for your ideas to sell. Use these PowerPoint slides for presentations relating to Description using hands steps, Business, Collection, Connection, Cursor, Decoration, Design, Dimensional, Direction, Element, Icon, Illustration, Information, Modern, Motion, Paper, Perspective, Plastic, Pointer, Pointing, Process, Recycle, Recycling, Reflective, Set, Shape, Shiny, Sign, Symbol, Technology. The prominent colors used in the PowerPoint template are Blue, Gray, and Black
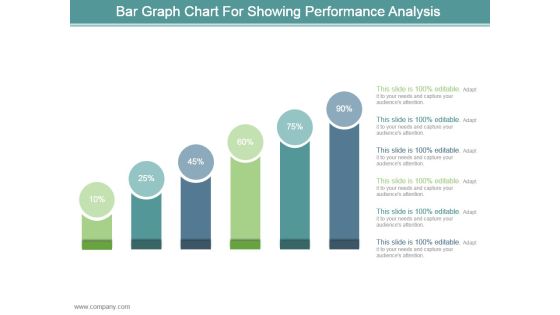
Bar Graph Chart For Showing Performance Analysis Ppt Design
This is a bar graph chart for showing performance analysis ppt design. This is a six stage process. The stages in this process are business, marketing, process, success, presentation.
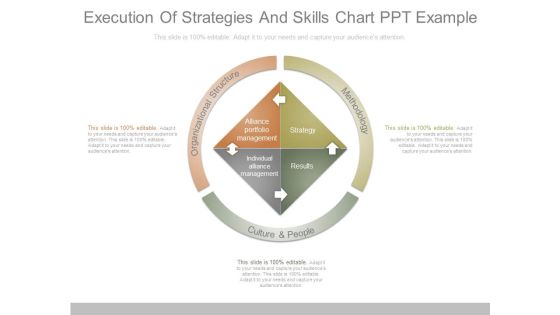
Execution Of Strategies And Skills Chart Ppt Example
This is a execution of strategies and skills chart ppt example. This is a three stage process. The stages in this process are methodology, culture and people, organizational structure, alliance portfolio management, strategy, individual alliance management, results.

Small Business Structure Chart Example Powerpoint Slide Background Image
This is a small business structure chart example powerpoint slide background image. This is a six stage process. The stages in this process are financial manager, sales, distributions, finance, operations, general manager.

Bar Chart Ppt PowerPoint Presentation Infographic Template Skills
This is a bar chart ppt powerpoint presentation infographic template skills. This is a nine stage process. The stages in this process are sales in percentage, finance, business, marketing, strategy, success.

Network Planning And Analysis Chart Powerpoint Slides Designs Download
This is a network planning and analysis chart powerpoint slides designs download. This is a six stage process. The stages in this process are equipment planning, proof of concept, project execution, configuration, installation, gap and root cause analysis.
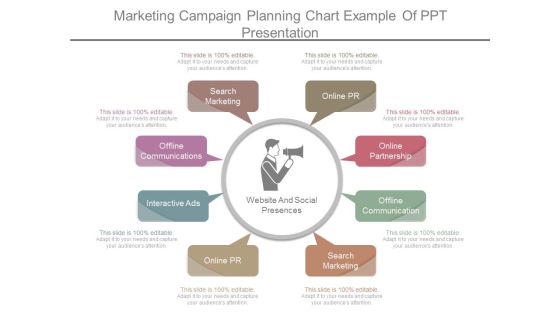
Marketing Campaign Planning Chart Example Of Ppt Presentation
This is a marketing campaign planning chart example of ppt presentation. This is a eight stage process. The stages in this process are search marketing, offline communications, interactive ads, online pr, online partnership, offline communication, search marketing.
Linear Diamond Chart With Icons For Financial Progress Powerpoint Template
This PowerPoint template has been designed with linear diamond chart with icons. This diagram helps to exhibit financial progress. Present your views using this innovative slide and be assured of leaving a lasting impression.

Interactive Organizational Chart Ppt PowerPoint Presentation Pictures Good Cpb
Presenting this set of slides with name interactive organizational chart ppt powerpoint presentation pictures good cpb. This is an editable Powerpoint seven stages graphic that deals with topics like interactive organizational chart to help convey your message better graphically. This product is a premium product available for immediate download and is 100 percent editable in Powerpoint. Download this now and use it in your presentations to impress your audience.
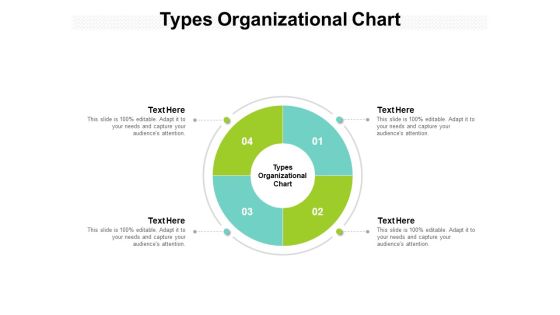
Types Organizational Chart Ppt PowerPoint Presentation Show Cpb
Presenting this set of slides with name types organizational chart ppt powerpoint presentation show cpb. This is an editable Powerpoint four stages graphic that deals with topics like types organizational chart to help convey your message better graphically. This product is a premium product available for immediate download and is 100 percent editable in Powerpoint. Download this now and use it in your presentations to impress your audience.

Instructional Design Organization Chart Ppt PowerPoint Presentation Infographics Guide Cpb
Presenting this set of slides with name instructional design organization chart ppt powerpoint presentation infographics guide cpb. This is an editable Powerpoint four stages graphic that deals with topics like instructional design organization chart to help convey your message better graphically. This product is a premium product available for immediate download and is 100 percent editable in Powerpoint. Download this now and use it in your presentations to impress your audience.

Construction Gantt Chart Ppt PowerPoint Presentation Show Vector Cpb
Presenting this set of slides with name construction gantt chart ppt powerpoint presentation show vector cpb. This is an editable Powerpoint four stages graphic that deals with topics like construction gantt chart to help convey your message better graphically. This product is a premium product available for immediate download and is 100 percent editable in Powerpoint. Download this now and use it in your presentations to impress your audience.

Burn Chart Scrum Ppt PowerPoint Presentation Sample Cpb Pdf
Presenting this set of slides with name burn chart scrum ppt powerpoint presentation sample cpb pdf. This is an editable Powerpoint four stages graphic that deals with topics like burn chart scrum to help convey your message better graphically. This product is a premium product available for immediate download and is 100 percent editable in Powerpoint. Download this now and use it in your presentations to impress your audience.

Burn Down Chart Ppt PowerPoint Presentation Slides Influencers Cpb Pdf
Presenting this set of slides with name burn down chart ppt powerpoint presentation slides influencers cpb pdf. This is an editable Powerpoint five stages graphic that deals with topics like burn down chart to help convey your message better graphically. This product is a premium product available for immediate download and is 100 percent editable in Powerpoint. Download this now and use it in your presentations to impress your audience.

Pie Chart Ppt PowerPoint Presentation Summary Background Image
This is a pie chart ppt powerpoint presentation summary background image. This is a five stage process. The stages in this process are business, marketing, product, finance, strategy, planning.

Successive Demonstration Using Hands Flow Chart Creator PowerPoint Templates
We present our successive demonstration using hands flow chart creator PowerPoint templates. Use our Symbol PowerPoint Templates because, are the tools that helped most of us evolve. Use our Business PowerPoint Templates because, Marketing Strategy Business Template:- Maximizing sales of your product is the intended destination. Use our Metaphor PowerPoint Templates because, Profit fairly earned is what you believe in. Use our Abstract PowerPoint Templates because, Forward thinking is the way to go. Use our Process and Flows PowerPoint Templates because, Original thinking is the need of the hour. Use these PowerPoint slides for presentations relating to Description using hands steps, Business, Collection, Connection, Cursor, Decoration, Design, Dimensional, Direction, Element, Icon, Illustration, Information, Modern, Motion, Paper, Perspective, Plastic, Pointer, Pointing, Process, Recycle, Recycling, Reflective, Set, Shape, Shiny, Sign, Symbol, Technology. The prominent colors used in the PowerPoint template are Green, Gray, and Black

Stacked Line Chart Finance Ppt Powerpoint Presentation Outline Themes
This is a stacked line chart finance ppt powerpoint presentation outline themes. This is a two stage process. The stages in this process are finance, marketing, management, investment, analysis.
Five Circles Sequential Chart With Icons Powerpoint Slides
This PowerPoint template contains sequential chart of five circles with icons. You may download this PPT slide to depict corporate vision, mission and strategy analysis. Add this slide to your presentation and impress your superiors.

Business Card Marketing Workflow Chart Ppt Portfolio Aids PDF
This slide showcases the flowchart of business card request for corporate marketing, this flowchart covers request for business card by requester to card approval. Deliver an awe-inspiring pitch with this creative business card marketing workflow chart ppt portfolio aids pdf bundle. Topics like business card marketing workflow chart can be discussed with this completely editable template. It is available for immediate download depending on the needs and requirements of the user.
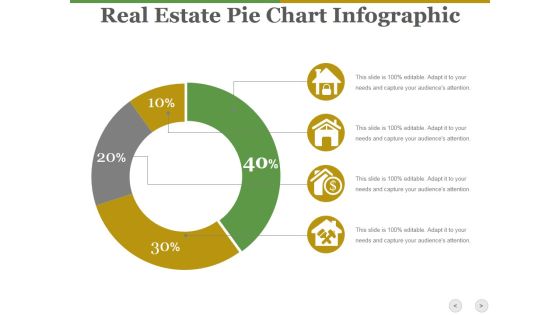
Real Estate Pie Chart Infographic Ppt PowerPoint Presentation Show Diagrams
This is a real estate pie chart infographic ppt powerpoint presentation show diagrams. This is a four stage process. The stages in this process are business, icons, marketing, strategy, process.
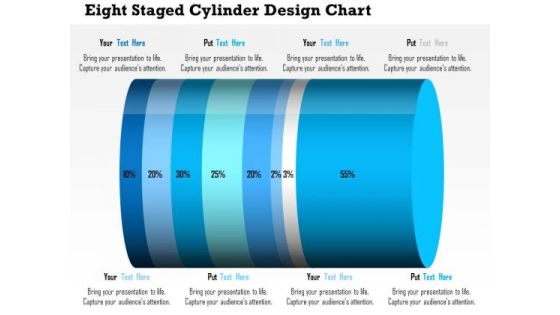
Business Daigram Eight Staged Cylinder Design Chart Presentation Templets
This business diagram contains eight staged cylinder design chart with percentage ratio. Download this diagram to display financial analysis. Use this diagram to make business and marketing related presentations.

Business Information Application Protection Testing Flow Chart Themes PDF
This slide covers business application security testing flow chart which includes secure application model, security standard recognition and privacy testing.Pitch your topic with ease and precision using this Business Information Application Protection Testing Flow Chart Themes PDF. This layout presents information on Security Consistency, Target Weighting, Target Recognition. It is also available for immediate download and adjustment. So, changes can be made in the color, design, graphics or any other component to create a unique layout.

Public Relations Promotion Tools Chart Presentation Background Images
This is a public relations promotion tools chart presentation background images. This is a six stage process. The stages in this process are awareness, knowledge, preference, conviction, purchase, liking.
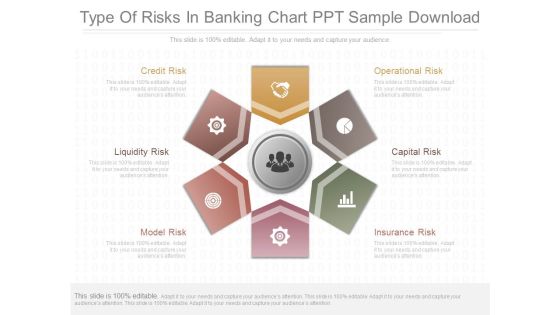
Type Of Risks In Banking Chart Ppt Sample Download
This is a type of risks in banking chart ppt sample download. This is a six stage process. The stages in this process are credit risk, liquidity risk, model risk, operational risk, capital risk, insurance risk.
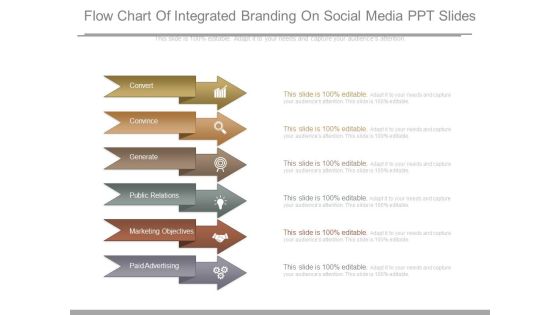
Flow Chart Of Integrated Branding On Social Media Ppt Slides
This is a flow chart of integrated branding on social media ppt slides. This is a six stage process. The stages in this process are convert, convince, generate, public relations, marketing objectives, paid advertising.
It Solution Example Chart Sample Of Ppt Presentation
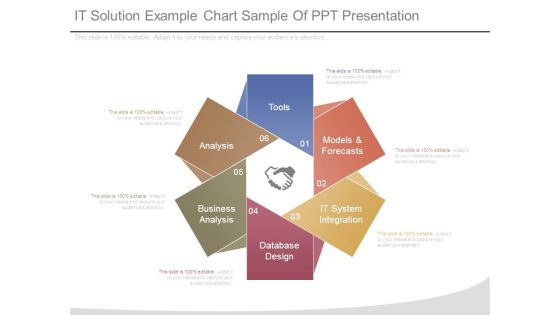
This is a it solution example chart sample of ppt presentation. This is a six stage process. The stages in this process are tools, models and forecasts, it system integration, database design, business analysis, analysis.

Activity Planning Chart Ppt PowerPoint Presentation Visual Aids Model
This is a activity planning chart ppt powerpoint presentation visual aids model. This is a six stage process. The stages in this process are activities, business, management, table, planning.

Cost Benefit Analysis Chart With Icons Powerpoint Layout
This is a cost benefit analysis chart with icons powerpoint layout. This is a two stage process. The stages in this process are balance scale, compare, business, marketing, management.

Combo Chart Marketing Analysis Ppt Powerpoint Presentation Pictures Icons
This is a combo chart marketing analysis ppt powerpoint presentation pictures icons. This is a three stage process. The stages in this process are finance, marketing, management, investment, analysis.

Clustered Bar Chart Finance Ppt Powerpoint Presentation Icon Graphics Template
This is a clustered bar chart finance ppt powerpoint presentation icon graphics template. This is a four stage process. The stages in this process are finance, marketing, management, investment, analysis.

Departments And Team Hierarchy Chart Ppt PowerPoint Presentation Styles
This is a departments and team hierarchy chart ppt powerpoint presentation styles. This is a three stage process. The stages in this process are director, financial advisor, marketing head, manager, web designer, graphic designer.
