Scoring Chart

Action Item Tracker Chart Good Example Of Ppt
This is a action item tracker chart good example of ppt. This is a three stage process. The stages in this process are business, marketing, icons, strategy.

Quarterly Sales Review Rainbow Chart Ppt Slide Templates
This is a quarterly sales review rainbow chart ppt slide templates. This is a four stage process. The stages in this process are year, arrow, icons, strategy, business.
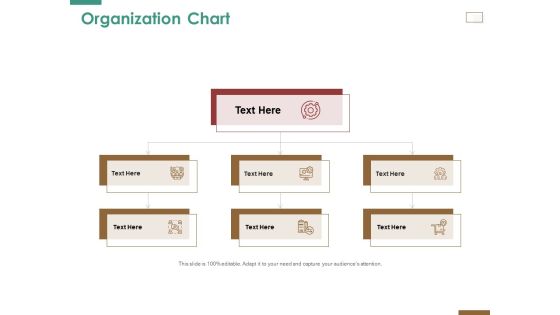
Successful Strategy Implementation Process Organization Organization Chart Microsoft PDF
Presenting this set of slides with name successful strategy implementation process organization organization chart microsoft pdf. This is a three stage process. The stages in this process are organization chart. This is a completely editable PowerPoint presentation and is available for immediate download. Download now and impress your audience.

Stock Photo 3d Image Of Pie Chart Ppt Template
Document The Process On Our Stock Photo 3d Image Of Pie Chart PPT template Powerpoint Templates. Make A Record Of Every Detail.

Area Chart Ppt PowerPoint Presentation Infographic Template Portrait
This is a area chart ppt powerpoint presentation infographic template portrait. This is a two stage process. The stages in this process are business, marketing, strategy, planning, finance.
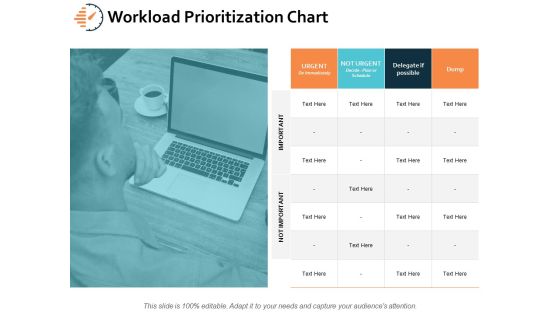
Workload Prioritization Chart Ppt PowerPoint Presentation Styles Designs
This is a workload prioritization chart ppt powerpoint presentation styles designs. This is a four stage process. The stages in this process are technology, business, planning, marketing, knowledge.

Enhancing Organic Reach Social Media Team Organizational Chart Demonstration PDF
The following slide showcases social media team hierarchal structure. It provides information about chief marketing officer CMO, social media manager, community manager, content creator, social media analyst, campaign manager, subject matter expert, etc. Retrieve professionally designed Enhancing Organic Reach Social Media Team Organizational Chart Demonstration PDF to effectively convey your message and captivate your listeners. Save time by selecting pre-made slideshows that are appropriate for various topics, from business to educational purposes. These themes come in many different styles, from creative to corporate, and all of them are easily adjustable and can be edited quickly. Access them as PowerPoint templates or as Google Slides themes. You dont have to go on a hunt for the perfect presentation because Slidegeeks got you covered from everywhere.
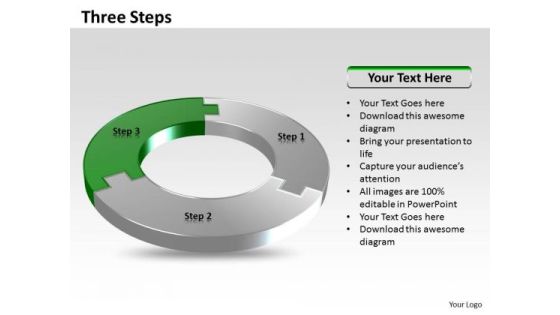
Ppt Three Step Process Editable Business Plan PowerPoint Chart Templates
PPT three step process editable business plan powerpoint chart Templates-Use this Appealing 3D PowerPoint Diagram to explain three step in Circular Process. This Diagram symbolizes Business, Victory, Happiness, laughter, lightheartedness, merriment, mirth, optimism, paradise, peace of mind. This is an animated Diagram.-PPT three step process editable business plan powerpoint chart Templates

Optimizing Social Networks Social Media Team Organizational Chart Brochure PDF
The following slide showcases social media team hierarchal structure. It provides information about chief marketing officer CMO, social media manager, community manager, content creator, social media analyst, campaign manager, subject matter expert, etc. Slidegeeks has constructed Optimizing Social Networks Social Media Team Organizational Chart Brochure PDF after conducting extensive research and examination. These presentation templates are constantly being generated and modified based on user preferences and critiques from editors. Here, you will find the most attractive templates for a range of purposes while taking into account ratings and remarks from users regarding the content. This is an excellent jumping-off point to explore our content and will give new users an insight into our top-notch PowerPoint Templates.

Selection Of The Optimal Portfolio Chart Ppt Slides
This is a selection of the optimal portfolio chart ppt slides. This is a five stage process. The stages in this process are business, finance, marketing.

Awareness And Lead Generation Funnel Chart Powerpoint Slide
This is a awareness and lead generation funnel chart powerpoint slide. This is a three stage process. The stages in this process are awareness, lead generation, education.

Budget Calculator Chart Layout Powerpoint Slides Designs Download
This is a budget calculator chart layout powerpoint slides designs download. This is a three stage process. The stages in this process are budget tracking, report, adjust.

Return On Investment Triangle Chart Ppt Slides Download
This is a return on investment triangle chart ppt slides download. This is a three stage process. The stages in this process are cost, roi, time.
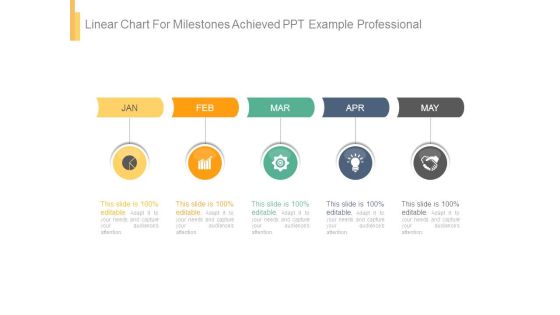
Linear Chart For Milestones Achieved Ppt Example Professional
This is a linear chart for milestones achieved ppt example professional. This is a five stage process. The stages in this process are jan, feb, mar, apr, may.
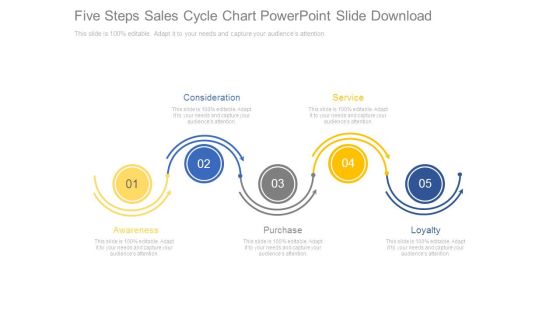
Five Steps Sales Cycle Chart Powerpoint Slide Download
This is a five steps sales cycle chart powerpoint slide download. This is a five stage process. The stages in this process are consideration, service, loyalty, purchase, awareness.

Five Steps Voc Concept Chart Powerpoint Slide Designs
This is a five steps voc concept chart powerpoint slide designs. This is a five stage process. The stages in this process are analysis, marketing, presentation, strategy.
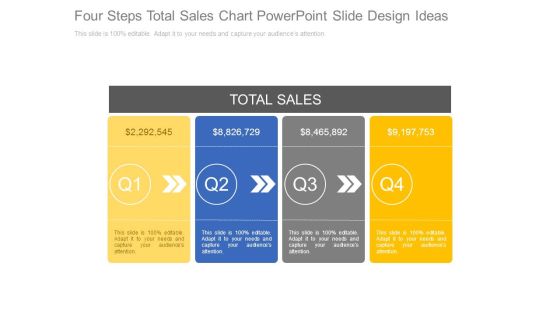
Four Steps Total Sales Chart Powerpoint Slide Design Ideas
This is a four steps total sales chart powerpoint slide design ideas. This is a four stage process. The stages in this process are total sales, marketing.

Personal Characteristics Flow Chart Powerpoint Slide Background Picture
This is a personal characteristics flow chart powerpoint slide background picture. This is a three stage process. The stages in this process are attitude, personal characteristics, loyalty.
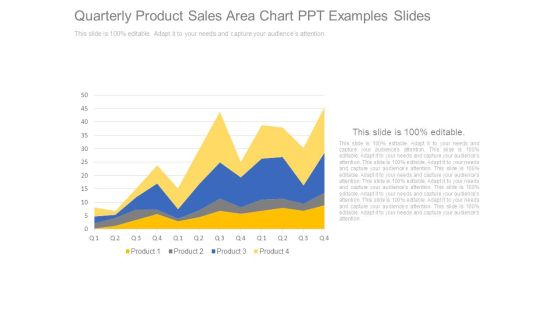
Quarterly Product Sales Area Chart Ppt Examples Slides
This is a quarterly product sales area chart ppt examples slides. This is a four stage process. The stages in this process are product, business, marketing, success, sales.

Puzzle Chart With Possible Solutions Ppt Background Template
This is a puzzle chart with possible solutions ppt background template. This is a four stage process. The stages in this process are puzzles, problem, solution, business, marketing.
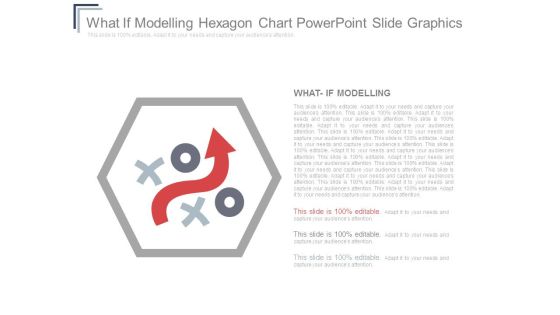
What If Modelling Hexagon Chart Powerpoint Slide Graphics
This is a what if modelling hexagon chart powerpoint slide graphics. This is a three stage process. The stages in this process are what if modelling.

Dollar Stacks Chart For Performance Attribution Powerpoint Slide Designs
This is a dollar stacks chart for performance attribution powerpoint slide designs. This is a four stage process. The stages in this process are step.

Vision And Mission Triangle Chart Ppt Background Graphics
This is a vision and mission triangle chart ppt background graphics. This is a three stage process. The stages in this process are mission, value, vision.

Vision Mission Goal Infographic Chart Ppt Slide Show
This is a vision mission goal infographic chart ppt slide show. This is a three stage process. The stages in this process are vision, mission, goal.
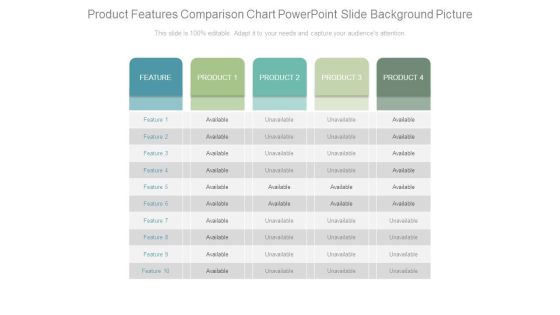
Product Features Comparison Chart Powerpoint Slide Background Picture
This is a product features comparison chart powerpoint slide background picture. This is a four stage process. The stages in this process are feature, product, available, unavailable.
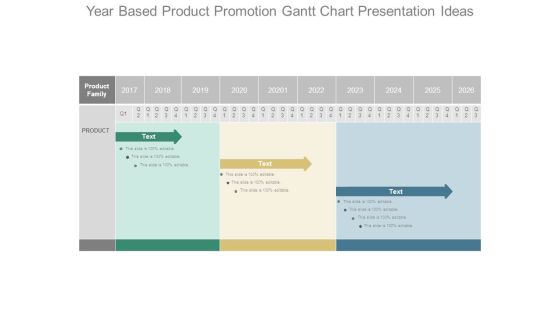
Year Based Product Promotion Gantt Chart Presentation Ideas
This is a year based product promotion gantt chart presentation ideas. This is a three stage process. The stages in this process are product family, product.

Competitive Environment Change Analysis Chart Ppt Slide Template
This is a competitive environment change analysis chart ppt slide template. This is a four stage process. The stages in this process are competitive landscape, brand.

Changes In Competitive Environment Landscape Chart Powerpoint Layout
This is a changes in competitive environment landscape chart powerpoint layout. This is a four stage process. The stages in this process are competitive landscape, brand.

Overall Revenue Analysis Bar Chart Powerpoint Slide Information
This is a overall revenue analysis bar chart powerpoint slide information. This is a nine stage process. The stages in this process are finance, success, business, marketing, percentage.
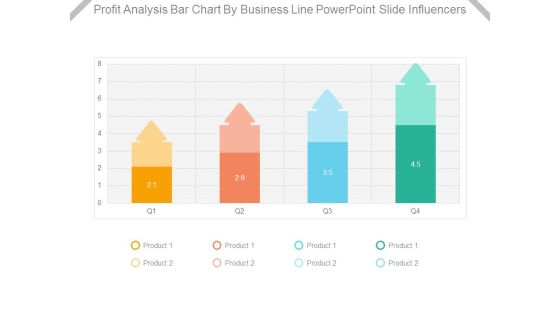
Profit Analysis Bar Chart By Business Line Powerpoint Slide Influencers
This is a profit analysis bar chart by business line powerpoint slide influencers. This is a four stage process. The stages in this process are product.
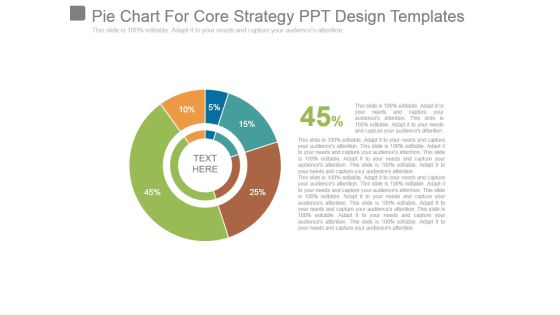
Pie Chart For Core Strategy Ppt Design Templates
This is a pie chart for core strategy ppt design templates. This is a five stage process. The stages in this process are business, marketing, strategy, finance, percentage.

Pie Chart For Result Analysis Ppt Example File
This is a pie chart for result analysis ppt example file. This is a seven stage process. The stages in this process are pie, marketing, strategy, finance, percentage.
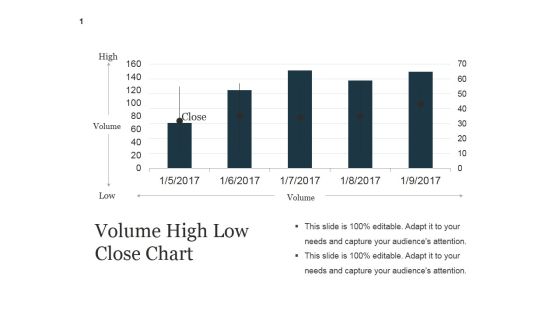
Volume High Low Close Chart Ppt PowerPoint Presentation Guide
This is a volume high low close chart ppt powerpoint presentation guide. This is a five stage process. The stages in this process are high, volume, close, low.

combo chart template 1 ppt powerpoint presentation show
This is a combo chart template 1 ppt powerpoint presentation show. This is a four stage process. The stages in this process are business, marketing, finance, analysis, growth.

Combo Chart Template 2 Ppt PowerPoint Presentation Guidelines
This is a combo chart template 2 ppt powerpoint presentation guidelines. This is a four stage process. The stages in this process are business, marketing, growth, product, timeline.
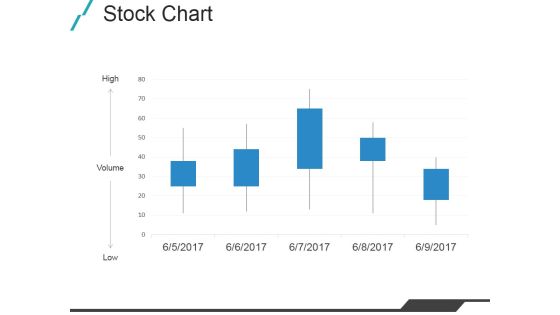
Stock Chart Ppt PowerPoint Presentation Outline Slide Portrait
This is a stock chart ppt powerpoint presentation outline slide portrait. This is a five stage process. The stages in this process are high, volume, low, business.

Radar Chart Ppt PowerPoint Presentation Infographic Template Design Templates
This is a radar chart ppt powerpoint presentation infographic template design templates. This is a seven stage process. The stages in this process are business, shapes, product, marketing.

Stock Chart Ppt PowerPoint Presentation Infographic Template Clipart Images
This is a stock chart ppt powerpoint presentation infographic template clipart images. This is a five stage process. The stages in this process are high, volume, low, close.

Hierarchy Chart Ppt PowerPoint Presentation Model Graphics Pictures
This is a hierarchy chart ppt powerpoint presentation model graphics pictures. This is a four stage process. The stages in this process are ceo, accountant, sales, developer, designer.

Scatter Chart Ppt PowerPoint Presentation Portfolio Design Inspiration
This is a scatter chart ppt powerpoint presentation portfolio design inspiration. This is a twelve stage process. The stages in this process are graph, growth, success, business.

Line Chart Ppt PowerPoint Presentation Infographic Template Shapes
This is a line chart ppt powerpoint presentation infographic template shapes. This is a seven stage process. The stages in this process are business, strategy, analysis, marketing, growth.

Column Chart Ppt PowerPoint Presentation Inspiration Example Topics
This is a column chart ppt powerpoint presentation inspiration example topics. This is a twelve stage process. The stages in this process are dollar, growth, business, marketing, success.

Column Chart Ppt PowerPoint Presentation Portfolio Graphics Template
This is a column chart ppt powerpoint presentation portfolio graphics template. This is a six stage process. The stages in this process are product, finance, growth, success, business.

Combo Chart Ppt PowerPoint Presentation Professional Graphics Example
This is a combo chart ppt powerpoint presentation professional graphics example. This is a eight stage process. The stages in this process are product, finance, growth, success, business.
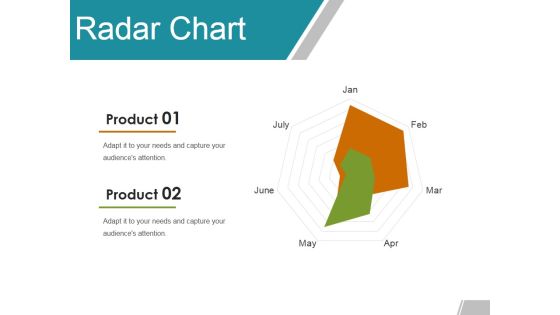
Radar Chart Ppt PowerPoint Presentation Gallery Example Topics
This is a radar chart ppt powerpoint presentation gallery example topics. This is a seven stage process. The stages in this process are product, business, marketing, shapes.

Stock Chart Ppt PowerPoint Presentation Summary Graphics Pictures
This is a stock chart ppt powerpoint presentation summary graphics pictures. This is a five stage process. The stages in this process are high, volume, low, close, finance.

Bar Chart Ppt PowerPoint Presentation Infographic Template Example
This is a bar chart ppt powerpoint presentation infographic template example. This is a seven stage process. The stages in this process are business, finance, marketing, percentage.

Daunt Pie Chart Ppt PowerPoint Presentation Layouts Portrait
This is a daunt pie chart ppt powerpoint presentation layouts portrait. This is a three stage process. The stages in this process are percentage, finance, donut, business.

Donut Pie Chart Ppt PowerPoint Presentation Professional Templates
This is a donut pie chart ppt powerpoint presentation professional templates. This is a three stage process. The stages in this process are finance, donut, business, marketing, strategy.
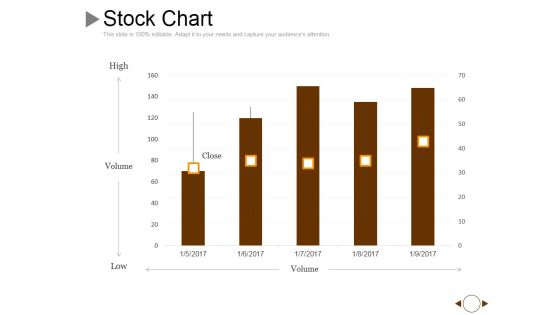
Stock Chart Ppt PowerPoint Presentation Gallery Graphics Example
This is a stock chart ppt powerpoint presentation gallery graphics example. This is a five stage process. The stages in this process are volume, high, low, close.

Radar Chart Ppt PowerPoint Presentation Infographic Template Graphics Template
This is a radar chart ppt powerpoint presentation infographic template graphics template. This is a six stage process. The stages in this process are product, business, marketing, shapes.

Area Chart Ppt PowerPoint Presentation Gallery Clipart Images
This is a area chart ppt powerpoint presentation gallery clipart images. This is a two stage process. The stages in this process are product, profit, business, finance, marketing.

Donut Pie Chart Ppt PowerPoint Presentation Outline Graphics Example
This is a donut pie chart ppt powerpoint presentation outline graphics example. This is a five stage process. The stages in this process are percentage, finance, donut, business.

Line Chart Ppt PowerPoint Presentation Visual Aids Inspiration
This is a line chart ppt powerpoint presentation visual aids inspiration. This is a two stage process. The stages in this process are product, profit, growth, decline, success.
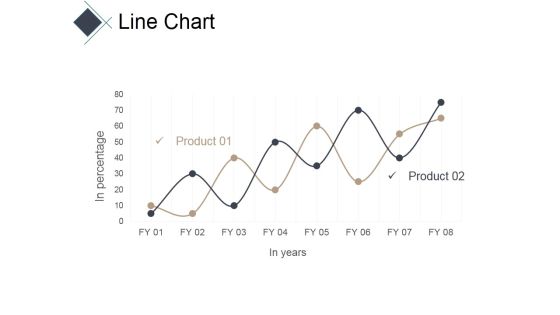
Line Chart Ppt PowerPoint Presentation Styles Graphics Example
This is a line chart ppt powerpoint presentation styles graphics example. This is a two stage process. The stages in this process are graph, business, success, marketing, line.

Pie Chart Ppt PowerPoint Presentation Slides Graphics Download
This is a pie chart ppt powerpoint presentation slides graphics download. This is a four stage process. The stages in this process are business, marketing, pie, finance, analysis.

Column Chart Ppt PowerPoint Presentation Inspiration Design Ideas
This is a column chart ppt powerpoint presentation inspiration design ideas. This is a nine stage process. The stages in this process are product, growth, success, graph, business.
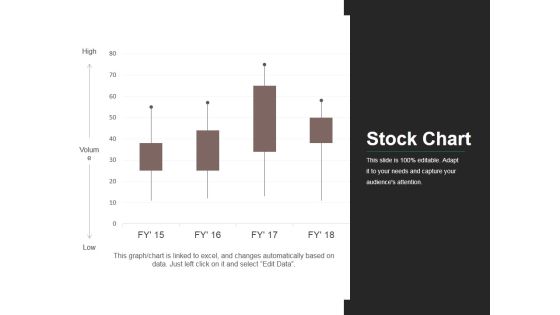
Stock Chart Ppt PowerPoint Presentation Infographic Template Elements
This is a stock chart ppt powerpoint presentation infographic template elements. This is a four stage process. The stages in this process are business, market, stock, finance, analysis.

Doughnut Chart Ppt PowerPoint Presentation Visual Aids Files
This is a doughnut chart ppt powerpoint presentation visual aids files. This is a three stage process. The stages in this process are finance, donut, percentage, business, marketing.

High Low Close Chart Ppt PowerPoint Presentation Infographics Templates
This is a high low close chart ppt powerpoint presentation infographics templates. This is a nine stage process. The stages in this process are high, volume, low, close.

 Home
Home