Scoring Chart

Corporate Loan Operations Dashboard For Banks Introduction PDF
This slide displays the dashboard for corporate loan operations management. It include KPIs such as open cases with service level agreements, average open cases by agents, open cases by age, proposed exposure by risk rating, etc. Pitch your topic with ease and precision using this Corporate Loan Operations Dashboard For Banks Introduction PDF. This layout presents information on Proposed Exposure By Risk Rating, Open Cases By Age, Application Pipeline. It is also available for immediate download and adjustment. So, changes can be made in the color, design, graphics or any other component to create a unique layout.
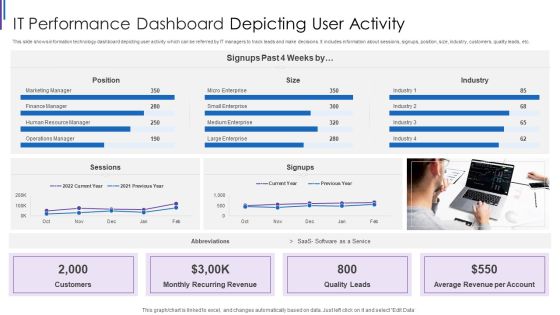
IT Performance Dashboard Depicting User Activity Inspiration PDF
This slide shows information technology dashboard depicting user activity which can be referred by IT managers to track leads and make decisions. It includes information about sessions, signups, position, size, industry, customers, quality leads, etc. Pitch your topic with ease and precision using this IT Performance Dashboard Depicting User Activity Inspiration PDF. This layout presents information on Monthly Recurring Revenue, Average Revenue Per, Account Quality Leads, Customers Position Sessions. It is also available for immediate download and adjustment. So, changes can be made in the color, design, graphics or any other component to create a unique layout.
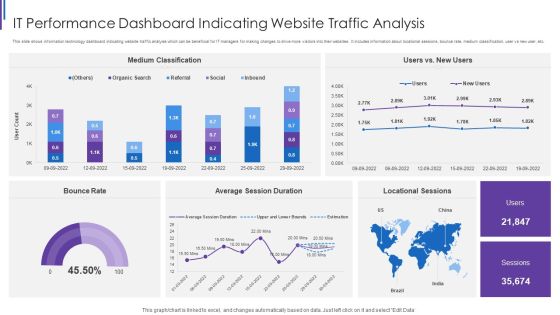
IT Performance Dashboard Indicating Website Traffic Analysis Background PDF
This slide shows information technology dashboard indicating website traffic analysis which can be beneficial for IT managers for making changes to drive more visitors into their websites. It includes information about locational sessions, bounce rate, medium classification, user vs new user, etc. Pitch your topic with ease and precision using this IT Performance Dashboard Indicating Website Traffic Analysis Background PDF. This layout presents information on Medium Classification Rate, Average Session Duration, Locational Sessions Bounce. It is also available for immediate download and adjustment. So, changes can be made in the color, design, graphics or any other component to create a unique layout.

Skill Evaluation Dashboard With Turnover Rate Ideas PDF
Mentioned slide delineates talent assessment dashboard which will assist companies to frame efficient recruitment strategy. This dashboard provides detail information about hiring stats, talent turnover rate, talent rating, fired talents etc.Pitch your topic with ease and precision using this Skill Evaluation Dashboard With Turnover Rate Ideas PDF This layout presents information on Talent Management, Talent Satisfaction, Talent Rating It is also available for immediate download and adjustment. So, changes can be made in the color, design, graphics or any other component to create a unique layout.

Case Administration Dashboard With Resolved Cases Graphics PDF
This slide shows dashboard which can be used to monitor the status of case management solved in the organizations. It includes key performance indicators such as active cases by priority, by subject, by age, by branch, etc. Pitch your topic with ease and precision using this Case Administration Dashboard With Resolved Cases Graphics PDF. This layout presents information on Case Administration Dashboard, Resolved Cases. It is also available for immediate download and adjustment. So, changes can be made in the color, design, graphics or any other component to create a unique layout.

Personnel Engagement Measurement Effective Approaches With Statistics Structure PDF
This slide depicts different approaches to measure engagement in employees. It includes engagement surveys, exit interviews, one on ones with managers, performance ratings, first year employees retention rate, retention rate for experience employees, customer satisfaction rates and employee productivity. Pitch your topic with ease and precision using this Personnel Engagement Measurement Effective Approaches With Statistics Structure PDF. This layout presents information on Employees Increases, Person Discussion, Employee Morale. It is also available for immediate download and adjustment. So, changes can be made in the color, design, graphics or any other component to create a unique layout.
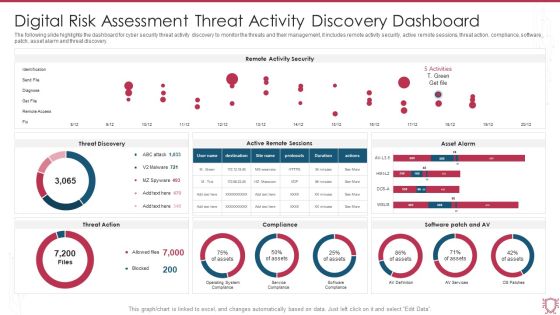
Digital Risk Assessment Threat Activity Discovery Dashboard Ppt Ideas Skills PDF
The following slide highlights the dashboard for cyber security threat activity discovery to monitor the threats and their management, it includes remote activity security, active remote sessions, threat action, compliance, software patch, asset alarm and threat discovery. Pitch your topic with ease and precision using this Digital Risk Assessment Threat Activity Discovery Dashboard Ppt Ideas Skills PDF. This layout presents information on Remote Activity Security, Threat Discovery, Asset Alarm. It is also available for immediate download and adjustment. So, changes can be made in the color, design, graphics or any other component to create a unique layout.
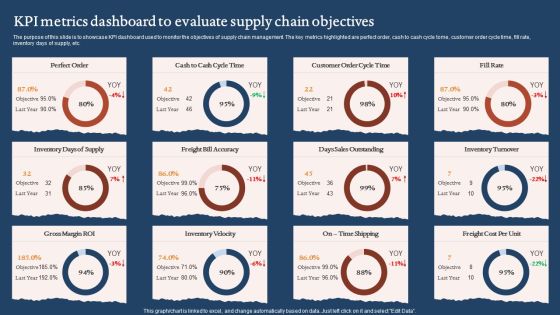
KPI Metrics Dashboard To Evaluate Supply Chain Objectives Graphics PDF
The purpose of this slide is to showcase KPI dashboard used to monitor the objectives of supply chain management. The key metrics highlighted are perfect order, cash to cash cycle tome, customer order cycle time, fill rate, inventory days of supply, etc. Pitch your topic with ease and precision using this KPI Metrics Dashboard To Evaluate Supply Chain Objectives Graphics PDF. This layout presents information on Days Sales Outstanding, Inventory Velocity, Gross Margin Roi. It is also available for immediate download and adjustment. So, changes can be made in the color, design, graphics or any other component to create a unique layout.
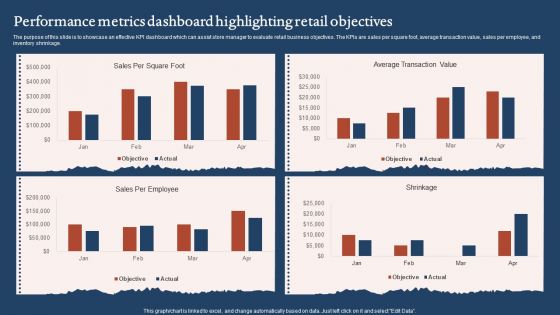
Performance Metrics Dashboard Highlighting Retail Objectives Sample PDF
The purpose of this slide is to showcase an effective KPI dashboard which can assist store manager to evaluate retail business objectives. The KPIs are sales per square foot, average transaction value, sales per employee, and inventory shrinkage. Pitch your topic with ease and precision using this Performance Metrics Dashboard Highlighting Retail Objectives Sample PDF. This layout presents information on Average Transaction Value, Sales Per Employee. It is also available for immediate download and adjustment. So, changes can be made in the color, design, graphics or any other component to create a unique layout.

Manpower Data Analytics Strategy For Stakeholders For Decision Making Summary PDF
This slide depicts application of workforce analytics strategy among different stakeholders. It includes human resource executives, staff, senior executive and managers for taking effective decisions. Pitch your topic with ease and precision using this Manpower Data Analytics Strategy For Stakeholders For Decision Making Summary PDF. This layout presents information on Organizations, Analytics Capabilities, Generate Better Quality. It is also available for immediate download and adjustment. So, changes can be made in the color, design, graphics or any other component to create a unique layout.

Quantitative Market Research Survey Results Structure PDF
This slide showcases market survey conducted and data gathered by various people to know the topics that drive better customer engagement. It also covers the location of the users. Pitch your topic with ease and precision using this Quantitative Market Research Survey Results Structure PDF. This layout presents information on Marketing Manager, Customer Support, Data Analyst. It is also available for immediate download and adjustment. So, changes can be made in the color, design, graphics or any other component to create a unique layout.

Dashboard Showing Project Portfolio Metrics Microsoft PDF
This slide shows the dashboard that depicts the project portfolio management which covers the quarterly project delivery roadmap and health card with project funding, resource allocation, portfolio risks such as open change requests, open risks and issues, etc. Pitch your topic with ease and precision using this Dashboard Showing Project Portfolio Metrics Microsoft PDF. This layout presents information on Resource Allocation, Portfolio Risks, Project Funding. It is also available for immediate download and adjustment. So, changes can be made in the color, design, graphics or any other component to create a unique layout.

IT Operations Dashboard For Project Metrics Portrait PDF
This slide focuses on dashboard that provides information about the information technology operations for managing IT project which covers the investments, billed amount, time taken to complete the project, customer satisfaction, monthly expenses, service level agreement status, etc. Pitch your topic with ease and precision using this IT Operations Dashboard For Project Metrics Portrait PDF. This layout presents information on Revenues, Investments, Monthly Expenses. It is also available for immediate download and adjustment. So, changes can be made in the color, design, graphics or any other component to create a unique layout.
Project Metrics Dashboard Depicting Tracking System Inspiration PDF
This slide focuses on project management dashboard which covers the four spirit teams, iteration defects by priority with quarterly roadmap with legends such as high attention, low, none, normal and resolved immediately with time in iteration, etc. Pitch your topic with ease and precision using this Project Metrics Dashboard Depicting Tracking System Inspiration PDF. This layout presents information on Project Metrics, Dashboard Depicting, Tracking System. It is also available for immediate download and adjustment. So, changes can be made in the color, design, graphics or any other component to create a unique layout.

Project Metrics Dashboard With Active Issues Topics PDF
This slide focuses on the project management dashboard which shows the number of active emergency risks and issues, projects, current user count, splitting of project status by priority level, capacity percentage, top recent assignees with open, resolved and closed projects. Pitch your topic with ease and precision using this Project Metrics Dashboard With Active Issues Topics PDF. This layout presents information on Project Metrics, Dashboard With Active Issues. It is also available for immediate download and adjustment. So, changes can be made in the color, design, graphics or any other component to create a unique layout.

Project Metrics Dashboard With Team Requests Background PDF
This slide focuses on the project management dashboard which shows the creation of monthly number of requests, requests made by departmental teams, average completion time in days with the number of requests created on week days, etc. Pitch your topic with ease and precision using this Project Metrics Dashboard With Team Requests Background PDF. This layout presents information on Project Metrics Dashboard, Team Requests. It is also available for immediate download and adjustment. So, changes can be made in the color, design, graphics or any other component to create a unique layout.
Weekly Customer Grievance Tracking Dashboard Designs PDF
This slide showcases dashboard that can help organization to identify the open and overdue status of customer grievance . It can guide managers to resolve the complaints and issues within stipulated time for customer satisfaction. Pitch your topic with ease and precision using this Weekly Customer Grievance Tracking Dashboard Designs PDF. This layout presents information on Average, Traffic Analysis, Customer Satisfaction Ratings. It is also available for immediate download and adjustment. So, changes can be made in the color, design, graphics or any other component to create a unique layout.
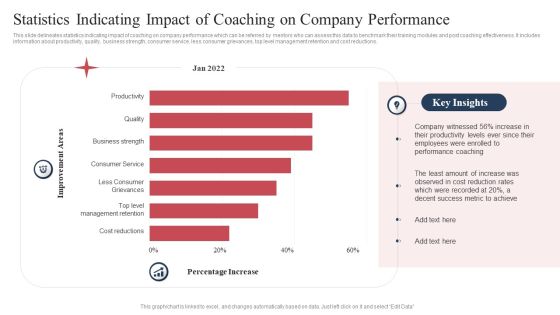
Statistics Indicating Impact Of Coaching On Company Performance Formats PDF
This slide delineates statistics indicating impact of coaching on company performance which can be referred by mentors who can assess this data to benchmark their training modules and post coaching effectiveness. It includes information about productivity, quality, business strength, consumer service, less consumer grievances, top level management retention and cost reductions. Pitch your topic with ease and precision using this Statistics Indicating Impact Of Coaching On Company Performance Formats PDF. This layout presents information on Productivity, Quality, Business Strength. It is also available for immediate download and adjustment. So, changes can be made in the color, design, graphics or any other component to create a unique layout.

Major Challenges In Implementing IT System Migration Project Ppt PowerPoint Presentation Outline Graphics PDF
The following slide highlights the key challenges faced in implementing it system migration. It includes obstacles such as system knowledge, software configuration, budget and technological constraints etc.Pitch your topic with ease and precision using this Major Challenges In Implementing IT System Migration Project Ppt PowerPoint Presentation Outline Graphics PDF. This layout presents information on Insufficient Understanding, System Features, Project Management. It is also available for immediate download and adjustment. So, changes can be made in the color, design, graphics or any other component to create a unique layout.
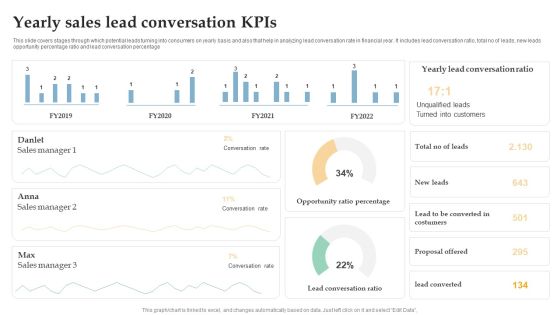
Yearly Sales Lead Conversation Kpis Ppt Inspiration Brochure PDF
This slide covers stages through which potential leads turning into consumers on yearly basis and also that help in analyzing lead conversation rate in financial year. It includes lead conversation ratio, total no of leads, new leads opportunity percentage ratio and lead conversation percentage. Pitch your topic with ease and precision using this Yearly Sales Lead Conversation Kpis Ppt Inspiration Brochure PDF. This layout presents information on Sales Manager, Conversation Rate, Opportunity Ratio Percentage. It is also available for immediate download and adjustment. So, changes can be made in the color, design, graphics or any other component to create a unique layout.

Challenges In Administration Of Customer Service Requests For IT Agents Mockup PDF
This slide depict barriers faced by agents in handling customer requests. It includes challenges such as dealing with upset customers, limited time, real time follow ups, customer questions prioritization, lack of authority, reporting to management, lack of tools, etc. Pitch your topic with ease and precision using this Challenges In Administration Of Customer Service Requests For IT Agents Mockup PDF. This layout presents information on Increase Waiting Time, Approval For Unnecessary, Dealing Unhappy Customers. It is also available for immediate download and adjustment. So, changes can be made in the color, design, graphics or any other component to create a unique layout.

Business Operational Expenditure Dashboard Indicating Revenue And Costs Metrics Pictures PDF
This slide shows operating expenses OPEX dashboard indicating revenue and costs metrics which can be referred by companies to manage various operating expenses of various departments. It contains information about cost center, revenue per company, company code, etc. Pitch your topic with ease and precision using this Business Operational Expenditure Dashboard Indicating Revenue And Costs Metrics Pictures PDF. This layout presents information on Business Operational, Costs Metrics, Revenue. It is also available for immediate download and adjustment. So, changes can be made in the color, design, graphics or any other component to create a unique layout.

Business Threats Landscape Dashboard With Cyber Attacks Analysis Ppt Summary Brochure PDF
This slide illustrates risk landscape dashboard with cyber attacks analysis which contains malware attack frequency, country wise attacks, top 10 attacks, etc. It can assist IT managers in analyzing top threats so that they can be dealt with proper efficiency. Pitch your topic with ease and precision using this Business Threats Landscape Dashboard With Cyber Attacks Analysis Ppt Summary Brochure PDF. This layout presents information on Malware Attack Frequency, Every Minute, Every Second. It is also available for immediate download and adjustment. So, changes can be made in the color, design, graphics or any other component to create a unique layout.

Change Order Administration Dashboard With Priority Assessment Ppt Portfolio Inspiration PDF
This slide showcases change order management dashboard with priority assessment. It provides information about order stats, summary, latest change orders and priority according to rank. Pitch your topic with ease and precision using this Change Order Administration Dashboard With Priority Assessment Ppt Portfolio Inspiration PDF. This layout presents information on Change Orders Priority, Change Order Stats, Change Orders Summary. It is also available for immediate download and adjustment. So, changes can be made in the color, design, graphics or any other component to create a unique layout.
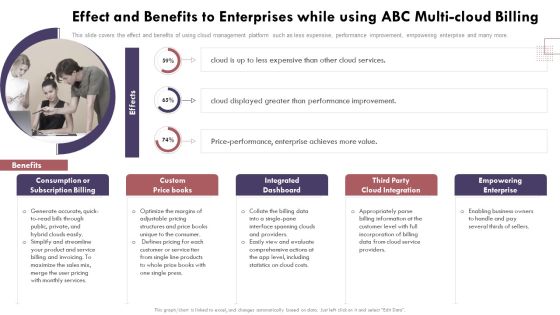
Effect And Benefits To Enterprises While Using Abc Cloud Computing Complexities And Solutions Slides PDF
This slide covers the effect and benefits of using cloud management platform such as less expensive, performance improvement, empowering enterprise and many more.Take your projects to the next level with our ultimate collection of Effect And Benefits To Enterprises While Using Abc Cloud Computing Complexities And Solutions Slides PDF. Slidegeeks has designed a range of layouts that are perfect for representing task or activity duration, keeping track of all your deadlines at a glance. Tailor these designs to your exact needs and give them a truly corporate look with your own brand colors they all make your projects stand out from the rest.

Business Strategy Consulting Solutions Company Outline Revenue Split By Geography And Business Areas Designs PDF
This slide showcases the revenue breakdown by geography such as Asia, North America, Australia, etc. It also covers business areas revenue split such as management consulting, IT consulting, etc. Take your projects to the next level with our ultimate collection of Business Strategy Consulting Solutions Company Outline Revenue Split By Geography And Business Areas Designs PDF. Slidegeeks has designed a range of layouts that are perfect for representing task or activity duration, keeping track of all your deadlines at a glance. Tailor these designs to your exact needs and give them a truly corporate look with your own brand colors they will make your projects stand out from the rest.

Plastic Waste Recycling Statistics Based On Compound Annual Growth Rate Inspiration PDF
This slide covers statistics based on top countries contribution in plastic recycling and waste management. It includes report from period 2019-2025 with insights based on CAGR. Pitch your topic with ease and precision using this Plastic Waste Recycling Statistics Based On Compound Annual Growth Rate Inspiration PDF. This layout presents information on Contributes Maximum, 2015 To 2025. It is also available for immediate download and adjustment. So, changes can be made in the color, design, graphics or any other component to create a unique layout.
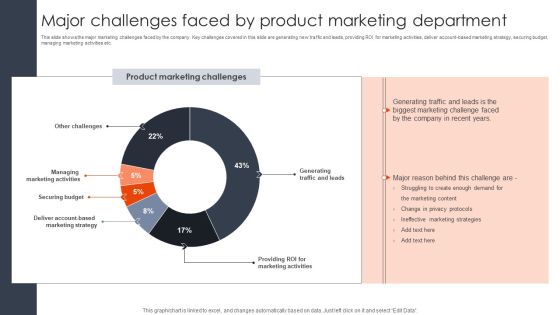
Major Challenges Faced By Product Marketing Department Client Acquisition Techniques To Boost Sales Designs PDF
This slide shows the major marketing challenges faced by the company. Key challenges covered in this slide are generating new traffic and leads, providing ROI for marketing activities, deliver account based marketing strategy, securing budget, managing marketing activities etc. Make sure to capture your audiences attention in your business displays with our gratis customizable Major Challenges Faced By Product Marketing Department Client Acquisition Techniques To Boost Sales Designs PDF. These are great for business strategies, office conferences, capital raising or task suggestions. If you desire to acquire more customers for your tech business and ensure they stay satisfied, create your own sales presentation with these plain slides.
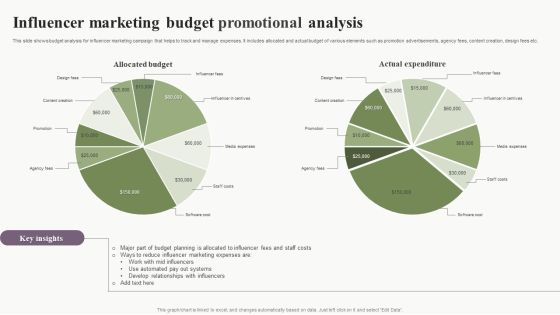
Influencer Marketing Budget Promotional Analysis Download PDF
This slide shows budget analysis for influencer marketing campaign that helps to track and manage expenses. It includes allocated and actual budget of various elements such as promotion advertisements, agency fees, content creation, design fees etc. Pitch your topic with ease and precision using this Influencer Marketing Budget Promotional Analysis Download PDF. This layout presents information on Influencer Marketing, Budget Promotional Analysis. It is also available for immediate download and adjustment. So, changes can be made in the color, design, graphics or any other component to create a unique layout.

Advantages Of Agile Methodology Contd Software Development Approaches Inspiration PDF
This slide depicts the advantages of agile methodology that include managing changing priorities, project visibility, IT alignment, delivery speed, team morale, increased productivity, and so on.Take your projects to the next level with our ultimate collection of Advantages Of Agile Methodology Contd Software Development Approaches Inspiration PDF. Slidegeeks has designed a range of layouts that are perfect for representing task or activity duration, keeping track of all your deadlines at a glance. Tailor these designs to your exact needs and give them a truly corporate look with your own brand colors they all make your projects stand out from the rest.
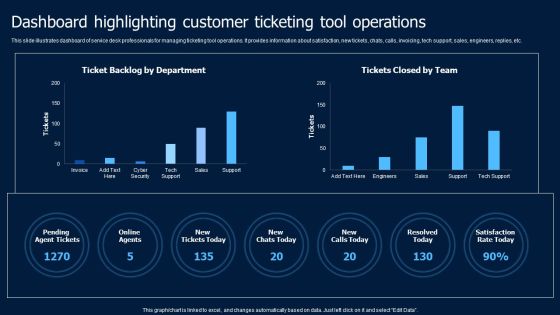
Help Desk Ticketing Dashboard Highlighting Customer Ticketing Tool Operations Introduction PDF
This slide illustrates dashboard of service desk professionals for managing ticketing tool operations. It provides information about satisfaction, new tickets, chats, calls, invoicing, tech support, sales, engineers, replies, etc. Crafting an eye-catching presentation has never been more straightforward. Let your presentation shine with this tasteful yet straightforward Help Desk Ticketing Dashboard Highlighting Customer Ticketing Tool Operations Introduction PDF maining professional. Construct the ideal Help Desk Ticketing Dashboard Highlighting Customer Ticketing Tool Operations Introduction PDF that effortlessly grabs the attention of your audience Begin now and be certain to wow your customers.

Dashboard To Depict Robot Utilization In Robotic Desktop Automation Download PDF
This slide consists of a Dashboard which can be used by managers to depict robot utilization in attended automation. Key performance indicators relate to total utilization, robot types, hours saved etc. Pitch your topic with ease and precision using this Dashboard To Depict Robot Utilization In Robotic Desktop Automation Download PDF. This layout presents information on Dashboard, Depict Robot Utilization, Robotic Desktop Automation. It is also available for immediate download and adjustment. So, changes can be made in the color, design, graphics or any other component to create a unique layout.
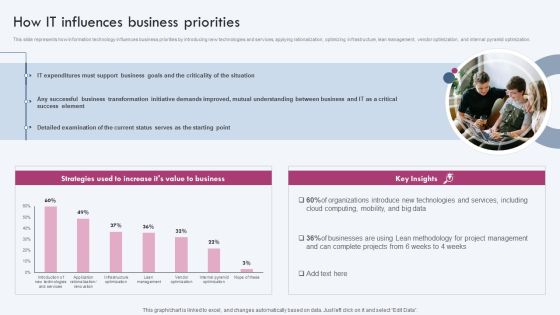
How IT Influences Business Priorities Ppt PowerPoint Presentation File Outline PDF
This slide represents how information technology influences business priorities by introducing new technologies and services, applying rationalization, optimizing infrastructure, lean management, vendor optimization, and internal pyramid optimization. Take your projects to the next level with our ultimate collection of How IT Influences Business Priorities Ppt PowerPoint Presentation File Outline PDF. Slidegeeks has designed a range of layouts that are perfect for representing task or activity duration, keeping track of all your deadlines at a glance. Tailor these designs to your exact needs and give them a truly corporate look with your own brand colors they will make your projects stand out from the rest.

KPI Dashboard For Modernizing Hospitality Business Inspiration PDF
The following slide showcases dashboard to track data and perform analytics for managing staff, ordering supplies and to maintain customer satisfaction. It presents information related to expenses, sales, etc. Pitch your topic with ease and precision using this KPI Dashboard For Modernizing Hospitality Business Inspiration PDF. This layout presents information on Fiscal Year, Labor, Modernizing Hospitality. It is also available for immediate download and adjustment. So, changes can be made in the color, design, graphics or any other component to create a unique layout.

Dashboard For Assessing Project Team Productivity Report Mockup PDF
This slide depicts a dashboard for monitoring team productivity reports in project management. It covers various areas such as billing by the consumer, productivity reports, employee billable hours, etc. Pitch your topic with ease and precision using this Dashboard For Assessing Project Team Productivity Report Mockup PDF. This layout presents information on Billing Expense Customer, Employee Productivity Report, Profitability Customer. It is also available for immediate download and adjustment. So, changes can be made in the color, design, graphics or any other component to create a unique layout.
KPI Dashboard For Tracking Brand Communication Techniques Performance Topics PDF
The following slide illustrates dashboard which helps brand managers to improve their communication campaign performance. It presents information related to campaigns, cost per acquisitions, etc. Pitch your topic with ease and precision using this KPI Dashboard For Tracking Brand Communication Techniques Performance Topics PDF. This layout presents information on KPI Dashboard, Tracking Brand Communication, Techniques Performance. It is also available for immediate download and adjustment. So, changes can be made in the color, design, graphics or any other component to create a unique layout.

Company Payout Dashboard Representing Accounts Payable Data Introduction PDF
The slide demonstrates a payment dashboard to measure and manage accounts payable. Various elements included are payable account, overdue, cash on hand, accounts payable funnel, invoice status, etc. Pitch your topic with ease and precision using this Company Payout Dashboard Representing Accounts Payable Data Introduction PDF. This layout presents information on Payable Accounts, Overdue, Invoices By Status, Account Payable Age. It is also available for immediate download and adjustment. So, changes can be made in the color, design, graphics or any other component to create a unique layout.

Software Development Project Synopsis Report Microsoft PDF
This slide showcase software development project that helps in improving efficiency and productivity of organization. It includes elements such as project name, manger, objective, core values, challenges , solutions etc. Pitch your topic with ease and precision using this Software Development Project Synopsis Report Microsoft PDF. This layout presents information on Profit Revenue, Current Status, Management. It is also available for immediate download and adjustment. So, changes can be made in the color, design, graphics or any other component to create a unique layout.

Sales Employee Representative Performance Scorecard Dashboard For Healthcare Industry Clipart PDF
This slide showcases sales performance of healthcare products which can be used by managers to evaluate business achievements. It includes key components such as monthly sales comparison, sales performance of products by different channels, sales team performance. Pitch your topic with ease and precision using this Sales Employee Representative Performance Scorecard Dashboard For Healthcare Industry Clipart PDF. This layout presents information on Monthly Sales Comparison, Revenue By Previous Year, Sales Performance, Different Products, Different Channels, Sales Team Performance . It is also available for immediate download and adjustment. So, changes can be made in the color, design, graphics or any other component to create a unique layout.
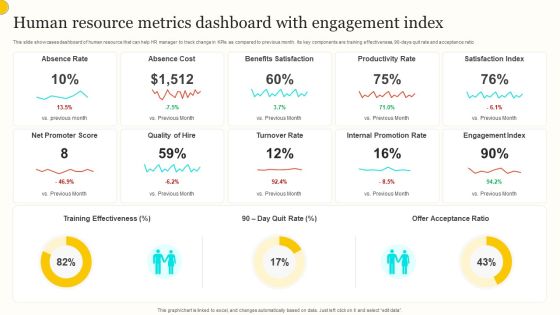
Human Resource Metrics Dashboard With Engagement Index Guidelines PDF
This slide showcases dashboard of human resource that can help HR manager to track change in KPIs as compared to previous month. Its key components are training effectiveness, 90 days quit rate and acceptance ratio. Pitch your topic with ease and precision using this Human Resource Metrics Dashboard With Engagement Index Guidelines PDF. This layout presents information on Absence Rate, Absence Cost, Benefits Satisfaction. It is also available for immediate download and adjustment. So, changes can be made in the color, design, graphics or any other component to create a unique layout.

Buyer Marketing Campaign Performance Dashboard Download PDF
Following dashboard depicts shopper marketing dashboard which can be used by managers to assess the performance of their campaigns. The key performance indicators are total customers, countries, website views, total campaigns, email sent, website traffic source etc. Pitch your topic with ease and precision using this Buyer Marketing Campaign Performance Dashboard Download PDF. This layout presents information on Total Customers, Countries, Website Views. It is also available for immediate download and adjustment. So, changes can be made in the color, design, graphics or any other component to create a unique layout.

Waterfall And Agile Model Failure Rate By Project Size Ppt Pictures Gallery PDF
This slide showcases the rate of failure of waterfall and agile model approach in project management by its size. It compares waterfall and agile model in small, medium and large project size. Make sure to capture your audiences attention in your business displays with our gratis customizable Waterfall And Agile Model Failure Rate By Project Size Ppt Pictures Gallery PDF. These are great for business strategies, office conferences, capital raising or task suggestions. If you desire to acquire more customers for your tech business and ensure they stay satisfied, create your own sales presentation with these plain slides.
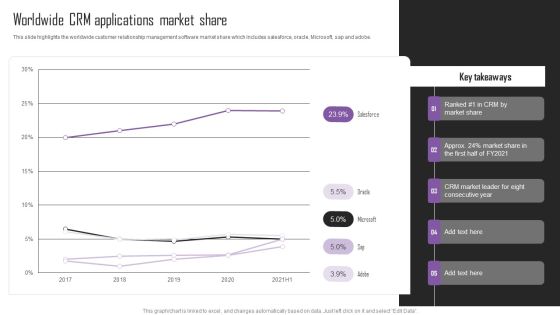
Web Hosting Software Company Outline Worldwide CRM Applications Market Share Mockup PDF
This slide highlights the worldwide customer relationship management software market share which includes salesforce, oracle, Microsoft, sap and adobe. Take your projects to the next level with our ultimate collection of Web Hosting Software Company Outline Worldwide CRM Applications Market Share Mockup PDF. Slidegeeks has designed a range of layouts that are perfect for representing task or activity duration, keeping track of all your deadlines at a glance. Tailor these designs to your exact needs and give them a truly corporate look with your own brand colors they will make your projects stand out from the rest.

Sample Restaurant Survey Feedback Example Questionnaire Result Report Survey SS
Following slides demonstrates sample questionnaire for hotel feedback which can be used by hotel managers to determine customer service improvement areas. It includes key elements such as purpose of hotel trip, check in experience, satisfaction with hotel cleanliness, and staff behaviour. Pitch your topic with ease and precision using this Sample Restaurant Survey Feedback Example Questionnaire Result Report Survey SS. This layout presents information on Maintenance, Staff Hospitality, Cleanliness Services . It is also available for immediate download and adjustment. So, changes can be made in the color, design, graphics or any other component to create a unique layout.

Research Survey Summary Report To Determine Business Marketing Efforts Survey SS
Following slide demonstrates summary result of marketing research survey conducted by marketing manager to determine brand position in market. It includes elements such as customer awareness about brand and product usage by customer. Pitch your topic with ease and precision using this Research Survey Summary Report To Determine Business Marketing Efforts Survey SS. This layout presents information on Brand Awareness, Probability. It is also available for immediate download and adjustment. So, changes can be made in the color, design, graphics or any other component to create a unique layout.
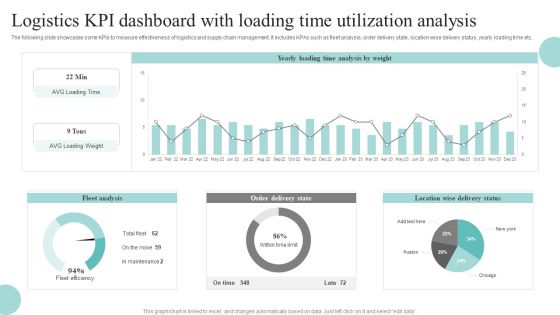
Logistics KPI Dashboard With Loading Time Utilization Analysis Download PDF
The following slide showcases some KPIs to measure effectiveness of logistics and supply chain management. It includes KPAs such as fleet analysis, order delivery state, location wise delivery status, yearly loading time etc. Pitch your topic with ease and precision using this Logistics KPI Dashboard With Loading Time Utilization Analysis Download PDF. This layout presents information on Fleet Analysis, Order Delivery State, Location Wise Delivery Status. It is also available for immediate download and adjustment. So, changes can be made in the color, design, graphics or any other component to create a unique layout.

Ad Campaign Dashboard New Product Release Strategy Guidelines PDF
This slide depicts advertisement campaign dashboard used by fintech company managers to track effectiveness of the campaign for new product launch. The key performance indicators are ad cost, total clicks, total impressions, ad impressions etc. Pitch your topic with ease and precision using this Ad Campaign Dashboard New Product Release Strategy Guidelines PDF. This layout presents information on Impressions, Conversion, Strategy. It is also available for immediate download and adjustment. So, changes can be made in the color, design, graphics or any other component to create a unique layout.
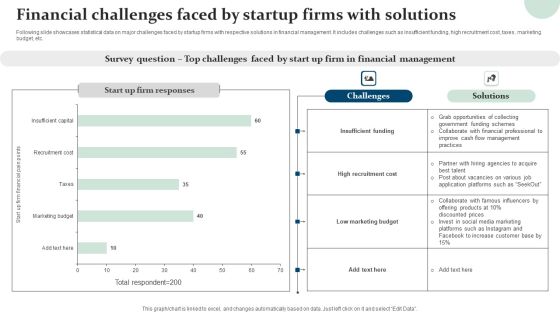
Financial Challenges Faced By Startup Firms With Solutions Slides PDF
Following slide showcases statistical data on major challenges faced by startup firms with respective solutions in financial management. It includes challenges such as insufficient funding, high recruitment cost, taxes, marketing budget, etc. Pitch your topic with ease and precision using this Financial Challenges Faced By Startup Firms With Solutions Slides PDF. This layout presents information on Insufficient Funding, High Recruitment Cost, Low Marketing Budget. It is also available for immediate download and adjustment. So, changes can be made in the color, design, graphics or any other component to create a unique layout.
Impact Of Implementing Hospital Marketing Strategies Slides PDF
This slide showcases the impact of implementing hospital management strategies. It shows impact on patient volume, patient satisfaction rate, increase in physician referrals and increase in revenue. Make sure to capture your audiences attention in your business displays with our gratis customizable Impact Of Implementing Hospital Marketing Strategies Slides PDF. These are great for business strategies, office conferences, capital raising or task suggestions. If you desire to acquire more customers for your tech business and ensure they stay satisfied, create your own sales presentation with these plain slides.

Customer Decline Of Sales Analysis Dashboard Rules PDF
The following slide presents a key performance indicating dashboards that can be used by managers in order to analyse customer-lost sales. Major key performance indicators are lost deals rate, lost sales rate, customer data analytics, etc. Pitch your topic with ease and precision using this Customer Decline Of Sales Analysis Dashboard Rules PDF. This layout presents information on Customer Data Analytics. It is also available for immediate download and adjustment. So, changes can be made in the color, design, graphics or any other component to create a unique layout.
Email Advertising Report Growth Dashboard Formats PDF
This slide dashboard is helpful for managers, executives, and stakeholders to display the effectiveness of an email marketing strategy. It includes active accounts, deleted accounts, and unsubscribed accounts in a month and a year. Pitch your topic with ease and precision using this Email Advertising Report Growth Dashboard Formats PDF. This layout presents information on Email Advertising, Report Growth Dashboard . It is also available for immediate download and adjustment. So, changes can be made in the color, design, graphics or any other component to create a unique layout.

Dashboard To Track Effectiveness Of Owned Media Marketing Structure PDF
This slide illustrates a dashboard which can be used by brand managers to track the effectiveness of earned media in the domain of digital marketing. The key elements include brand mentions, social media reach, customer interactions, positive and negative feedback Pitch your topic with ease and precision using this Dashboard To Track Effectiveness Of Owned Media Marketing Structure PDF. This layout presents information on Brand Mentions, Social Media, Marketing. It is also available for immediate download and adjustment. So, changes can be made in the color, design, graphics or any other component to create a unique layout.

Country Wise Data Of Average Duration Of Hospital Stay After Giving Birth Designs PDF
This slide showcases the average length of hospital stay based on the diagnosis to understand issues and enhance patient acute care management. It also includes the length of womens hospital stays in different nations. Pitch your topic with ease and precision using this Country Wise Data Of Average Duration Of Hospital Stay After Giving Birth Designs PDF. This layout presents information on Country Wise Data, Average Duration. It is also available for immediate download and adjustment. So, changes can be made in the color, design, graphics or any other component to create a unique layout.
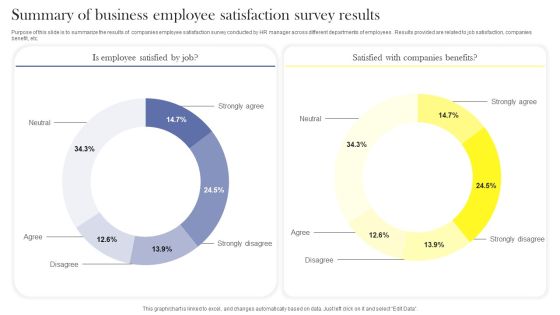
Summary Of Business Employee Satisfaction Survey Results Survey SS
Purpose of this slide is to summarize the results of companies employee satisfaction survey conducted by HR manager across different departments of employees . Results provided are related to job satisfaction, companies benefit, etc. Pitch your topic with ease and precision using this Summary Of Business Employee Satisfaction Survey Results Survey SS. This layout presents information on Neutral, Strongly Agree, Strongly Disagree, Disagree, Agree. It is also available for immediate download and adjustment. So, changes can be made in the color, design, graphics or any other component to create a unique layout.

Data Security And Privacy Audit Questionnaire Overview Report Survey SS
Following slides demonstrates data security evaluation summary report which can be used by business to reduce data hacking. It includes elements such as data security tools, budget allocation on tools, satisfaction level with tools, etc. Pitch your topic with ease and precision using this Data Security And Privacy Audit Questionnaire Overview Report Survey SS. This layout presents information on Data Security Tools, Budget Allocated, Tools Performance, Data Security Tools Management. It is also available for immediate download and adjustment. So, changes can be made in the color, design, graphics or any other component to create a unique layout.
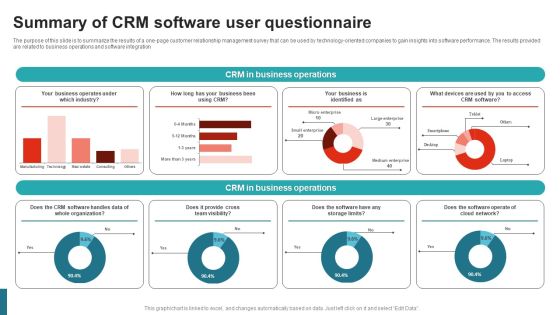
Summary Of CRM Software User Questionnaire Survey SS
The purpose of this slide is to summarize the results of a one-page customer relationship management survey that can be used by technology-oriented companies to gain insights into software performance. The results provided are related to business operations and software integration. Pitch your topic with ease and precision using this Summary Of CRM Software User Questionnaire Survey SS. This layout presents information on CRM In Business Operations, Industry, Cloud Network, Team Visibility. It is also available for immediate download and adjustment. So, changes can be made in the color, design, graphics or any other component to create a unique layout.

Summary Of New Product Launch Feedback Questionnaire Survey SS
The purpose of this slide is to summarize the results of a one-page survey that can be used by product developers and business managers to gain insights from customers. The results provided are related to customer information and product usage. Pitch your topic with ease and precision using this Summary Of New Product Launch Feedback Questionnaire Survey SS. This layout presents information on Customer Information, Product Usage, Occupation, Value For Money, Product Quality. It is also available for immediate download and adjustment. So, changes can be made in the color, design, graphics or any other component to create a unique layout.

Summary Of Financial Performance Of Present Business Survey SS
The purpose of this slide is to summarize the results of a one-page survey that can be used by policymakers to gain insights into the financial performance of all the businesses operating in the service industry to gain insights and take action accordingly. The results provided are related to executions and staffing. Pitch your topic with ease and precision using this Summary Of Financial Performance Of Present Business Survey SS. This layout presents information on Business Executions, Business Employees, Organization, Officers, Managers, Staff. It is also available for immediate download and adjustment. So, changes can be made in the color, design, graphics or any other component to create a unique layout.

Dashboard For Brand Marketing Governance Strategy Portrait PDF
The following slide highlights strategy for brand management to support companies to improve revenue, brand recognition etc. It includes components such as customers, campaigns, customer value, demographic breakdown, brand mentions, advertising, web conversion rate, loan to value, customer acquisition cost etc. Pitch your topic with ease and precision using this Dashboard For Brand Marketing Governance Strategy Portrait PDF. This layout presents information on Brand, Customers, Campaigns. It is also available for immediate download and adjustment. So, changes can be made in the color, design, graphics or any other component to create a unique layout.
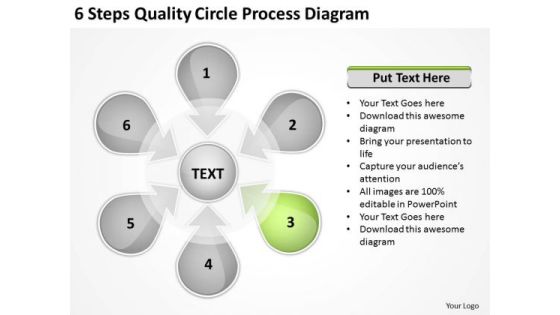
Circle Process Diagram Example Of Executive Summary For Business Plan PowerPoint Templates
We present our circle process diagram example of executive summary for business plan PowerPoint templates.Use our Process and Flows PowerPoint Templates because Our PowerPoint Templates and Slides will Embellish your thoughts. They will help you illustrate the brilliance of your ideas. Use our Business PowerPoint Templates because Our PowerPoint Templates and Slides will provide you the cutting edge. Slice through the doubts in the minds of your listeners. Present our Flow Charts PowerPoint Templates because You are working at that stage with an air of royalty. Let our PowerPoint Templates and Slides be the jewels in your crown. Present our Arrows PowerPoint Templates because Our PowerPoint Templates and Slides come in all colours, shades and hues. They help highlight every nuance of your views. Download our Marketing PowerPoint Templates because It will Raise the bar of your Thoughts. They are programmed to take you to the next level.Use these PowerPoint slides for presentations relating to Arrows, background, blank, bright, business, chart, circle, circlediagram, color, colorful, company, creative, design, diagram, element, form,forum, graph, graphic, illustration, management, marketing, network, option, organization, plan, presentation, presentation,diagram, process, round, segment, shape, sphere, spherechart, six, variations, vector, vehicle chart, web design. The prominent colors used in the PowerPoint template are Green lime, Gray, White.


 Continue with Email
 Sign up for an account
 Home
Home


