AI PPT Maker
Templates
PPT Bundles
Design Services
Business PPTs
Business Plan
Management
Strategy
Introduction PPT
Roadmap
Self Introduction
Timelines
Process
Marketing
Agenda
Technology
Medical
Startup Business Plan
Cyber Security
Dashboards
SWOT
Proposals
Education
Pitch Deck
Digital Marketing
KPIs
Project Management
Product Management
Artificial Intelligence
Target Market
Communication
Supply Chain
Google Slides
Research Services
 One Pagers
All Categories
-
Home
- Customer Favorites
- Scoring Chart
Scoring Chart
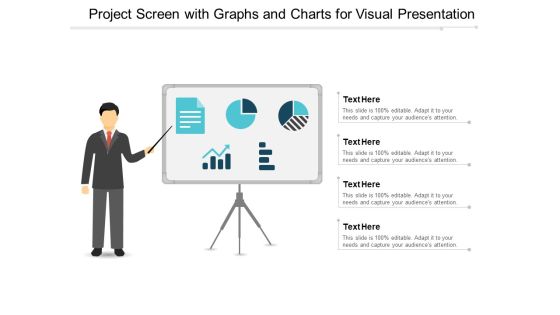
Project Screen With Graphs And Charts For Visual Presentation Ppt PowerPoint Presentation Gallery Design Inspiration
This is a project screen with graphs and charts for visual presentation ppt powerpoint presentation gallery design inspiration. This is a four stage process. The stages in this process are visual aids, communication, business.

Marketing Mix For Global Expansion Ppt PowerPoint Presentation Diagram Graph Charts PDF
This slide showcases marketing mix that can help organization to plan and manage promotion for global expansion. Its key elements are product, price, place and promotion.If you are looking for a format to display your unique thoughts, then the professionally designed Marketing Mix For Global Expansion Ppt PowerPoint Presentation Diagram Graph Charts PDF is the one for you. You can use it as a Google Slides template or a PowerPoint template. Incorporate impressive visuals, symbols, images, and other charts. Modify or reorganize the text boxes as you desire. Experiment with shade schemes and font pairings. Alter, share or cooperate with other people on your work. Download Marketing Mix For Global Expansion Ppt PowerPoint Presentation Diagram Graph Charts PDF and find out how to give a successful presentation. Present a perfect display to your team and make your presentation unforgettable.
Social Media Icons With Pie Charts For Marketing Analysis Ppt PowerPoint Presentation Ideas Example
This is a social media icons with pie charts for marketing analysis ppt powerpoint presentation ideas example. This is a six stage process. The stages in this process are kpi proposal, kpi plan, kpi scheme.

Layout Of Converging 12 Steps Linear Flow Charts And Networks PowerPoint Templates
We present our layout of converging 12 steps linear flow Charts and Networks PowerPoint templates.Present our Symbol PowerPoint Templates because you can Decorate it with your well wrapped ideas and colourful thoughts. Download our Business PowerPoint Templates because your product has established a foothold in the market. Customers are happy with the value it brings to their lives. Download and present our Arrows PowerPoint Templates because your team and you always raise a toast. Download and present our Shapes PowerPoint Templates because your ideas are fundamentally stable with a broad base of workable possibilities. Use our Process and Flows PowerPoint Templates because you have the moves to sway the market.Use these PowerPoint slides for presentations relating to Arrows, Business, Central, Centralized, Chart, Circle, Circular, Circulation, Concept, Conceptual, Converging, Design, Diagram, Executive, Icon, Idea, Illustration, Management, Mapping, Model, Numbers, Organization, Outwards, Pointing, Procedure, Process, Radial, Radiating, Relationship, Resource, Sequence, Sequential, Square. The prominent colors used in the PowerPoint template are Blue, Gray, White. Use our layout of converging 12 steps linear flow Charts and Networks PowerPoint templates are Appealing. We assure you our Centralized PowerPoint templates and PPT Slides are Playful. People tell us our layout of converging 12 steps linear flow Charts and Networks PowerPoint templates are Youthful. PowerPoint presentation experts tell us our Central PowerPoint templates and PPT Slides are Wistful. PowerPoint presentation experts tell us our layout of converging 12 steps linear flow Charts and Networks PowerPoint templates are Fun. Use our Circular PowerPoint templates and PPT Slides are Endearing.

3D Charts For Comparing Amounts And Volume Ppt PowerPoint Presentation Show Deck
This is a 3d charts for comparing amounts and volume ppt powerpoint presentation show deck. This is a five stage process. The stages in this process are art, colouring, paint brush.

Business Analysis Data Charts And Reports Ppt Powerpoint Presentation Ideas Portrait
This is a business analysis data charts and reports ppt powerpoint presentation ideas portrait. This is a three stage process. The stages in this process are business metrics, business kpi, business dashboard.

Computer Screen With Business Data Charts Ppt Powerpoint Presentation Show Vector
This is a computer screen with business data charts ppt powerpoint presentation show vector. This is a four stage process. The stages in this process are business metrics, business kpi, business dashboard.

Data Statistics Charts And Key Performance Indicators Ppt Powerpoint Presentation Layouts Guide
This is a data statistics charts and key performance indicators ppt powerpoint presentation layouts guide. This is a four stage process. The stages in this process are business metrics, business kpi, business dashboard.

Financial Charts And Graphs For Statistical Analysis Ppt Powerpoint Presentation Show Layout
This is a financial charts and graphs for statistical analysis ppt powerpoint presentation show layout. This is a four stage process. The stages in this process are business metrics, business kpi, business dashboard.
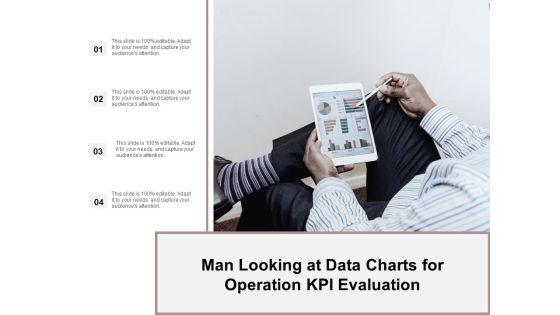
Man Looking At Data Charts For Operation Kpi Evaluation Ppt Powerpoint Presentation Ideas Demonstration
This is a man looking at data charts for operation kpi evaluation ppt powerpoint presentation ideas demonstration. This is a four stage process. The stages in this process are business metrics, business kpi, business dashboard.

Overview Of Non Fungible Tokens Ppt PowerPoint Presentation Diagram Graph Charts PDF
This slide depicts the overview of non-fungible tokens these are secure tokens that confirm the ownership of one-of-a-kind goods as a blockchain asset. If you are looking for a format to display your unique thoughts, then the professionally designed Overview Of Non Fungible Tokens Ppt PowerPoint Presentation Diagram Graph Charts PDF is the one for you. You can use it as a Google Slides template or a PowerPoint template. Incorporate impressive visuals, symbols, images, and other charts. Modify or reorganize the text boxes as you desire. Experiment with shade schemes and font pairings. Alter, share or cooperate with other people on your work. Download Overview Of Non Fungible Tokens Ppt PowerPoint Presentation Diagram Graph Charts PDF and find out how to give a successful presentation. Present a perfect display to your team and make your presentation unforgettable.

Business Circle Charts PowerPoint Templates Business Enterprise Resource Planning Ppt Slides
Business Circle Charts PowerPoint Templates Business Enterprise Resource Planning PPT Slides-A wonderful graphics to make a PowerPoint presentation on Enterprise Resource Planning-Business Circle Charts PowerPoint Templates Business Enterprise Resource Planning PPT Slides-This template can be used for presentations relating to 3d, Arrow, Blueprint, Business, Circle, Cleverness, Commerce, Company, Competence, Concept, Constructive, Corporate, Create, Creative, Creativity, Decision, Design, Develop, Device, Discover, Earn, Enterprise, Finance, Goal, Idea, Imaginative, Ingenious, Innovative, Inspiration, Inspire, Inventive, Job, Management, Market
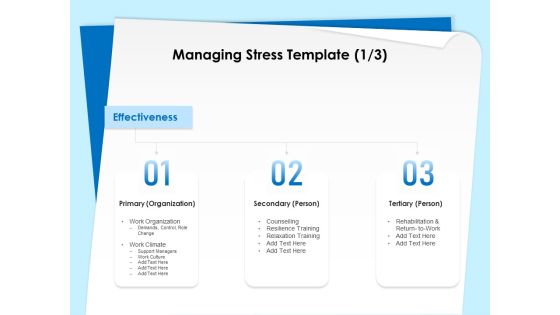
Executive Leadership Programs Managing Stress Template Primary Ppt PowerPoint Presentation Diagram Graph Charts PDF
Presenting this set of slides with name executive leadership programs managing stress template primary ppt powerpoint presentation diagram graph charts pdf. This is a three stage process. The stages in this process are primary organization, secondary person, tertiary person, work organization, resilience training, relaxation training. This is a completely editable PowerPoint presentation and is available for immediate download. Download now and impress your audience.

Customer Onboarding Journey Process Timeline Ppt PowerPoint Presentation Diagram Graph Charts PDF
Do you have to make sure that everyone on your team knows about any specific topic I yes, then you should give Customer Onboarding Journey Process Timeline Ppt PowerPoint Presentation Diagram Graph Charts PDF a try. Our experts have put a lot of knowledge and effort into creating this impeccable Customer Onboarding Journey Process Timeline Ppt PowerPoint Presentation Diagram Graph Charts PDF. You can use this template for your upcoming presentations, as the slides are perfect to represent even the tiniest detail. You can download these templates from the Slidegeeks website and these are easy to edit. So grab these today.

FDDI Architecture And Its Working Ppt PowerPoint Presentation Diagram Graph Charts PDF
This slide demonstrates the architecture and the working of FDDI, which is often implemented as a double token-passing ring inside a ring topology primary and secondary rings make up the dual ring, and the main ring carries data. Here you can discover an assortment of the finest PowerPoint and Google Slides templates. With these templates, you can create presentations for a variety of purposes while simultaneously providing your audience with an eye catching visual experience. Download FDDI Architecture And Its Working Ppt PowerPoint Presentation Diagram Graph Charts PDF to deliver an impeccable presentation. These templates will make your job of preparing presentations much quicker, yet still, maintain a high level of quality. Slidegeeks has experienced researchers who prepare these templates and write high quality content for you. Later on, you can personalize the content by editing the FDDI Architecture And Its Working Ppt PowerPoint Presentation Diagram Graph Charts PDF.

7 Stages Diverging Arrows Schematic Diagram Charts And Networks PowerPoint Slide
We present our 7 stages diverging arrows schematic diagram Charts and Networks PowerPoint Slide.Download our Marketing PowerPoint Templates because you can Be the cynosure of all eyes with our template depicting . Use our Shapes PowerPoint Templates because you know your business and have a vision for it. Present our Arrows PowerPoint Templates because you have the process in your head, our template design showing will illuminate your thoughts. Use our Business PowerPoint Templates because profit levels have been steady over the recent past. Spread your heightened excitement to others in the room. Use our Process and Flows PowerPoint Templates because this diagram depicts the essence of this chain reaction like sequence of events.Use these PowerPoint slides for presentations relating to Arrows, Business, Chart, Cyclic, Data, Diagram, Financial, Goal, Graph, Illustration, Info, Information, Marketing, Model, Option, Part, Pie, Presentation, Process, Result, Sphere, Statistics. The prominent colors used in the PowerPoint template are Green, Gray, Black. The feedback we get is that our 7 stages diverging arrows schematic diagram Charts and Networks PowerPoint Slide are Handsome. People tell us our Diagram PowerPoint templates and PPT Slides will help you be quick off the draw. Just enter your specific text and see your points hit home. Presenters tell us our 7 stages diverging arrows schematic diagram Charts and Networks PowerPoint Slide are Precious. Use our Diagram PowerPoint templates and PPT Slides are Beautiful. Use our 7 stages diverging arrows schematic diagram Charts and Networks PowerPoint Slide are Nifty. Use our Diagram PowerPoint templates and PPT Slides are Exuberant.

7 Stages Diverging Arrows Schematic Diagram Ppt Charts And Networks PowerPoint Slide
We present our 7 stages diverging arrows schematic diagram ppt Charts and Networks PowerPoint Slide.Use our Marketing PowerPoint Templates because you can Break it all down to Key Result Areas. Use our Shapes PowerPoint Templates because this diagram is designed to help your audience to develop their thoughts along the way. Use our Arrows PowerPoint Templates because this slide illuminates the spiritual brilliance of Jesus and showers the love for mankind he showed even while being crucified. Use our Business PowerPoint Templates because you can Lead your flock steadily to greater heights. Look around at the vast potential of achievement around you. Use our Process and Flows PowerPoint Templates because you can Highlight the key components of your entire manufacturing/ business process.Use these PowerPoint slides for presentations relating to Arrows, Business, Chart, Cyclic, Data, Diagram, Financial, Goal, Graph, Illustration, Info, Information, Marketing, Model, Option, Part, Pie, Presentation, Process, Result, Sphere, Statistics. The prominent colors used in the PowerPoint template are Blue, Gray, Black. The feedback we get is that our 7 stages diverging arrows schematic diagram ppt Charts and Networks PowerPoint Slide are Fashionable. People tell us our Data PowerPoint templates and PPT Slides are Perfect. Presenters tell us our 7 stages diverging arrows schematic diagram ppt Charts and Networks PowerPoint Slide will make the presenter successul in his career/life. Use our Goal PowerPoint templates and PPT Slides are Bold. Use our 7 stages diverging arrows schematic diagram ppt Charts and Networks PowerPoint Slide are Spiffy. Use our Financial PowerPoint templates and PPT Slides are Functional.

7 Stages Diverging Arrows Schematic Diagram Charts And Networks PowerPoint Slides
We present our 7 stages diverging arrows schematic diagram Charts and Networks PowerPoint Slides.Download and present our Marketing PowerPoint Templates because different personalities, different abilities but formidable together. Download and present our Shapes PowerPoint Templates because you have to coordinate and motivate your team. Download and present our Arrows PowerPoint Templates because our templates illustrates your ability. Download and present our Business PowerPoint Templates because everybody knows The world over it is a priority for many. Along with it there are so many oppurtunities waiting to be utilised. Use our Process and Flows PowerPoint Templates because they pinpoint the core values of your organisation.Use these PowerPoint slides for presentations relating to Arrows, Business, Chart, Cyclic, Data, Diagram, Financial, Goal, Graph, Illustration, Info, Information, Marketing, Model, Option, Part, Pie, Presentation, Process, Result, Sphere, Statistics. The prominent colors used in the PowerPoint template are White, Gray, Black. The feedback we get is that our 7 stages diverging arrows schematic diagram Charts and Networks PowerPoint Slides help you meet deadlines which are an element of today's workplace. Just browse and pick the slides that appeal to your intuitive senses. People tell us our Data PowerPoint templates and PPT Slides are Cheerful. Presenters tell us our 7 stages diverging arrows schematic diagram Charts and Networks PowerPoint Slides look good visually. Use our Data PowerPoint templates and PPT Slides are Wonderful. Use our 7 stages diverging arrows schematic diagram Charts and Networks PowerPoint Slides are Youthful. Use our Diagram PowerPoint templates and PPT Slides are Upbeat.
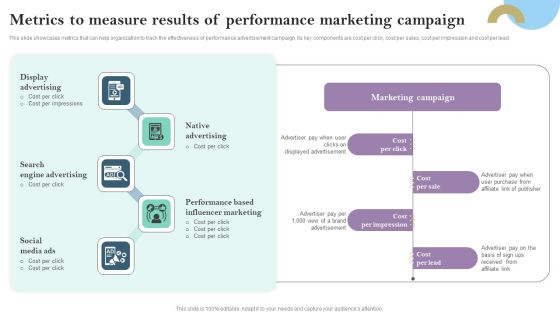
Metrics To Measure Results Of Performance Marketing Campaign Ppt PowerPoint Presentation Diagram Graph Charts PDF
This slide showcases metrics that can help organization to track the effectiveness of performance advertisement campaign. Its key components are cost per click, cost per sales, cost per impression and cost per lead Presenting this PowerPoint presentation, titled Metrics To Measure Results Of Performance Marketing Campaign Ppt PowerPoint Presentation Diagram Graph Charts PDF, with topics curated by our researchers after extensive research. This editable presentation is available for immediate download and provides attractive features when used. Download now and captivate your audience. Presenting this Metrics To Measure Results Of Performance Marketing Campaign Ppt PowerPoint Presentation Diagram Graph Charts PDF. Our researchers have carefully researched and created these slides with all aspects taken into consideration. This is a completely customizable Metrics To Measure Results Of Performance Marketing Campaign Ppt PowerPoint Presentation Diagram Graph Charts PDF that is available for immediate downloading. Download now and make an impact on your audience. Highlight the attractive features available with our PPTs.

Workplace Risk Management And Reduction Based On ALARP Principle Ppt PowerPoint Presentation Diagram Graph Charts PDF
Whether you have daily or monthly meetings, a brilliant presentation is necessary. Workplace Risk Management And Reduction Based On ALARP Principle Ppt PowerPoint Presentation Diagram Graph Charts PDF can be your best option for delivering a presentation. Represent everything in detail using Workplace Risk Management And Reduction Based On ALARP Principle Ppt PowerPoint Presentation Diagram Graph Charts PDF and make yourself stand out in meetings. The template is versatile and follows a structure that will cater to your requirements. All the templates prepared by Slidegeeks are easy to download and edit. Our research experts have taken care of the corporate themes as well. So, give it a try and see the results.
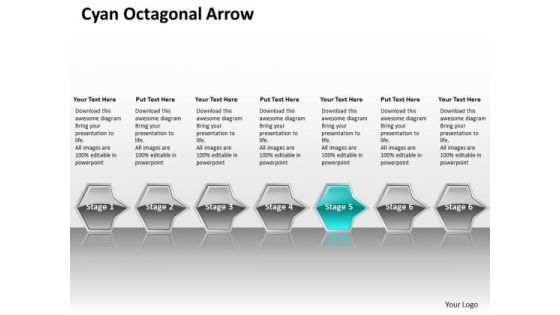
Ppt Consecutive Flow Process Charts Of Cyan Octagonal Arrow 7 Stages PowerPoint Templates
PPT consecutive flow process charts of cyan octagonal arrow 7 stages PowerPoint Templates-This PowerPoint Diagram shows you the Continual Series of seven stages through octagonal boxes. It shows the consecutive concepts to be explained together in one process. You can change color, size and orientation of any icon to your liking.-PPT consecutive flow process charts of cyan octagonal arrow 7 stages PowerPoint Templates-Shapes, Designs, Arrows, Badge, Balloon, Bar, Blank, Blue, Bright, Bubbles, Buttons, Circle, Color, Cross, Design, Drop, Elements, Glossy, Glowing, Graphic, Hexagon, Icon, Illustration, Navigation, Octagon, Plus, Polygon, Rectangles, Round, Seals, Set, Shadow, Shiny, Sign, Speech, Squares, Stars, Stickers, Submit, Symbol

Artificial Surveillance Timeline Process Ppt PowerPoint Presentation Diagram Graph Charts PDF
Presenting this set of slides with name artificial surveillance timeline process ppt powerpoint presentation diagram graph charts pdf. This is a four stage process. The stages in this process are timeline, 2017 to 2020. This is a completely editable PowerPoint presentation and is available for immediate download. Download now and impress your audience.

5 Steps Illustrated In Horizontal Manner Process Flow Charts Examples PowerPoint Templates
We present our 5 steps illustrated in horizontal manner process flow charts examples PowerPoint templates.Download and present our Arrows PowerPoint Templates because it shows you the vision of a desired destination and the best road to take to reach that goal. Download and present our Shapes PowerPoint Templates because it helps your team to align their arrows to consistently be accurate. Download our Signs PowerPoint Templates because generation of sales is the core of any business. Use our Business PowerPoint Templates because you have churned your mind and come upwith solutions. Use our Process and Flows PowerPoint Templates because this diagram has the unique ability to drive home your ideas and show how they mesh to guarantee success.Use these PowerPoint slides for presentations relating to Abstract, Arrows, business, chart, circulation, concept, conceptual, design, diagram, executive, four, icon, idea, illustration, management, map, mapping, model, numbers, organization, procedure, process, progression, resource, sequence, sequential, stages, steps, strategy,. The prominent colors used in the PowerPoint template are Green, Gray, White. The feedback we get is that our 5 steps illustrated in horizontal manner process flow charts examples PowerPoint templates are topically designed to provide an attractive backdrop to any subject. People tell us our circulation PowerPoint templates and PPT Slides are Luxuriant. We assure you our 5 steps illustrated in horizontal manner process flow charts examples PowerPoint templates are Wistful. Presenters tell us our conceptual PowerPoint templates and PPT Slides are Amazing. We assure you our 5 steps illustrated in horizontal manner process flow charts examples PowerPoint templates are Beautiful. Use our concept PowerPoint templates and PPT Slides are Striking.

Customer Voice Service Data Flow Charts Ppt PowerPoint Presentation Icon Styles PDF
This slide presents a data flow charts, which includes visual data about the inputs and outputs of entities and processes illustrating the flow of information between client voice services and data verse. it covers procedures including create project, distribute survey, respond to survey and analyse results. Presenting Customer Voice Service Data Flow Charts Ppt PowerPoint Presentation Icon Styles PDF to dispense important information. This template comprises one stages. It also presents valuable insights into the topics including Create Project, Distribute Survey, Analyze Results, Project Information. This is a completely customizable PowerPoint theme that can be put to use immediately. So, download it and address the topic impactfully.

Graphical Representation Of Research IT Google Charts Tool For Data Visualization Introduction PDF
This slide depicts google charts as the tool for data visualization, which can extract data from various sources, including SQL, databases, google sheets. This is a graphical representation of research it google charts tool for data visualization introduction pdf template with various stages. Focus and dispense information on five stages using this creative set, that comes with editable features. It contains large content boxes to add your information on topics like dynamic, databases, sources, technology. You can also showcase facts, figures, and other relevant content using this PPT layout. Grab it now.

3d Homogeneous Puzzle Flow 6 Issue How To Make Charts PowerPoint Templates
We present our 3d homogeneous puzzle flow 6 issues how to make charts PowerPoint templates. Use our Business PowerPoint Templates because, Vision Ave Future St Template: - There was a vision of a desired destination and the best road to take to reach that goal. Use our Puzzles or Jigsaws PowerPoint Templates because, and keep you group steady in the top bracket. Use our Shapes PowerPoint Templates because, this one depicts the popular chart. Use our Communication PowerPoint Templates because; Break it all down to Key Result Areas. Use our Process and Flows PowerPoint Templates because, Our Template designs are State of the Art. Use these PowerPoint slides for presentations relating to abstract, action, attach, box, business, center, chain, chart, color, communication, concept, connection, cube, cycle, data, diagram, flow, globe, horizontal, idea, illustration, individual, information, interaction, jigsaw, join pieces, process puzzle, relationship, shape, success. The prominent colors used in the PowerPoint template are Blue, Gray, and Black

Table Of Contents Information Security Ppt PowerPoint Presentation Diagram Graph Charts PDF
Find highly impressive Table Of Contents Information Security Ppt PowerPoint Presentation Diagram Graph Charts PDF on Slidegeeks to deliver a meaningful presentation. You can save an ample amount of time using these presentation templates. No need to worry to prepare everything from scratch because Slidegeeks experts have already done a huge research and work for you. You need to download Table Of Contents Information Security Ppt PowerPoint Presentation Diagram Graph Charts PDF for your upcoming presentation. All the presentation templates are 100 percent editable and you can change the color and personalize the content accordingly. Download now.

Use Cases Of Cloud Access Security Broker Ppt PowerPoint Presentation Diagram Graph Charts PDF
Find highly impressive Use Cases Of Cloud Access Security Broker Ppt PowerPoint Presentation Diagram Graph Charts PDF on Slidegeeks to deliver a meaningful presentation. You can save an ample amount of time using these presentation templates. No need to worry to prepare everything from scratch because Slidegeeks experts have already done a huge research and work for you. You need to download Use Cases Of Cloud Access Security Broker Ppt PowerPoint Presentation Diagram Graph Charts PDF for your upcoming presentation. All the presentation templates are 100 percent editable and you can change the color and personalize the content accordingly. Download now.

Process Flow Of Service Desk Management Ppt PowerPoint Presentation Diagram Graph Charts PDF
The following slide illustrates process flow of service desk management. It provides information about resolution time, in-call waiting time, agent call connection, issue escalation, client notification, operations management, etc. Explore a selection of the finest Process Flow Of Service Desk Management Ppt PowerPoint Presentation Diagram Graph Charts PDF here. With a plethora of professionally designed and pre made slide templates, you can quickly and easily find the right one for your upcoming presentation. You can use our Process Flow Of Service Desk Management Ppt PowerPoint Presentation Diagram Graph Charts PDF to effectively convey your message to a wider audience. Slidegeeks has done a lot of research before preparing these presentation templates. The content can be personalized and the slides are highly editable. Grab templates today from Slidegeeks.
Icons Slide For Establishing And Implementing HR Online Learning Program Ppt Diagram Graph Charts PDF
Presenting this set of slides containing editable icons for topic icons slide for establishing and implementing hr online learning program ppt diagram graph charts pdf. All icons in this slide are 100 percent editable. You can replace icons in your deck with any of these icons. Download now and impress your audience.

Layout Of Converging 12 Steps Linear Flow Ppt Charts And Diagrams PowerPoint Slides
We present our layout of converging 12 steps linear flow ppt Charts and Diagrams PowerPoint Slides.Download our Symbol PowerPoint Templates because you can Present your views on the methods using our self-explanatory templates. Download and present our Business PowerPoint Templates because you have had your share of being a goldfish in a small bowl.you are ready to launch out and spread your wings. Download our Arrows PowerPoint Templates because this layout helps you to impress upon the audience how your strategy will carry all to the top of the corporate heap. Download and present our Shapes PowerPoint Templates because infrastructure growth is an obvious requirement of today.inform your group on how exactly this potential is tailor made for you. Present our Process and Flows PowerPoint Templates because all elements of the venture are equally critical.Use these PowerPoint slides for presentations relating to Arrows, Business, Central, Centralized, Chart, Circle, Circular, Circulation, Concept, Conceptual, Converging, Design, Diagram, Executive, Icon, Idea, Illustration, Management, Mapping, Model, Numbers, Organization, Outwards, Pointing, Procedure, Process, Radial, Radiating, Relationship, Resource, Sequence, Sequential, Square. The prominent colors used in the PowerPoint template are Blue, Gray, White. Use our layout of converging 12 steps linear flow ppt Charts and Diagrams PowerPoint Slides are Radiant. We assure you our Circulation PowerPoint templates and PPT Slides are Stunning. People tell us our layout of converging 12 steps linear flow ppt Charts and Diagrams PowerPoint Slides are Stunning. PowerPoint presentation experts tell us our Concept PowerPoint templates and PPT Slides are Reminiscent. PowerPoint presentation experts tell us our layout of converging 12 steps linear flow ppt Charts and Diagrams PowerPoint Slides are Detailed. Use our Central PowerPoint templates and PPT Slides are Precious.

White House Winter Image With Snow Ppt PowerPoint Presentation Diagram Graph Charts PDF
Pitch your topic with ease and precision using this white house winter image with snow ppt powerpoint presentation diagram graph charts pdf. This layout presents information on white house winter image with snow. It is also available for immediate download and adjustment. So, changes can be made in the color, design, graphics or any other component to create a unique layout.

Business Charts PowerPoint Templates 4 Reasons You Should Buy From Circular Process Tables Sales
Business Charts PowerPoint templates 4 reasons you should buy from circular process tables Sales-This PowerPoint Diagram consists of four animated Process tables of Different Colors. It can be used to symbolize four different Approaches or four distinct techniques. It consists of single color slide as well. This diagram will fit for Business Presentations.

3d Consecutive Flow Process 5 Concepts What Is Charts PowerPoint Slides
We present our 3d consecutive flow process 5 concepts what is charts PowerPoint Slides. Use our Business PowerPoint Templates because, Marketing Strategy Business Template:- Maximizing sales of your product is the intended destination. Use our Leadership PowerPoint Templates because, Knowledge is power goes the popular saying. Use our Shapes PowerPoint Templates because, you have it all down to a nicety, slice by slice, layer by layer. Use our Metaphor PowerPoint Templates because, Gears interconnected: - The Gear Train is a basic element of living and daily business. Use our Process and Flows PowerPoint Templates because, But you have the ideas, you have got a brainwave. Use these PowerPoint slides for presentations relating to abstract, arrow, blank, business, chart, circular, circulation, concept, conceptual, consecutive, design, diagram, executive, flow, icon, idea, illustration, management, model, numbers, organization, procedure, process. The prominent colors used in the PowerPoint template are Green, Gray, and Black

Four Stages Of Product Journey Map Ppt PowerPoint Presentation Diagram Graph Charts PDF
Presenting this set of slides with name four stages of product journey map ppt powerpoint presentation diagram graph charts pdf. This is a four stage process. The stages in this process are four stages of product journey map. This is a completely editable PowerPoint presentation and is available for immediate download. Download now and impress your audience.
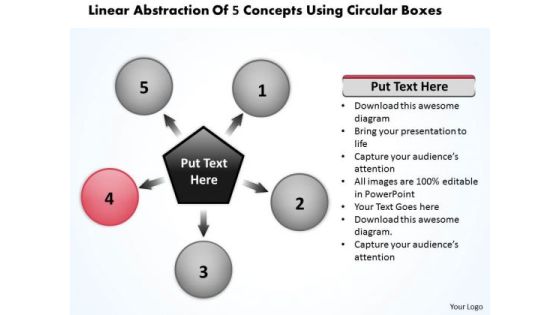
Linear Abstraction Of 5 Concepts Using Circular Boxes Ppt Charts And PowerPoint Slides
We present our linear abstraction of 5 concepts using circular boxes ppt Charts and PowerPoint Slides.Download our Shapes PowerPoint Templates because Our PowerPoint Templates and Slides come in all colours, shades and hues. They help highlight every nuance of your views. Download our Arrows PowerPoint Templates because your group can behave steady in the top bracket. Present our Process and Flows PowerPoint Templates because It can Conjure up grand ideas with our magical PowerPoint Templates and Slides. Leave everyone awestruck by the end of your presentation. Use our Business PowerPoint Templates because you can Lead your flock steadily to greater heights. Look around at the vast potential of achievement around you. Download our Signs PowerPoint Templates because forward thinking is the way to go.Use these PowerPoint slides for presentations relating to Arrow, Blank, Business, Chart, Circle, Circular, Concept, Connection, Copy, Cycle, Development, Diagram, Direction, Element, Flow, Four, Graph, Group, Mapping, Method, Model, Motion, Movement, Numbers, Organization, Pattern, Procedure, Process, Recycle, Redo, Repeat, Repetitive, Report, Resource, Reuse, Ring, Rotate, Rotation, Round, Segment, Sequence, Sequential, Shape, Sign, Space, Step, Strategy, System. The prominent colors used in the PowerPoint template are Red, Gray, Black. Use our linear abstraction of 5 concepts using circular boxes ppt Charts and PowerPoint Slides are Luxuriant. We assure you our Business PowerPoint templates and PPT Slides are Nostalgic. People tell us our linear abstraction of 5 concepts using circular boxes ppt Charts and PowerPoint Slides are designed by professionals PowerPoint presentation experts tell us our Concept PowerPoint templates and PPT Slides are second to none. PowerPoint presentation experts tell us our linear abstraction of 5 concepts using circular boxes ppt Charts and PowerPoint Slides are Precious. Use our Concept PowerPoint templates and PPT Slides are Graceful.
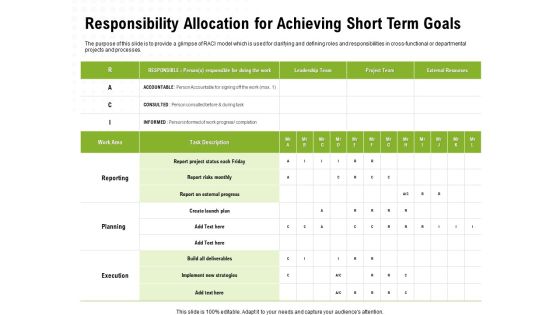
Strategic Growth Technique Responsibility Allocation For Achieving Short Term Goals Ppt Diagram Graph Charts PDF
Presenting this set of slides with name strategic growth technique responsibility allocation for achieving short term goals ppt diagram graph charts pdf. The topics discussed in these slides are implement, strategies, leadership team, external resources. This is a completely editable PowerPoint presentation and is available for immediate download. Download now and impress your audience.
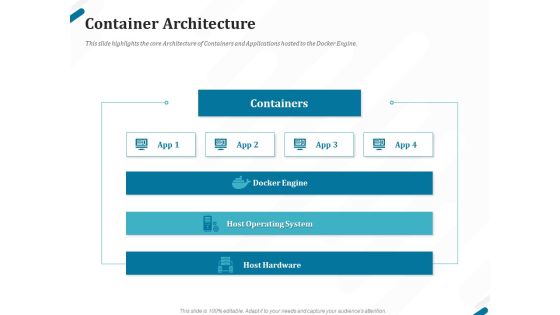
Kubernetes Containers Architecture Overview Container Architecture Ppt Diagram Graph Charts PDF
Presenting this set of slides with name kubernetes containers architecture overview container architecture ppt diagram graph charts pdf. The topics discussed in these slides are containers, docker engine, host operating system, host hardware. This is a completely editable PowerPoint presentation and is available for immediate download. Download now and impress your audience.

New Technology Adoption Curve Charts Ppt PowerPoint Presentation Inspiration Structure PDF
Pitch your topic with ease and precision using this new technology adoption curve charts ppt powerpoint presentation inspiration structure pdf. This layout presents information on new technology, adoption curve, abandonment of current technology. It is also available for immediate download and adjustment. So, changes can be made in the color, design, graphics or any other component to create a unique layout.

Accumbent Illustration Of Puzzle Process Using 8 Stages Flow Charting PowerPoint Slides
We present our accumbent illustration of puzzle process using 8 stages flow charting PowerPoint Slides.Download our Signs PowerPoint Templates because educate your staff on the means to provide the required support for speedy recovery. Use our Process and Flows PowerPoint Templates because your listeners do not have to put on their thinking caps. Use our Leadership PowerPoint Templates because you can Help your viewers automatically emphathise with your thoughts. Present our Shapes PowerPoint Templates because it helps you to get your team in the desired sequence into the bracket. Download our Arrows PowerPoint Templates because you understand how each drives the next to motor the entire sequence.Use these PowerPoint slides for presentations relating to Arrows, art, assess, background, blue, business, campaign, chart, client, clip, clipart, clouds, determine, development, diagram, effectiveness, eps10, goal, graph, graphic, illustration, implement, outcome, process, results, shadow,. The prominent colors used in the PowerPoint template are White, Black, Gray. The feedback we get is that our accumbent illustration of puzzle process using 8 stages flow charting PowerPoint Slides are Bold. People tell us our client PowerPoint templates and PPT Slides look good visually. We assure you our accumbent illustration of puzzle process using 8 stages flow charting PowerPoint Slides are Beautiful. Presenters tell us our campaign PowerPoint templates and PPT Slides are effectively colour coded to prioritise your plans They automatically highlight the sequence of events you desire. We assure you our accumbent illustration of puzzle process using 8 stages flow charting PowerPoint Slides help you meet deadlines which are an element of today's workplace. Just browse and pick the slides that appeal to your intuitive senses. Use our assess PowerPoint templates and PPT Slides are Attractive.
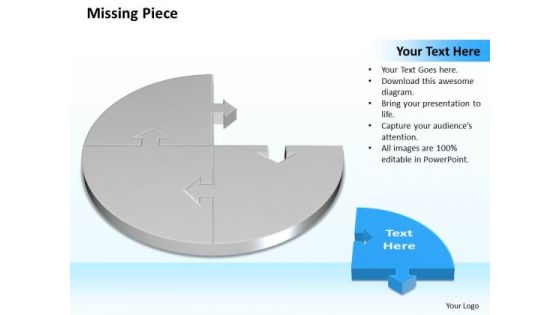
Business Charts PowerPoint Templates 3d Circle Problem Solving Puzzle Piece Showing Missing Diagram
Business Charts PowerPoint templates 3d circle Problem Solving Puzzle Piece showing missing diagram-Use this Business PowerPoint Diagram to explain the missing concept in a process. It shows that if one piece is missing , the puzzle is not complete, in the similar way if in business one
Mail With Cross Symbol Vector Icon Ppt PowerPoint Presentation Diagram Graph Charts PDF
Presenting this set of slides with name mail with cross symbol vector icon ppt powerpoint presentation diagram graph charts pdf. This is a three stage process. The stages in this process are mail with cross symbol vector icon. This is a completely editable PowerPoint presentation and is available for immediate download. Download now and impress your audience.

Agenda SDN Security Architecture Ppt PowerPoint Presentation Diagram Graph Charts PDF
Do you have an important presentation coming up Are you looking for something that will make your presentation stand out from the rest Look no further than Agenda SDN Security Architecture Ppt PowerPoint Presentation Diagram Graph Charts PDF. With our professional designs, you can trust that your presentation will pop and make delivering it a smooth process. And with Slidegeeks, you can trust that your presentation will be unique and memorable. So why wait Grab Agenda SDN Security Architecture Ppt PowerPoint Presentation Diagram Graph Charts PDF today and make your presentation stand out from the rest

Business Charts PowerPoint Templates 4 Steps Planning Circular Direction Diagram Sales
Business Charts PowerPoint templates 4 steps planning circular direction diagram Sales-This Rangoli Based PowerPoint Diagram shows the four step planning process in Circular Manner. It shows four Phases required in any Process related to Business. Use this Fascinating Diagram to make your Presentation delightful.

Classification Of Visual Tools With Electronic Presentation And Flip Charts Ppt PowerPoint Presentation File Display PDF
Presenting this set of slides with name classification of visual tools with electronic presentation and flip charts ppt powerpoint presentation file display pdf. This is a five stage process. The stages in this process are electronic presentations, transparencies, flipcharts. This is a completely editable PowerPoint presentation and is available for immediate download. Download now and impress your audience.

Three Dimensional Games Proposal About Us For 3D Game Proposal Target Ppt Diagram Graph Charts PDF
Presenting this set of slides with name three dimensional games proposal about us for 3d game proposal target ppt diagram graph charts pdf. This is a two stage process. The stages in this process are vision, mission, core values. This is a completely editable PowerPoint presentation and is available for immediate download. Download now and impress your audience.
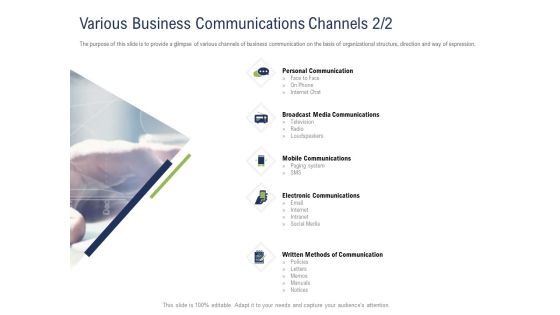
Incremental Decision Making Various Business Communications Channels Media Ppt Diagram Graph Charts PDF
Presenting this set of slides with name incremental decision making various business communications channels media ppt diagram graph charts pdf. This is a five stage process. The stages in this process are communication, broadcast media, mobile, electronic. This is a completely editable PowerPoint presentation and is available for immediate download. Download now and impress your audience.
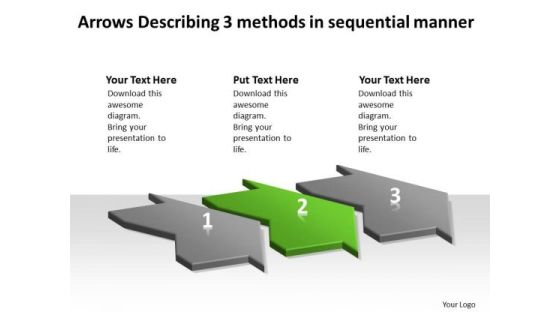
Arrows Describing 3 Methods Sequential Manner Flow Charts Vision PowerPoint Templates
We present our arrows describing 3 methods sequential manner flow charts vision PowerPoint templates.Present our Marketing PowerPoint Templates because they are Designed to attract the attention of your audience. Present our Business PowerPoint Templates because you have selected your team man for man. Download our Process and Flows PowerPoint Templates because you can Highlight the key components of your entire manufacturing/ business process. Use our Shapes PowerPoint Templates because clarity of thought has been the key to your growth. Download and present our Arrows PowerPoint Templates because you have an idea of which you are sure.Use these PowerPoint slides for presentations relating to 3d, Abstract, Around, Arrows, Blue, Border, Business, Center, Circle, Circular, Concept, Connections, Copy, Curve, Cycle, Directions, Distribution, Illustration, Management, Middle, Objects, Pieces, Plan, Pointing, Process, Recycle, Rounded, Shadows, Space, System. The prominent colors used in the PowerPoint template are Green, Gray, Black. People tell us our arrows describing 3 methods sequential manner flow charts vision PowerPoint templates are Wistful. PowerPoint presentation experts tell us our Center PowerPoint templates and PPT Slides are Beautiful. Presenters tell us our arrows describing 3 methods sequential manner flow charts vision PowerPoint templates are Vintage. The feedback we get is that our Arrows PowerPoint templates and PPT Slides are Ultra. You can be sure our arrows describing 3 methods sequential manner flow charts vision PowerPoint templates are One-of-a-kind. Professionals tell us our Circle PowerPoint templates and PPT Slides are Tasteful.
Vertical And Horizontal Org Charts Ppt PowerPoint Presentation Model Icon PDF
Presenting this set of slides with name vertical and horizontal org charts ppt powerpoint presentation model icon pdf. This is a two stage process. The stages in this process are vertical, horizontal. This is a completely editable PowerPoint presentation and is available for immediate download. Download now and impress your audience.

Branches For Visualization Research And Development Google Charts Tool For Data Elements PDF
This slide depicts google charts as the tool for data visualization, which can extract data from various sources, including SQL, databases, google sheets. Do you have an important presentation coming up Are you looking for something that will make your presentation stand out from the rest Look no further than Branches For Visualization Research And Development Google Charts Tool For Data Elements PDF. With our professional designs, you can trust that your presentation will pop and make delivering it a smooth process. And with Slidegeeks, you can trust that your presentation will be unique and memorable. So why wait Grab Branches For Visualization Research And Development Google Charts Tool For Data Elements PDF today and make your presentation stand out from the rest.

PowerPoint Template Horizontal Flow Course Charts Theme Of 5 Stage Diagram Image
We present our PowerPoint template horizontal flow course charts theme of 5 stage diagram Image. Use our Arrows PowerPoint Templates because, getting it done in time is the key to success. Use our Leadership PowerPoint Templates because; Employ the right colors for your brilliant ideas. Use our Process and flows PowerPoint Templates because, Targets: - You have a handle on all the targets, a master of the game, the experienced and consummate juggler. Use our Symbol PowerPoint Templates because, Brainstorming Light Bulbs: - The atmosphere in the workplace is electric. Use our Business PowerPoint Templates because, Marketing Strategy Business Template: - Maximizing sales of your product is the intended destination. Use these PowerPoint slides for presentations relating to Abstract, Arrow, Blank, Business, Chart, Circular, Circulation, Concept, Conceptual, Design, Diagram, Executive, Icon, Idea, Illustration, Linear, Management, Model, Numbers, Organization, Procedure, Process, Progression, Resource, Sequence, Sequential, Stages, Steps, Strategy. The prominent colors used in the PowerPoint template are Green, Gray, and White
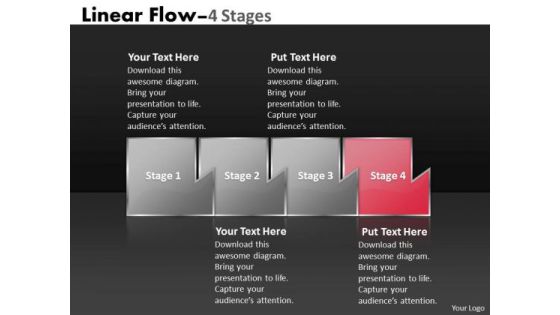
Ppt Theme Mechanism Of Four State Diagram Marketing Linear Flow Activity Charts 5 Graphic
We present our PPT Theme mechanism of four state diagram marketing linear flow activity charts 5 Graphic. Use our Business PowerPoint Templates because, illustrate the means to prevent or control them using our imaginative templates. Use our Shapes PowerPoint Templates because, our cleverly selected background hues are guaranteed to achieve this aim. Use our Design PowerPoint Templates because, the structure of our templates allows you to effectively highlight the key issues concerning the growth of your business. Use our Signs PowerPoint Templates because, have always been a source of inspiration for us all. Use our Process and Flows PowerPoint Templates because; enlighten your peers with the help of our topical templates. Use these PowerPoint slides for presentations relating to abstract, algorithm, arrow, business, chart, connection, design, development, diagram, direction, element, flow, graph, linear, linear diagram, management, organization, plan, process, section, segment, set, sign, solution, strategy, symbol, vector. The prominent colors used in the PowerPoint template are Red, Gray, and Black
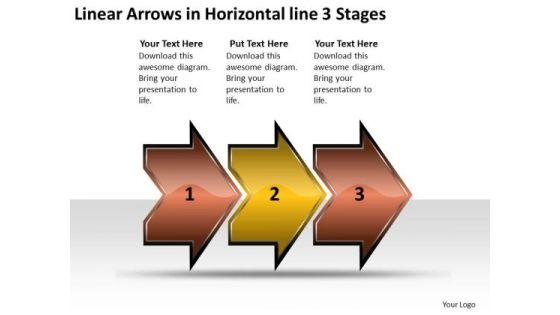
Linear Arrows Horizontal 3 Stages Sample Flow Charts Vision PowerPoint Slides
We present our linear arrows horizontal 3 stages sample flow charts vision PowerPoint Slides.Use our Arrows PowerPoint Templates because,It is Inspired by the indelible Olympic logo this graphic exemplifies the benefits of teamwork. Use our Shapes PowerPoint Templates because,You can blaze a brilliant trail from point to point. Use our Signs PowerPoint Templates because,You have configured your targets, identified your goals as per priority and importance. Use our Business PowerPoint Templates because,Everybody knows The world over it is a priority for many. Along with it there are so many oppurtunities waiting to be utilised Use our Process and Flows PowerPoint Templates because,Clarity of thought has been the key to your growth.Use these PowerPoint slides for presentations relating to abstract, arrow, arrows, business, chart, design, development, diagram, direction, element, flow, flowchart, graph, linear, management, model, motion, organization, plan, process, program, section, segment, set, sign, solution, strategy, symbol, technology. The prominent colors used in the PowerPoint template are Brown, Yellow, Black. People tell us our linear arrows horizontal 3 stages sample flow charts vision PowerPoint Slides are the best it can get when it comes to presenting. The feedback we get is that our arrows PowerPoint templates and PPT Slides provide you with a vast range of viable options. Select the appropriate ones and just fill in your text. People tell us our linear arrows horizontal 3 stages sample flow charts vision PowerPoint Slides are Ritzy. Presenters tell us our business PowerPoint templates and PPT Slides will make the presenter look like a pro even if they are not computer savvy. The feedback we get is that our linear arrows horizontal 3 stages sample flow charts vision PowerPoint Slides are Multicolored. Professionals tell us our design PowerPoint templates and PPT Slides are Elevated.
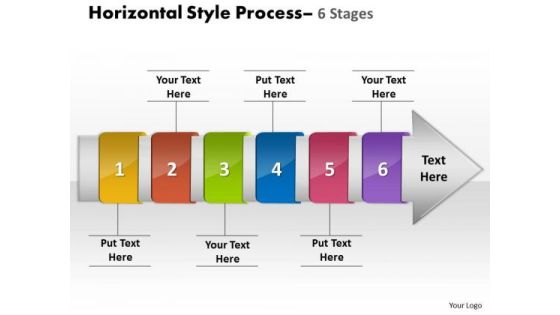
Ppt Template Horizontal Flow Route Charts Of 6 Stage Diagram PowerPoint Free 1 Image
We present our PPT template horizontal flow route charts of 6 stage diagram PowerPoint free 1 Image. Use our Leadership PowerPoint Templates because, There are different paths to gain the necessary knowledge to achieve it. Use our Business PowerPoint Templates because, Corporate Ladder:- The graphic is a symbol of growth and success. Use our Process and Flows PowerPoint Templates because, designed to attract the attention of your audience. Use our Arrows PowerPoint Templates because, are the triggers of our growth. Use our Symbol PowerPoint Templates because; Use them to help you organize the logic of your views. Use these PowerPoint slides for presentations relating to Abstract, Arrow, Blank, Business, Chart, Circular, Circulation, Concept, Conceptual, Design, Diagram, Executive, Icon, Idea, Illustration, Linear, Stages, Management, Model, Numbers, Organization, Procedure, Process, Progression, Resource, Sequence, Sequential, Stages, Steps, Strategy. The prominent colors used in the PowerPoint template are Yellow, Red, and Green

Organizational Process Flow For Customer On Boarding Ppt PowerPoint Presentation Diagram Graph Charts PDF
Persuade your audience using this organizational process flow for customer on boarding ppt powerpoint presentation diagram graph charts pdf. This PPT design covers one stages, thus making it a great tool to use. It also caters to a variety of topics including service menu, project charter, conduct meeting, initial meeting with agenda, registration from filing by client, approve. Download this PPT design now to present a convincing pitch that not only emphasizes the topic but also showcases your presentation skills.

7 Stages Diverging Arrows Schematic Diagram Ppt Charts And Networks PowerPoint Slides
We present our 7 stages diverging arrows schematic diagram ppt Charts and Networks PowerPoint Slides.Download our Marketing PowerPoint Templates because Our PowerPoint Templates and Slides are Clear and concise. Use them and dispel any doubts your team may have. Download and present our Shapes PowerPoint Templates because You can Connect the dots. Fan expectations as the whole picture emerges. Present our Arrows PowerPoint Templates because this Slide offers an excellent background to build up the various stages of your business process. Use our Business PowerPoint Templates because you have analysed many global markets and come up with possibilities. Highlight the pros and cons of other likely business oppurtunities. Download and present our Process and Flows PowerPoint Templates because spreading the light of knowledge around you will clear the doubts and enlighten the questioning minds with your brilliance and ability.Use these PowerPoint slides for presentations relating to Arrows, Business, Chart, Cyclic, Data, Diagram, Financial, Goal, Graph, Illustration, Info, Information, Marketing, Model, Option, Part, Pie, Presentation, Process, Result, Sphere, Statistics. The prominent colors used in the PowerPoint template are Yellow, Gray, Black. The feedback we get is that our 7 stages diverging arrows schematic diagram ppt Charts and Networks PowerPoint Slides are Breathtaking. People tell us our Graph PowerPoint templates and PPT Slides are Splendid. Presenters tell us our 7 stages diverging arrows schematic diagram ppt Charts and Networks PowerPoint Slides are Functional. Use our Graph PowerPoint templates and PPT Slides will make the presenter successul in his career/life. Use our 7 stages diverging arrows schematic diagram ppt Charts and Networks PowerPoint Slides are visually appealing. Use our Graph PowerPoint templates and PPT Slides are Dynamic.
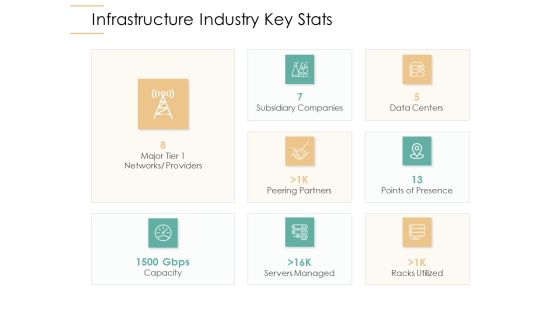
Infrastructure Strategies Infrastructure Industry Key Stats Ppt Diagram Graph Charts PDF
Deliver and pitch your topic in the best possible manner with this infrastructure strategies infrastructure industry key stats ppt diagram graph charts pdf. Use them to share invaluable insights on capacity, servers managed, racks utilized, peering partners, points of presence and impress your audience. This template can be altered and modified as per your expectations. So, grab it now.

3d Straight Description To Prevent Business Losses Eight Steps Flow Charts PowerPoint Slides
We present our 3d straight description to prevent business losses eight steps flow charts PowerPoint Slides.Use our Arrows PowerPoint Templates because,the gears of youthful minds are useful, therefore set them in motion. Use our Shapes PowerPoint Templates because,This one depicts the popular chart. Use our Signs PowerPoint Templates because,You are aware of some pitfalls ahead where you need to be cautious not to overrun and avoid a stall. Use our Business PowerPoint Templates because, You can see clearly through to the bigger bowl ahead. Time your jump to perfection and hit the nail on the head Use our Process and Flows PowerPoint Templates because,There is a vision, a need you can meet.Use these PowerPoint slides for presentations relating to advance, aiming, arrow, arrowhead, back, balance, communication, connect, connection, descriptive, design, direct, direction, forward, graphic, icon, illustration, information, internet, join, journey, language, left, multimedia, page, pointer, reflect, set, shape, sign, straight, symbol, together, top, transportation, vector. The prominent colors used in the PowerPoint template are Green, Yellow, Black. People tell us our 3d straight description to prevent business losses eight steps flow charts PowerPoint Slides will help them to explain complicated concepts. The feedback we get is that our arrowhead PowerPoint templates and PPT Slides will help you be quick off the draw. Just enter your specific text and see your points hit home. People tell us our 3d straight description to prevent business losses eight steps flow charts PowerPoint Slides are Breathtaking. Presenters tell us our arrowhead PowerPoint templates and PPT Slides are designed by a team of presentation professionals. The feedback we get is that our 3d straight description to prevent business losses eight steps flow charts PowerPoint Slides are Elevated. Professionals tell us our back PowerPoint templates and PPT Slides are Efficacious.

Difference Between Artificial And Augmented Intelligence Ppt PowerPoint Presentation Diagram Graph Charts PDF
This slide outlines the difference between augmented and artificial intelligence based on the factors such as the need of humans, approach, mode focus, and decision making. Here you can discover an assortment of the finest PowerPoint and Google Slides templates. With these templates, you can create presentations for a variety of purposes while simultaneously providing your audience with an eye catching visual experience. Download Difference Between Artificial And Augmented Intelligence Ppt PowerPoint Presentation Diagram Graph Charts PDF to deliver an impeccable presentation. These templates will make your job of preparing presentations much quicker, yet still, maintain a high level of quality. Slidegeeks has experienced researchers who prepare these templates and write high quality content for you. Later on, you can personalize the content by editing the Difference Between Artificial And Augmented Intelligence Ppt PowerPoint Presentation Diagram Graph Charts PDF.

Hands Emphasizing 7 Stages Process Business Work Flow Charts PowerPoint Slides
We present our hands emphasizing 7 stages process business work flow charts PowerPoint Slides. Use our Advertising PowerPoint Templates because, Will surely see the all making the grade. Use our Shapes PowerPoint Templates because, creating a winner is your passion and dream. Use our Targets PowerPoint Templates because, you have the people in place, selected the team leaders and all are raring to go. Use our Process and Flows PowerPoint Templates because, are the triggers of our growth. Use our Signs PowerPoint Templates because, Start the gears of youthful minds and set them in motion. Use these PowerPoint slides for presentations relating to Adult, alone, arranging, background, child, dirty, empty, family, handprint, hands, human, identity, illustration, isolated, love, messy, naked, objects, paint, painting, palm, set, shape, simple, stage, stained, stamp, toe, togetherness. The prominent colors used in the PowerPoint template are Green, Gray, and White
