Score Meter
Financial Performance Indicators Healthcare Ppt PowerPoint Presentation Pictures Designs Cpb Pdf
Presenting this set of slides with name financial performance indicators healthcare ppt powerpoint presentation pictures designs cpb pdf. This is an editable Powerpoint four stages graphic that deals with topics like financial performance indicators healthcare to help convey your message better graphically. This product is a premium product available for immediate download and is 100 percent editable in Powerpoint. Download this now and use it in your presentations to impress your audience.
Small Business Economic Indicators Ppt PowerPoint Presentation Show Inspiration Cpb Pdf
Presenting this set of slides with name small business economic indicators ppt powerpoint presentation show inspiration cpb pdf. This is an editable Powerpoint six stages graphic that deals with topics like small business economic indicators to help convey your message better graphically. This product is a premium product available for immediate download and is 100 percent editable in Powerpoint. Download this now and use it in your presentations to impress your audience.
Key Performance Indicators Examples Sales Ppt PowerPoint Presentation File Example Cpb Pdf
Presenting this set of slides with name key performance indicators examples sales ppt powerpoint presentation file example cpb pdf. This is an editable Powerpoint eight stages graphic that deals with topics like key performance indicators examples sales to help convey your message better graphically. This product is a premium product available for immediate download and is 100 percent editable in Powerpoint. Download this now and use it in your presentations to impress your audience.
Five Performance Indicators Measure Health Systems Ppt PowerPoint Presentation Gallery Templates Cpb Pdf
Presenting this set of slides with name five performance indicators measure health systems ppt powerpoint presentation gallery templates cpb pdf. This is an editable Powerpoint five stages graphic that deals with topics like five performance indicators measure health systems to help convey your message better graphically. This product is a premium product available for immediate download and is 100 percent editable in Powerpoint. Download this now and use it in your presentations to impress your audience.

Matrix Capturing Quality Indicators Ppt PowerPoint Presentation Ideas Professional Cpb Pdf
Presenting this set of slides with name matrix capturing quality indicators ppt powerpoint presentation ideas professional cpb pdf. This is an editable Powerpoint four stages graphic that deals with topics like matrix capturing quality indicators to help convey your message better graphically. This product is a premium product available for immediate download and is 100 percent editable in Powerpoint. Download this now and use it in your presentations to impress your audience.
Key Performance Indicators Quality Assurance Examples Ppt PowerPoint Presentation Gallery Examples Cpb Pdf
Presenting this set of slides with name key performance indicators quality assurance examples ppt powerpoint presentation gallery examples cpb pdf. This is an editable Powerpoint five stages graphic that deals with topics like key performance indicators quality assurance examples to help convey your message better graphically. This product is a premium product available for immediate download and is 100 percent editable in Powerpoint. Download this now and use it in your presentations to impress your audience.
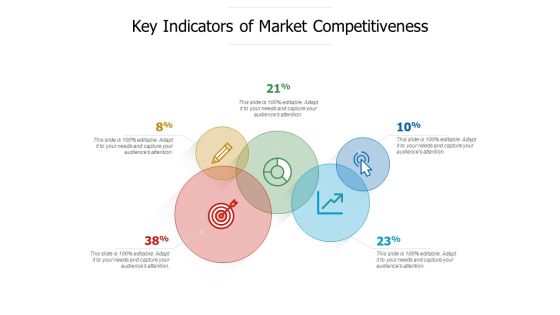
Key Indicators Of Market Competitiveness Ppt PowerPoint Presentation File Templates PDF
Persuade your audience using this key indicators of market competitiveness ppt powerpoint presentation file templates pdf. This PPT design covers five stages, thus making it a great tool to use. It also caters to a variety of topics including key indicators of market competitiveness. Download this PPT design now to present a convincing pitch that not only emphasizes the topic but also showcases your presentation skills.
Financial Risk Indicator With Threat Symbol Vector Icon Ppt PowerPoint Presentation Summary PDF
Persuade your audience using this financial risk indicator with threat symbol vector icon ppt powerpoint presentation summary pdf. This PPT design covers three stages, thus making it a great tool to use. It also caters to a variety of topics including financial risk indicator with threat symbol vector icon. Download this PPT design now to present a convincing pitch that not only emphasizes the topic but also showcases your presentation skills.

Company Financial Performance Indicators Cash Balance Icon Ppt Pictures Ideas PDF
Persuade your audience using this Company Financial Performance Indicators Cash Balance Icon Ppt Pictures Ideas PDF. This PPT design covers three stages, thus making it a great tool to use. It also caters to a variety of topics including Company Financial, Performance Indicators, Cash Balance, Icon. Download this PPT design now to present a convincing pitch that not only emphasizes the topic but also showcases your presentation skills.

Software Company Quarterly Investment Indicators Financial Performance Report Of Software Firm Professional PDF
The slide illustrates the investment indicators of software company for four quarters of last three financial years. The indicators included are book value per share, return on assets, return on equity, return on capital employed, and total debt to total equity. Are you in need of a template that can accommodate all of your creative concepts This one is crafted professionally and can be altered to fit any style. Use it with Google Slides or PowerPoint. Include striking photographs, symbols, depictions, and other visuals. Fill, move around, or remove text boxes as desired. Test out color palettes and font mixtures. Edit and save your work, or work with colleagues. Download Software Company Quarterly Investment Indicators Financial Performance Report Of Software Firm Professional PDF and observe how to make your presentation outstanding. Give an impeccable presentation to your group and make your presentation unforgettable.

Classified Data Memo Record With Strategic Goals Key Performance Indicators Of The Company Guidelines PDF
This slide provides information about the key performance indicators of the company for 5 years in terms of turnover, gross profit, operating profit margin etc. This is a classified data memo record with strategic goals key performance indicators of the company guidelines pdf template with various stages. Focus and dispense information on five stages using this creative set, that comes with editable features. It contains large content boxes to add your information on topics like turnover, gross profit, gross profit margin, operating profit, operating profit margin. You can also showcase facts, figures, and other relevant content using this PPT layout. Grab it now.

Data Analytics Planning With Key Performance Indicators Ppt PowerPoint Presentation Icon Infographic Template PDF
Presenting data analytics planning with key performance indicators ppt powerpoint presentation icon infographic template pdf to dispense important information. This template comprises four stages. It also presents valuable insights into the topics including performance, business, strategy. This is a completely customizable PowerPoint theme that can be put to use immediately. So, download it and address the topic impactfully.
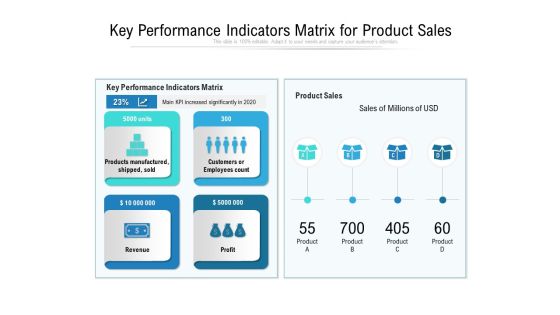
Key Performance Indicators Matrix For Product Sales Ppt PowerPoint Presentation File Clipart PDF
Presenting key performance indicators matrix for product sales ppt powerpoint presentation file clipart pdf to dispense important information. This template comprises four stages. It also presents valuable insights into the topics including manufactured, revenue, performance. This is a completely customizable PowerPoint theme that can be put to use immediately. So, download it and address the topic impactfully.

Techniques To Implement Performance Indicators For Effective Traditional Marketing Slides PDF
This slide showcases key metrics of traditional media for marketers. Major indicators covered are cost per lead, customer retention, marketing ROI. Sales revenue, customer lifetime value and website traffic. Are you in need of a template that can accommodate all of your creative concepts This one is crafted professionally and can be altered to fit any style. Use it with Google Slides or PowerPoint. Include striking photographs, symbols, depictions, and other visuals. Fill, move around, or remove text boxes as desired. Test out color palettes and font mixtures. Edit and save your work, or work with colleagues. Download Techniques To Implement Performance Indicators For Effective Traditional Marketing Slides PDF and observe how to make your presentation outstanding. Give an impeccable presentation to your group and make your presentation unforgettable.
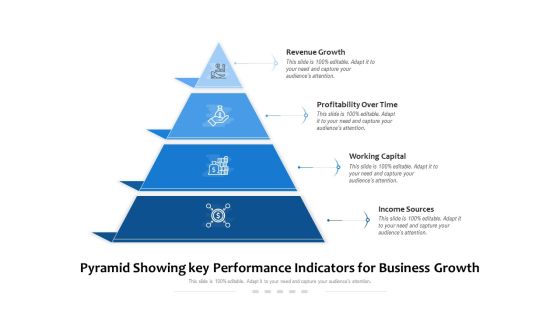
Pyramid Showing Key Performance Indicators For Business Growth Ppt PowerPoint Presentation Layouts Introduction PDF
Persuade your audience using this pyramid showing key performance indicators for business growth ppt powerpoint presentation layouts introduction pdf. This PPT design covers four stages, thus making it a great tool to use. It also caters to a variety of topics including revenue growth, profitability over time, working capital, income sources. Download this PPT design now to present a convincing pitch that not only emphasizes the topic but also showcases your presentation skills.
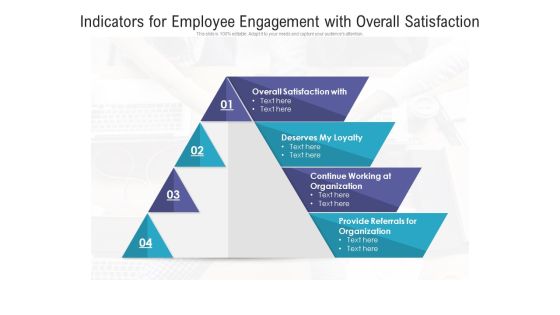
Indicators For Employee Engagement With Overall Satisfaction Ppt PowerPoint Presentation File Visuals PDF
Persuade your audience using this indicators for employee engagement with overall satisfaction ppt powerpoint presentation file visuals pdf. This PPT design covers four stages, thus making it a great tool to use. It also caters to a variety of topics including organization, deserves, loyalty. Download this PPT design now to present a convincing pitch that not only emphasizes the topic but also showcases your presentation skills.
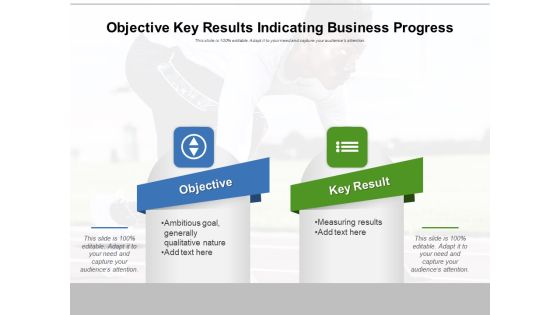
Objective Key Results Indicating Business Progress Ppt PowerPoint Presentation Gallery Shapes PDF
Persuade your audience using this objective key results indicating business progress ppt powerpoint presentation gallery shapes pdf. This PPT design covers two stages, thus making it a great tool to use. It also caters to a variety of topics including objective, key result. Download this PPT design now to present a convincing pitch that not only emphasizes the topic but also showcases your presentation skills.
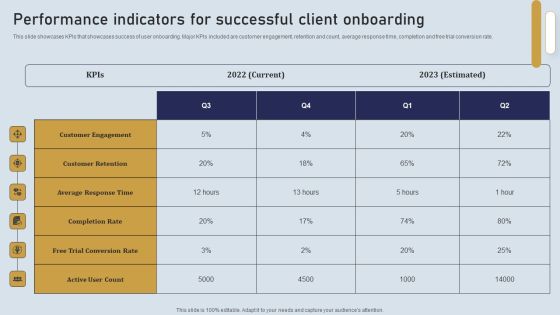
Onboarding Journey For Effective Client Communication Performance Indicators Successful Client Summary PDF
This slide showcases KPIs that showcases success of user onboarding. Major KPIs included are customer engagement, retention and count, average response time, completion and free trial conversion rate. Are you in need of a template that can accommodate all of your creative concepts This one is crafted professionally and can be altered to fit any style. Use it with Google Slides or PowerPoint. Include striking photographs, symbols, depictions, and other visuals. Fill, move around, or remove text boxes as desired. Test out color palettes and font mixtures. Edit and save your work, or work with colleagues. Download Onboarding Journey For Effective Client Communication Performance Indicators Successful Client Summary PDF and observe how to make your presentation outstanding. Give an impeccable presentation to your group and make your presentation unforgettable.

Automated Government Procedures E Governance Website Portal Kpis Portrait PDF
This slide covers the Key performance indicators for analysing social media platforms, email campaigns and website performance. Presenting automated government procedures e governance website portal kpis portrait pdf to provide visual cues and insights. Share and navigate important information on seven stages that need your due attention. This template can be used to pitch topics like e governance website or portal kpis. In addition, this PPT design contains high-resolution images, graphics, etc, that are easily editable and available for immediate download.

Current HR Service Delivery System Efficiency Indicators In The Company Ppt PowerPoint Presentation File Deck PDF
This slide shows the current HR Service Delivery System Efficiency Indicators of the company that are compared for 3 years. Some indicators are self service resolution rate, training effectiveness status, performance of new hires, SLA achievement rate, employee satisfaction rate etc. If you are looking for a format to display your unique thoughts, then the professionally designed Current HR Service Delivery System Efficiency Indicators In The Company Ppt PowerPoint Presentation File Deck PDF is the one for you. You can use it as a Google Slides template or a PowerPoint template. Incorporate impressive visuals, symbols, images, and other charts. Modify or reorganize the text boxes as you desire. Experiment with shade schemes and font pairings. Alter, share or cooperate with other people on your work. Download Current HR Service Delivery System Efficiency Indicators In The Company Ppt PowerPoint Presentation File Deck PDF and find out how to give a successful presentation. Present a perfect display to your team and make your presentation unforgettable.

Flowchart Indicating Legacy Cloud Platform Migration To Cloud Platform Sample PDF
This slide shows steps of legacy application migration to new platform which contains environmental analysis, environment assessment, selecting tactic, final migration and evaluating resources. It can benefit users who are looking to move to more immersive and user-friendly platforms like cloud.Presenting Flowchart Indicating Legacy Cloud Platform Migration To Cloud Platform Sample PDF to dispense important information. This template comprises six stages. It also presents valuable insights into the topics including Plan Phase, Design Phase, Work Products. This is a completely customizable PowerPoint theme that can be put to use immediately. So, download it and address the topic impactfully.

Commercial Model Indicating Sales And Marketing Techniques Ppt File Maker PDF
This slide showcases commercial framework which can be ideal for sales and marketing techniques to comply their current resources with new techniques. It includes information about customer, market approach, work, staff, deployment, etc. Persuade your audience using this Commercial Model Indicating Sales And Marketing Techniques Ppt File Maker PDF. This PPT design covers five stages, thus making it a great tool to use. It also caters to a variety of topics including Customers, Approach Market, Market Strategy . Download this PPT design now to present a convincing pitch that not only emphasizes the topic but also showcases your presentation skills.
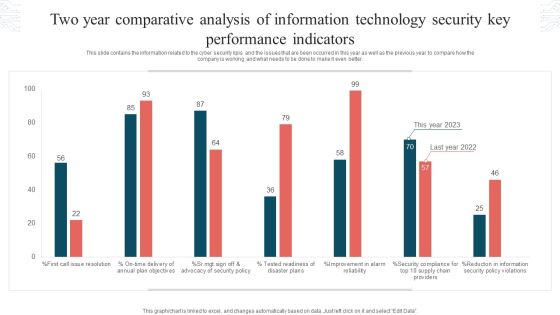
Two Year Comparative Analysis Of Information Technology Security Key Performance Indicators Graphics PDF
This slide contains the information related to the cyber security kpis and the issues that are been occurred in this year as well as the previous year to compare how the company is working and what needs to be done to make it even better. Showcasing this set of slides titled Two Year Comparative Analysis Of Information Technology Security Key Performance Indicators Graphics PDF. The topics addressed in these templates are Tested Readiness, Disaster Plans, Security Policy Violations. All the content presented in this PPT design is completely editable. Download it and make adjustments in color, background, font etc. as per your unique business setting.

Data Processing Services Delivery Prevent Future Calls Ppt Inspiration Clipart Images PDF
This slide depicts how we can prevent the future calls or repetitive calls by working on the areas of improvement based on the trends or analytics. Deliver an awe inspiring pitch with this creative Data Processing Services Delivery Prevent Future Calls Ppt Inspiration Clipart Images PDF bundle. Topics like Service Level, Abandoned, Incoming Calls Gauge, Total Calls Count can be discussed with this completely editable template. It is available for immediate download depending on the needs and requirements of the user.
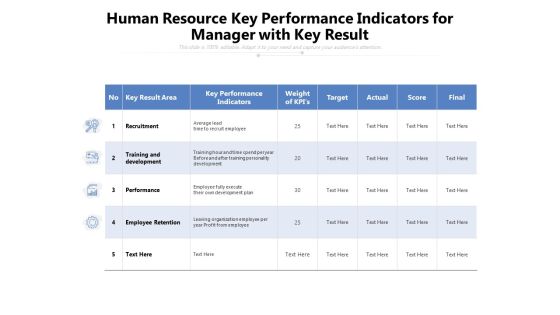
Human Resource Key Performance Indicators For Manager With Key Result Ppt PowerPoint Presentation File Graphics Tutorials PDF
Pitch your topic with ease and precision using this human resource key performance indicators for manager with key result ppt powerpoint presentation file graphics tutorials pdf. This layout presents information on training, development, performance. It is also available for immediate download and adjustment. So, changes can be made in the color, design, graphics or any other component to create a unique layout.

Best Practices To Improve Vendor Management Strategy Effective Vendor Management For Enhancing Themes PDF
This slide showcases best practices to enhance supplier management strategy. It provides information about requirements, expectations, deadlines, collaboration, key performance indicators KPIs, vendor risk assessment, etc. Find highly impressive Best Practices To Improve Vendor Management Strategy Effective Vendor Management For Enhancing Themes PDF on Slidegeeks to deliver a meaningful presentation. You can save an ample amount of time using these presentation templates. No need to worry to prepare everything from scratch because Slidegeeks experts have already done a huge research and work for you. You need to download Best Practices To Improve Vendor Management Strategy Effective Vendor Management For Enhancing Themes PDF for your upcoming presentation. All the presentation templates are 100 parcent editable and you can change the color and personalize the content accordingly. Download now
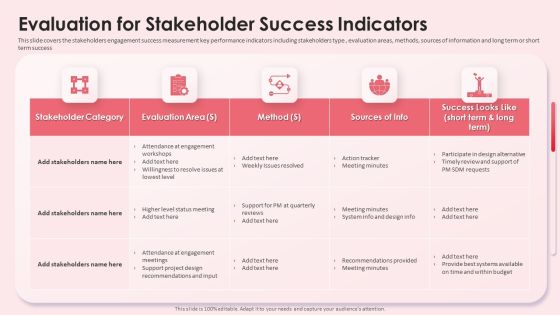
Evaluation For Stakeholder Success Indicators Impact Shareholder Decisions With Stakeholder Administration Clipart PDF
This slide covers the stakeholders engagement success measurement key performance indicators including stakeholders type , evaluation areas, methods, sources of information and long term or short term success. If you are looking for a format to display your unique thoughts, then the professionally designed Evaluation For Stakeholder Success Indicators Impact Shareholder Decisions With Stakeholder Administration Clipart PDF is the one for you. You can use it as a Google Slides template or a PowerPoint template. Incorporate impressive visuals, symbols, images, and other charts. Modify or reorganize the text boxes as you desire. Experiment with shade schemes and font pairings. Alter, share or cooperate with other people on your work. Download Evaluation For Stakeholder Success Indicators Impact Shareholder Decisions With Stakeholder Administration Clipart PDF and find out how to give a successful presentation. Present a perfect display to your team and make your presentation unforgettable.

Best Practices For Effective Yearly Operations Plan Portrait PDF
The slide showcases best practices for developing an annual operations plan. It covers start with a strategic plan, focus on priorities , use leading instead of lagging indicators, KPIs should not be created in a vacuum and communication is paramount. Persuade your audience using this Best Practices For Effective Yearly Operations Plan Portrait PDF. This PPT design covers four stages, thus making it a great tool to use. It also caters to a variety of topics including Strategic Plan, Focus On Priorities, Communication Is Paramount. Download this PPT design now to present a convincing pitch that not only emphasizes the topic but also showcases your presentation skills.

Procurement Analysis Work Plan Designs PDF
This slide covers the procurement analysis work plan including activities, responsibilities, time frame and performance indicators etc. Deliver an awe inspiring pitch with this creative Procurement Analysis Work Plan Designs PDF bundle. Topics like Processing Information, Information Processed, Strategic Public can be discussed with this completely editable template. It is available for immediate download depending on the needs and requirements of the user.

Best Practices For Increasing Lead Conversion Rates Sales Operations Strategy Scorecard Ppt Model Rules PDF
Presenting this set of slides with name best practices for increasing lead conversion rates sales operations strategy scorecard ppt model rules pdf. The topics discussed in these slides are objective, programs, initiatives, actions, key performance indicators and metrics, target timeframe to achieve goals. This is a completely editable PowerPoint presentation and is available for immediate download. Download now and impress your audience.
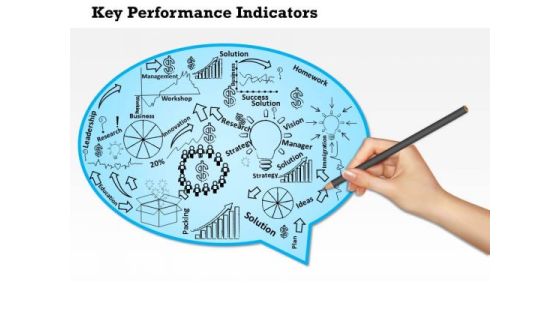
Business Diagram Key Performance Indicators Of A Company PowerPoint Ppt Presentation
Our above diagram provides framework of key performance indicators for a company. This slide contains human hand drawing some objects for terms like innovation strategy, research, solution, management and leadership. Download this diagram to make professional presentations.

Customer And Staff Training Leading And Lagging Indicators Goals Clipart PDF
This slide showcase the lagging and leading performance indicators in order to achieve objective of customer satisfaction and managing internal process. It includes customer service training,development of video tutorials, training time period etc. Showcasing this set of slides titled Customer And Staff Training Leading And Lagging Indicators Goals Clipart PDF. The topics addressed in these templates are Customer And Staff, Training Leading, Lagging Indicators Goals. All the content presented in this PPT design is completely editable. Download it and make adjustments in color, background, font etc. as per your unique business setting.

Case Competition Reduction In Existing Customer Of Telecommunication Company Table Of Content Indicators Ppt Model Example File PDF
Deliver an awe inspiring pitch with this creative case competition reduction in existing customer of telecommunication company table of content indicators ppt model example file pdf bundle. Topics like expansion strategy, technological strategy, promotional strategy, key performance indicators, strategy implementation timeline can be discussed with this completely editable template. It is available for immediate download depending on the needs and requirements of the user.

Market Evaluation Of IT Industry Key Performance Indicators To Track Marketing Campaign Performance Slides PDF
The following slide showcases various metrics through which marketers can measure the success of marketing campaign performance on social media platforms such as Facebook, Instagram, LinkedIn etc. The KPIs are followers, engagement rate, posting frequency, shares, and profile impressions. If you are looking for a format to display your unique thoughts, then the professionally designed Market Evaluation Of IT Industry Key Performance Indicators To Track Marketing Campaign Performance Slides PDF is the one for you. You can use it as a Google Slides template or a PowerPoint template. Incorporate impressive visuals, symbols, images, and other charts. Modify or reorganize the text boxes as you desire. Experiment with shade schemes and font pairings. Alter, share or cooperate with other people on your work. Download Market Evaluation Of IT Industry Key Performance Indicators To Track Marketing Campaign Performance Slides PDF and find out how to give a successful presentation. Present a perfect display to your team and make your presentation unforgettable.
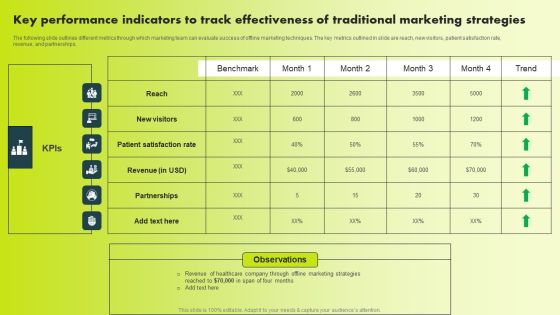
Key Performance Indicators To Track Effectiveness Of Traditional Marketing Strategies Demonstration PDF
The following slide outlines different metrics through which marketing team can evaluate success of offline marketing techniques. The key metrics outlined in slide are reach, new visitors, patient satisfaction rate, revenue, and partnerships. Find highly impressive Key Performance Indicators To Track Effectiveness Of Traditional Marketing Strategies Demonstration PDF on Slidegeeks to deliver a meaningful presentation. You can save an ample amount of time using these presentation templates. No need to worry to prepare everything from scratch because Slidegeeks experts have already done a huge research and work for you. You need to download Key Performance Indicators To Track Effectiveness Of Traditional Marketing Strategies Demonstration PDF for your upcoming presentation. All the presentation templates are 100 percent editable and you can change the color and personalize the content accordingly. Download now
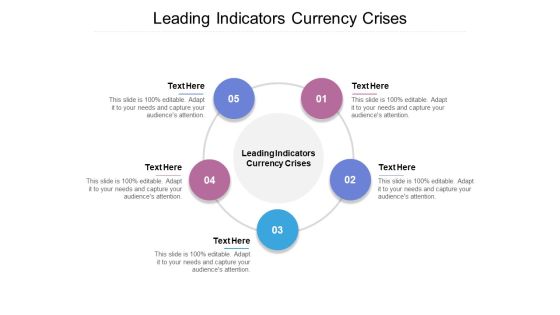
Leading Indicators Currency Crises Ppt PowerPoint Presentation File Background Designs Cpb
Presenting this set of slides with name latest multi level marketing ppt powerpoint presentation layouts display cpb. This is an editable Powerpoint four stages graphic that deals with topics like latest multi level marketing to help convey your message better graphically. This product is a premium product available for immediate download and is 100 percent editable in Powerpoint. Download this now and use it in your presentations to impress your audience.
Employee Talent Management Procedure Tracking Dashboard With Kpis Download PDF
This slide represents dashboard of the human resource department for tracking the performance and management of organizations workforce. It includes details related to monthly new hires, total active employees, suite people metrics along with key performance indicators. Showcasing this set of slides titled Employee Talent Management Procedure Tracking Dashboard With Kpis Download PDF. The topics addressed in these templates are Total Active Employees, Employees, Suite People Metrics. All the content presented in this PPT design is completely editable. Download it and make adjustments in color, background, font etc. as per your unique business setting.

Reaching Business Goals Performance Indicator Ppt PowerPoint Presentation Pictures Infographic Template
This is a reaching business goals performance indicator ppt powerpoint presentation pictures infographic template. This is a one stage process. The stages in this process are sales objectives, sales goal, achieving sales target.

Key Performance Indicator Analytics Dashboard Ppt PowerPoint Presentation Model Example Topics
This is a key performance indicator analytics dashboard ppt powerpoint presentation model example topics. This is a five stage process. The stages in this process are kpi proposal, kpi plan, kpi scheme.
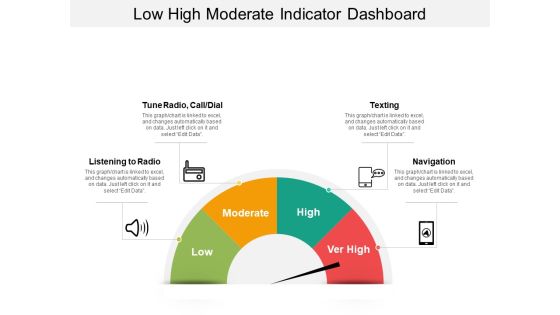
Low High Moderate Indicator Dashboard Ppt Powerpoint Presentation Infographic Template Example 2015
This is a low high moderate indicator dashboard ppt powerpoint presentation infographic template example 2015. This is a four stage process. The stages in this process are disturbance, distraction, interruption, diversion.
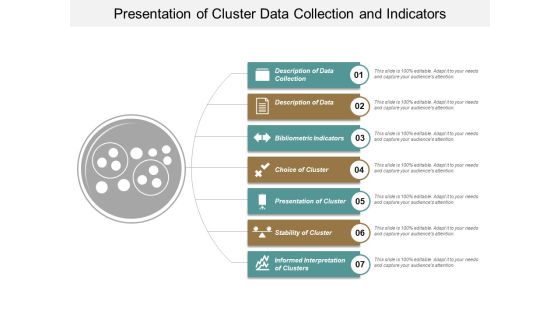
Presentation Of Cluster Data Collection And Indicators Ppt PowerPoint Presentation Model Structure
This is a presentation of cluster data collection and indicators ppt powerpoint presentation model structure. This is a seven stage process. The stages in this process are cluster analysis, cluster examination, cluster investigation.
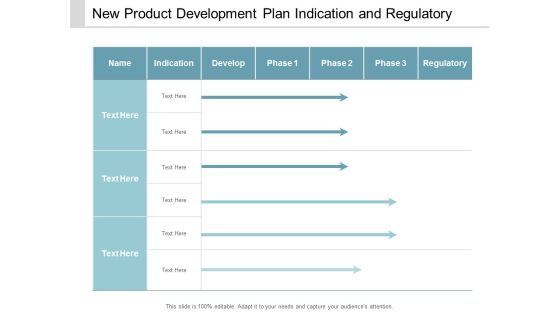
New Product Development Plan Indication And Regulatory Ppt Powerpoint Presentation Ideas Design Ideas
This is a new product development plan indication and regulatory ppt powerpoint presentation ideas design ideas. This is a three stage process. The stages in this process are product development pipeline, product development line, product development channel.
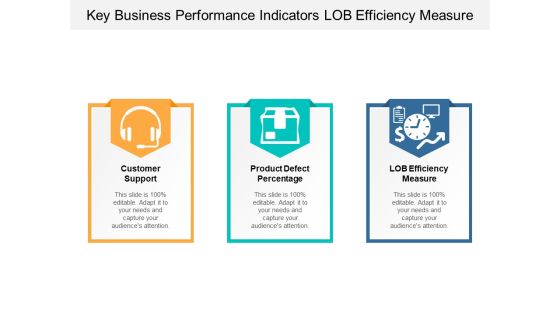
Key Business Performance Indicators Lob Efficiency Measure Ppt Powerpoint Presentation Infographics File Formats
This is a key business performance indicators lob efficiency measure ppt powerpoint presentation infographics file formats. This is a three stage process. The stages in this process are dashboard, kpi, metrics.
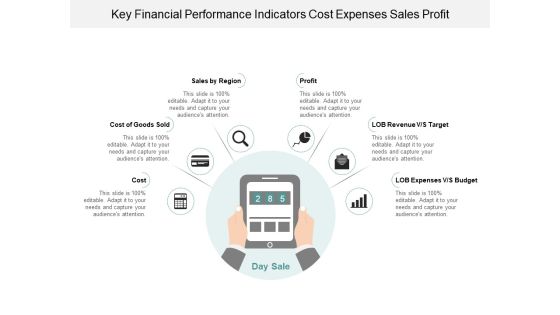
Key Financial Performance Indicators Cost Expenses Sales Profit Ppt Powerpoint Presentation Infographic Template Graphic Images
This is a key financial performance indicators cost expenses sales profit ppt powerpoint presentation infographic template graphic images. This is a six stage process. The stages in this process are dashboard, kpi, metrics.
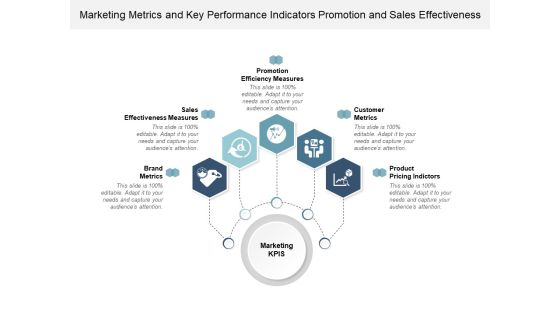
Marketing Metrics And Key Performance Indicators Promotion And Sales Effectiveness Ppt Powerpoint Presentation Infographics Graphics Example
This is a marketing metrics and key performance indicators promotion and sales effectiveness ppt powerpoint presentation infographics graphics example. This is a five stage process. The stages in this process are dashboard, kpi, metrics.
Performance Indicators Of Business Icons Ppt Powerpoint Presentation Infographics Graphics Template
This is a performance indicators of business icons ppt powerpoint presentation infographics graphics template. This is a four stage process. The stages in this process are dashboard, kpi, metrics.

Profitability Key Performance Indicators Financial Activities Cash Flow Ppt Powerpoint Presentation Portfolio Clipart Images
This is a profitability key performance indicators financial activities cash flow ppt powerpoint presentation portfolio clipart images. This is a five stage process. The stages in this process are dashboard, kpi, metrics.
Ten Examples Of Key Performance Indicators Ppt Powerpoint Presentation Layouts Professional
This is a ten examples of key performance indicators ppt powerpoint presentation layouts professional. This is a ten stage process. The stages in this process are dashboard, kpi, metrics.

Data Statistics Charts And Key Performance Indicators Ppt Powerpoint Presentation Layouts Guide
This is a data statistics charts and key performance indicators ppt powerpoint presentation layouts guide. This is a four stage process. The stages in this process are business metrics, business kpi, business dashboard.

Availability Key Performance Indicator Inventory Turnover Ratio Ppt Powerpoint Presentation Layouts Graphics Download
This is a availability key performance indicator inventory turnover ratio ppt powerpoint presentation layouts graphics download. This is a two stage process. The stages in this process are availability kpi, availability dashboard, availability metrics.

Key Performance Indicators In Supply Chain Order Accuracy And Cycle Time Ppt PowerPoint Presentation Infographics Slideshow
This is a key performance indicators in supply chain order accuracy and cycle time ppt powerpoint presentation infographics slideshow. This is a two stage process. The stages in this process are logistics performance, logistics dashboard, logistics kpis.
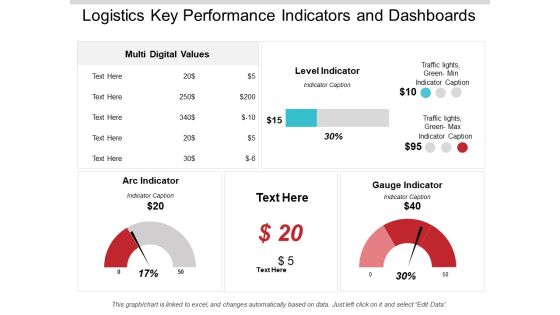
Logistics Key Performance Indicators And Dashboards Ppt PowerPoint Presentation Infographics Background Image
This is a logistics key performance indicators and dashboards ppt powerpoint presentation infographics background image. This is a three stage process. The stages in this process are logistics performance, logistics dashboard, logistics kpis.

Company Financial Performance Indicators With Revenue Cost And Assets Background PDF
This slide shows supply chain functions which are reliability for goods delivery, responsibility, flexibility, cost and asset management efficiency. Showcasing this set of slides titled Company Financial Performance Indicators With Revenue Cost And Assets Background PDF. The topics addressed in these templates are Perfect Order Fulfillment, Cycle Time, Supply Chain, Management Cost. All the content presented in this PPT design is completely editable. Download it and make adjustments in color, background, font etc. as per your unique business setting.
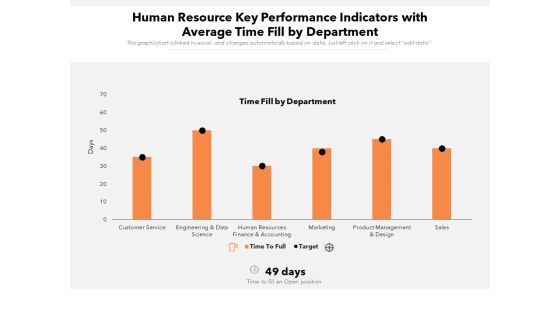
Human Resource Key Performance Indicators With Average Time Fill By Department Ppt PowerPoint Presentation Gallery Example Introduction PDF
Showcasing this set of slides titled human resource key performance indicators with average time fill by department ppt powerpoint presentation gallery example introduction pdf. The topics addressed in these templates are sales, service, finance. All the content presented in this PPT design is completely editable. Download it and make adjustments in color, background, font etc. as per your unique business setting.

Data Profiling Solutions Dashboard Indicating Row And Column Analysis Summary PDF
This slide illustrates data profiling dashboard indicating row and column analysis which can be referred by IT managers to manager to maintain quality and consistency of data. It contains information about reports, checking, evolution, overview, comparative, etc. Showcasing this set of slides titled Data Profiling Solutions Dashboard Indicating Row And Column Analysis Summary PDF. The topics addressed in these templates are Overview Analysis, Column Evaluation, Comparative Evaluation. All the content presented in this PPT design is completely editable. Download it and make adjustments in color, background, font etc. as per your unique business setting.
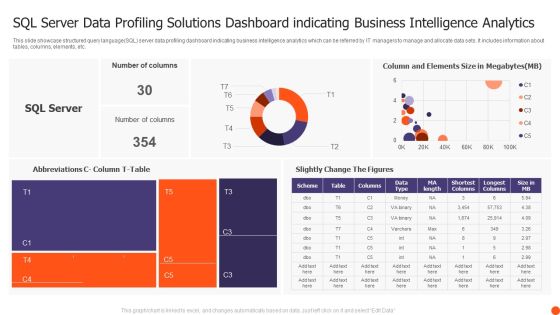
SQL Server Data Profiling Solutions Dashboard Indicating Business Intelligence Analytics Structure PDF
This slide showcase structured query language SQL server data profiling dashboard indicating business intelligence analytics which can be referred by IT managers to manage and allocate data sets. It includes information about tables, columns, elements, etc. Showcasing this set of slides titled SQL Server Data Profiling Solutions Dashboard Indicating Business Intelligence Analytics Structure PDF. The topics addressed in these templates are Number Columns, Slightly Change Figures, SQL Server. All the content presented in this PPT design is completely editable. Download it and make adjustments in color, background, font etc. as per your unique business setting.

Deploying Quality Assurance QA Transformation Implement Code Quality Measurements Guidelines PDF
This slide shows the details about Code Quality Measurements Approach for Effective QA Transformation along with details on Software Quality Indicators and Test Metrics such as Reliability, Security, Testability, Rate of Delivery etc.This is a Deploying Quality Assurance QA Transformation Implement Code Quality Measurements Guidelines PDF template with various stages. Focus and dispense information on seven stages using this creative set, that comes with editable features. It contains large content boxes to add your information on topics like Performance Efficiency, Maintainability, Reliability You can also showcase facts, figures, and other relevant content using this PPT layout. Grab it now.

Tableau Business Intelligence Tool Salesforce Business Profile Diagrams PDF
This slide highlights the salesforce analytics software reports and dashboards which showcases the dashboard that includes chart, table, gauge with real-time reporting, and security controls. Deliver an awe inspiring pitch with this creative Tableau Business Intelligence Tool Salesforce Business Profile Diagrams PDF bundle. Topics like Server Management, Embedded Analytics, Security Controls can be discussed with this completely editable template. It is available for immediate download depending on the needs and requirements of the user.

Key Performance Indicators For Information Technology Business Ppt PowerPoint Presentation File Graphics Example PDF
Presenting this set of slides with name key performance indicators for information technology business ppt powerpoint presentation file graphics example pdf. The topics discussed in these slides are service, manufacturer, management. This is a completely editable PowerPoint presentation and is available for immediate download. Download now and impress your audience.

Drug Indicator Extension In A Pharmaceuticals Company Product Development Strategy Of SW Care Pharmaceutical Company Guidelines PDF
This slide shows the product development strategy of SW Care Pharmaceutical Company based on 2 diseases that are Crohns Disease and Rheumatoid Arthritis. This slide also provides some information on opportunities that are available with the company to capture more market share for its brand KEMICARE. Presenting drug indicator extension in a pharmaceuticals company product development strategy of sw care pharmaceutical company guidelines pdf to provide visual cues and insights. Share and navigate important information on three stages that need your due attention. This template can be used to pitch topics like crohns disease, rheumatoid arthritis, ulcerative colitis, product development strategy. In addtion, this PPT design contains high resolution images, graphics, etc, that are easily editable and available for immediate download.
 Home
Home