Score Meter
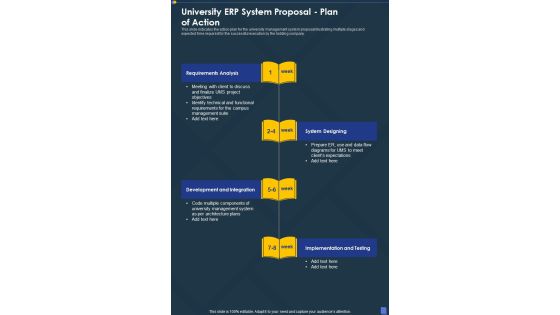
University Erp System Proposal Plan Of Action One Pager Sample Example Document
This slide indicates the action plan for the university management system proposal illustrating multiple stages and expected time required for the successful execution by the bidding company. Presenting you an exemplary University Erp System Proposal Plan Of Action One Pager Sample Example Document. Our one pager comprises all the must have essentials of an inclusive document. You can edit it with ease, as its layout is completely editable. With such freedom, you can tweak its design and other elements to your requirements. Download this University Erp System Proposal Plan Of Action One Pager Sample Example Document brilliant piece now.

University Administration System Proposal Next Steps One Pager Sample Example Document
This slide indicates the next steps to execute post acceptance of university management system proposal with signatures of project lead and client. Presenting you an exemplary University Administration System Proposal Next Steps One Pager Sample Example Document. Our one pager comprises all the must have essentials of an inclusive document. You can edit it with ease, as its layout is completely editable. With such freedom, you can tweak its design and other elements to your requirements. Download this University Administration System Proposal Next Steps One Pager Sample Example Document brilliant piece now.

University Administration System Proposal Plan For Action One Pager Sample Example Document
This slide indicates the action plan for the university management system proposal illustrating multiple stages and expected time required for the successful execution by the bidding company. Presenting you an exemplary University Administration System Proposal Plan For Action One Pager Sample Example Document. Our one pager comprises all the must have essentials of an inclusive document. You can edit it with ease, as its layout is completely editable. With such freedom, you can tweak its design and other elements to your requirements. Download this University Administration System Proposal Plan For Action One Pager Sample Example Document brilliant piece now.
Market Evaluation Of IT Industry Marketing Campaign Dashboard For B2b Marketers Icons PDF
The following slide showcases key performance indicator KPI dashboard that can assist managers to evaluate digital marketing campaign performance. The key metrics mentioned in the slide are click through rate CTR, conversion rate, cost per click CPC, etc. Make sure to capture your audiences attention in your business displays with our gratis customizable Market Evaluation Of IT Industry Marketing Campaign Dashboard For B2b Marketers Icons PDF. These are great for business strategies, office conferences, capital raising or task suggestions. If you desire to acquire more customers for your tech business and ensure they stay satisfied, create your own sales presentation with these plain slides.

KPI Dashboard For Tracking Project Summary Ppt Status Themes PDF
This slide brings forth dashboard which assists project managers in tracking the status of projects . The key performance indicators are project title, tag, responsibility, date assigned, project team, progress, deadline and status. Persuade your audience using this KPI Dashboard For Tracking Project Summary Ppt Status Themes PDF. This PPT design covers one stages, thus making it a great tool to use. It also caters to a variety of topics including Project Title, Responsibility, Date Assigned. Download this PPT design now to present a convincing pitch that not only emphasizes the topic but also showcases your presentation skills.

Successful Staff Retention Techniques KPI Metrics Dashboard Highlighting Employee Retention Rate Pictures PDF
The purpose of this slide is to exhibit a key performance indicator KPI dashboard through which managers can analyze the monthly employee retention rate. The metrics covered in the slide are active employees, new candidates hired, internal, exit, employee turnover rate, etc. Make sure to capture your audiences attention in your business displays with our gratis customizable Successful Staff Retention Techniques KPI Metrics Dashboard Highlighting Employee Retention Rate Pictures PDF. These are great for business strategies, office conferences, capital raising or task suggestions. If you desire to acquire more customers for your tech business and ensure they stay satisfied, create your own sales presentation with these plain slides.

Kpi Dashboard For Monitoring Status Of Nonprofit Advertising Strategy Portrait PDF
This slide brings forth dashboard which assists project managers in tracking the status of marketing plans and activities for timely decision making. The key performance indicators are project title, tag, responsibility, date assigned, project team, progress, deadline and status Pitch your topic with ease and precision using this Kpi Dashboard For Monitoring Status Of Nonprofit Advertising Strategy Portrait PDF. This layout presents information on Tag, Responsibility, Date Assigned. It is also available for immediate download and adjustment. So, changes can be made in the color, design, graphics or any other component to create a unique layout.

Performance KPI Dashboard Highlighting Boosting Brand Image Sample PDF
The following slide depicts a performance based dashboard to be used by brand managers to track the efficiency of marketing activities across platforms which has led to an increase in overall brand awareness. The key performing indicators are total website visits, user session, website mention, shares etc. Showcasing this set of slides titled Performance KPI Dashboard Highlighting Boosting Brand Image Sample PDF. The topics addressed in these templates are Social Media, Backlinks, Mentions Tags. All the content presented in this PPT design is completely editable. Download it and make adjustments in color, background, font etc. as per your unique business setting.

Dashboard To Monitor International Footprint Of Supply Chain Operations Brochure PDF
This slide depicts a dashboard that will be used by managers to monitor the global footprint of supply chain operations. Major key performance indicators include total global emissions, time frame, allocation, electricity, etc. Showcasing this set of slides titled Dashboard To Monitor International Footprint Of Supply Chain Operations Brochure PDF. The topics addressed in these templates are Electricity, Footprint Emissions, Allocation. All the content presented in this PPT design is completely editable. Download it and make adjustments in color, background, font etc. as per your unique business setting.

Buyer Marketing Campaign Performance Dashboard Download PDF
Following dashboard depicts shopper marketing dashboard which can be used by managers to assess the performance of their campaigns. The key performance indicators are total customers, countries, website views, total campaigns, email sent, website traffic source etc. Pitch your topic with ease and precision using this Buyer Marketing Campaign Performance Dashboard Download PDF. This layout presents information on Total Customers, Countries, Website Views. It is also available for immediate download and adjustment. So, changes can be made in the color, design, graphics or any other component to create a unique layout.
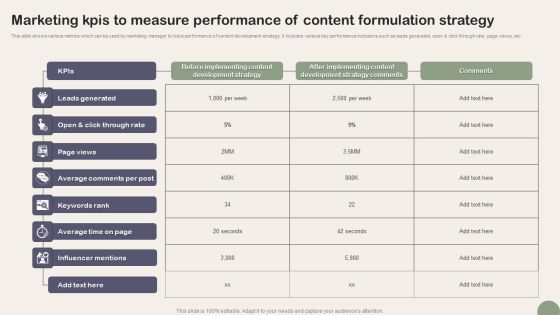
Marketing Kpis To Measure Performance Of Content Formulation Strategy Download PDF
This slide shows various metrics which can be used by marketing manager to track performance of content development strategy. It includes various key performance indicators such as leads generated, open and click through rate, page views, etc. Showcasing this set of slides titled Marketing Kpis To Measure Performance Of Content Formulation Strategy Download PDF. The topics addressed in these templates are Leads Generated, Page Views, Average Comments Per Post. All the content presented in this PPT design is completely editable. Download it and make adjustments in color, background, font etc. as per your unique business setting.

Results Of Service Performance Evaluation With Customer Objectives Diagrams PDF
Following slide depicts a dashboard which can be used by managers to track the result of customer service balanced scorecard to take corrective actions and achieve organizational goals. The key performing indicators relate to financial, customer, learning and growth and internal objectives. Showcasing this set of slides titled Results Of Service Performance Evaluation With Customer Objectives Diagrams PDF. The topics addressed in these templates are Financial, Customer, Internal. All the content presented in this PPT design is completely editable. Download it and make adjustments in color, background, font etc. as per your unique business setting.
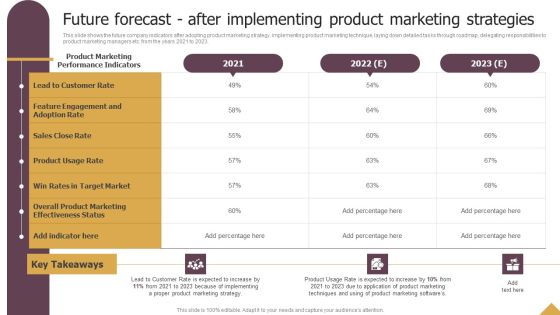
Future Forecast After Implementing Product Marketing Strategies Ppt Outline Format Ideas PDF
This slide shows the future company indicators after adopting product marketing strategy, implementing product marketing technique, laying down detailed tasks through roadmap, delegating responsibilities to product marketing managers etc. from the years 2021 to 2023. If your project calls for a presentation, then Slidegeeks is your go to partner because we have professionally designed, easy to edit templates that are perfect for any presentation. After downloading, you can easily edit Future Forecast After Implementing Product Marketing Strategies Ppt Outline Format Ideas PDF and make the changes accordingly. You can rearrange slides or fill them with different images. Check out all the handy templates
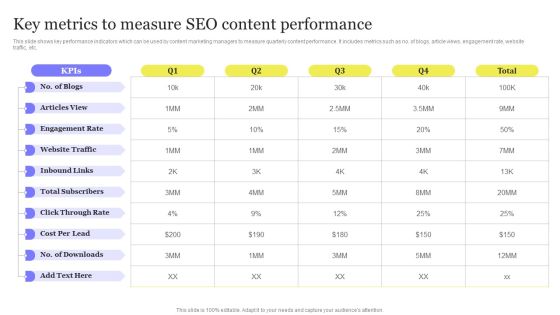
Enhancing Digital Visibility Using SEO Content Strategy Key Metrics To Measure SEO Content Performance Guidelines PDF
This slide shows key performance indicators which can be used by content marketing managers to measure quarterly content performance. It includes metrics such as no. of blogs, article views, engagement rate, website traffic, etc. Make sure to capture your audiences attention in your business displays with our gratis customizable Enhancing Digital Visibility Using SEO Content Strategy Key Metrics To Measure SEO Content Performance Guidelines PDF. These are great for business strategies, office conferences, capital raising or task suggestions. If you desire to acquire more customers for your tech business and ensure they stay satisfied, create your own sales presentation with these plain slides.
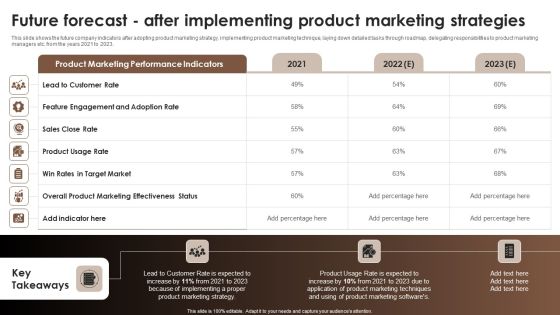
Strategic Components Of Product Advertising Future Forecast After Implementing Product Marketing Strategies Portrait PDF
This slide shows the future company indicators after adopting product marketing strategy, implementing product marketing technique, laying down detailed tasks through roadmap, delegating responsibilities to product marketing managers etc. from the years 2021 to 2023. If your project calls for a presentation, then Slidegeeks is your go to partner because we have professionally designed, easy to edit templates that are perfect for any presentation. After downloading, you can easily edit Strategic Components Of Product Advertising Future Forecast After Implementing Product Marketing Strategies Portrait PDF and make the changes accordingly. You can rearrange slides or fill them with different images. Check out all the handy templates
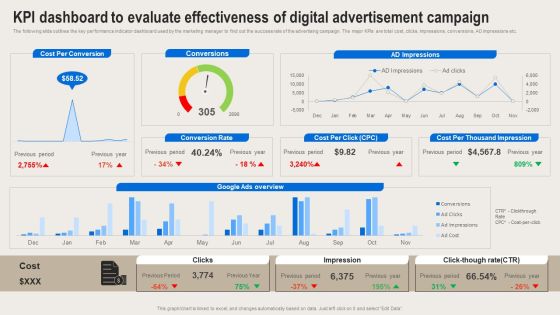
Formulating Branding Strategy To Enhance Revenue And Sales KPI Dashboard To Evaluate Effectivenessl Clipart PDF
The following slide outlines the key performance indicator dashboard used by the marketing manager to find out the success rate of the advertising campaign. The major KPIs are total cost, clicks, impressions, conversions, AD impressions etc. There are so many reasons you need a Formulating Branding Strategy To Enhance Revenue And Sales KPI Dashboard To Evaluate Effectivenessl Clipart PDF. The first reason is you cannot spend time making everything from scratch, Thus, Slidegeeks has made presentation templates for you too. You can easily download these templates from our website easily.

Ad Campaign Dashboard New Product Release Strategy Guidelines PDF
This slide depicts advertisement campaign dashboard used by fintech company managers to track effectiveness of the campaign for new product launch. The key performance indicators are ad cost, total clicks, total impressions, ad impressions etc. Pitch your topic with ease and precision using this Ad Campaign Dashboard New Product Release Strategy Guidelines PDF. This layout presents information on Impressions, Conversion, Strategy. It is also available for immediate download and adjustment. So, changes can be made in the color, design, graphics or any other component to create a unique layout.

Dashboard For Risk Reporting Of Plan Effectiveness Download PDF
This slide depicts a dashboard for communication of hazard plan effectiveness to effectively manage the major incidents and take action accordingly. The key performing indicators are days since hazard incident, number of incidents in a year, risk assessments, etc. Showcasing this set of slides titled Dashboard For Risk Reporting Of Plan Effectiveness Download PDF. The topics addressed in these templates are Risk Assessments, Awaiting Submission, Awaiting Submission. All the content presented in this PPT design is completely editable. Download it and make adjustments in color, background, font etc. as per your unique business setting.
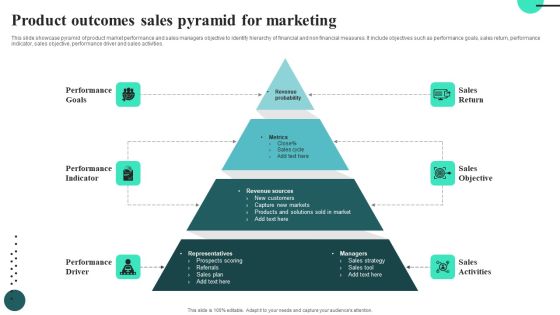
Product Outcomes Sales Pyramid For Marketing Information PDF
This slide showcase pyramid of product market performance and sales managers objective to identify hierarchy of financial and non financial measures. It include objectives such as performance goals, sales return, performance indicator, sales objective, performance driver and sales activities.Presenting Product Outcomes Sales Pyramid For Marketing Information PDF to dispense important information. This template comprises four stages. It also presents valuable insights into the topics including Sales Return, Sales Objective. This is a completely customizable PowerPoint theme that can be put to use immediately. So, download it and address the topic impactfully.
Dashboard Highlighting Status Of Clipart PDF
This dashboard depicts the current status of employee turnover which can be used by managers to create effective hiring plans and calculate hiring costs. The key performance indicators are total employees, age distribution, most costly role, employee attrition count, duration served by employees etc. Showcasing this set of slides titled Dashboard Highlighting Status Of Clipart PDF. The topics addressed in these templates are Dashboard Highlighting Status, HR Attrition. All the content presented in this PPT design is completely editable. Download it and make adjustments in color, background, font etc. as per your unique business setting.
Year End HR Attrition Dashboard With Major Kpis Demonstration PDF
Following dashboard presents the current status of employee turnover which can be used by managers to plan for new recruitments beforehand. The key performance indicators are current employees, newly hired, transfers, offboarding, turnover rate, retention rate etc. Persuade your audience using this Year End HR Attrition Dashboard With Major Kpis Demonstration PDF. This PPT design covers one stages, thus making it a great tool to use. It also caters to a variety of topics including Retention Rate, Turnover Rate, Offboarding. Download this PPT design now to present a convincing pitch that not only emphasizes the topic but also showcases your presentation skills.
Digital Sales Metrics Showing Enhancement Icons PDF
The following slide represents statistics of online sales key performance indicators KPIs which can assist marketing manager to review their performance and take necessary steps. It include different metrics such as add to cart rate, conversion rate, and revenue per session. Showcasing this set of slides titled Digital Sales Metrics Showing Enhancement Icons PDF. The topics addressed in these templates are Quarterly Online Sales Metrics, Targeted Right Customers, Offered Product Recommendations. All the content presented in this PPT design is completely editable. Download it and make adjustments in color, background, font etc. as per your unique business setting.

Kpi Dashboard To Track Owned Media Metrics Rules PDF
This slide brings forth a dashboard to track the performance of earned media channels which can be used by brand managers to get a brief idea about the effectiveness of the marketing strategy. Key performing indicators include number of conversions, conversion rate, backlinks published etc. Pitch your topic with ease and precision using this Kpi Dashboard To Track Owned Media Metrics Rules PDF. This layout presents information on Conversions, Backlinks Published, Metrics. It is also available for immediate download and adjustment. So, changes can be made in the color, design, graphics or any other component to create a unique layout.

Timeline For Enterprise Risk Administration Plan Implementation Designs PDF
This slide illustrates the business risk management program gantt chart to identify, monitor, and mitigate risk. It includes key steps such as develop KRI framework, provide training, track KRI, determine tolerance level, etc. Showcasing this set of slides titled Timeline For Enterprise Risk Administration Plan Implementation Designs PDF. The topics addressed in these templates are Develop Key Risk, Indicators Framework, Determine Tolerance Level . All the content presented in this PPT design is completely editable. Download it and make adjustments in color, background, font etc. as per your unique business setting.
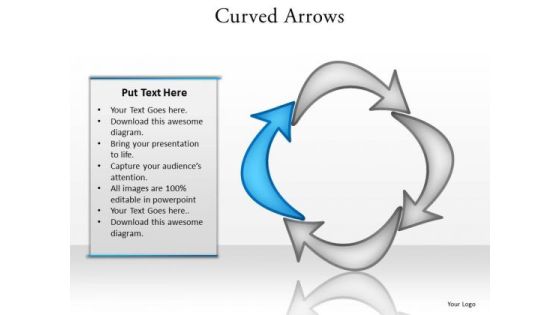
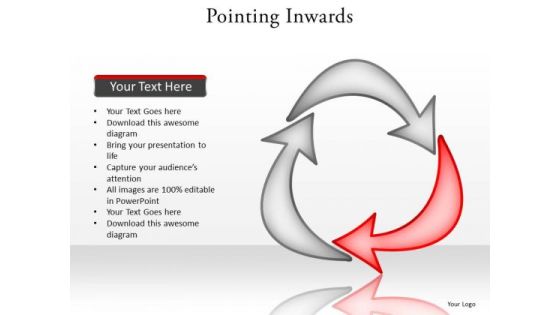
Ppt Curved Arrows PowerPoint Templates Pointing Inwards Step 4
PPT curved arrows powerpoint templates Pointing inwards step 4-This PowerPoint Diagram shows the highlighted blue arrow signifying the completion of process. It portrays the concept of bolt, cursor, dart, indicator, missile, pointer, projectile, shaft etc.-Can be used for presentations on around, arrow, business, button, chart, circle, collection, color, computer, curve, cycle, direction, down, ecology, element, environment, flowing, green, group, guidance, icon, isolated, leadership, leading, moving, pollution, processing, push, rotate, set, shape, shiny, sign, stick, symbol, triangle, turning, up, variation, waste-PPT curved arrows powerpoint templates Pointing inwards step 4
Ppt Curved PowerPoint Graphics Arrows Stage 2 Forming Triangle Templates
PPT curved powerpoint graphics arrows stage 2 forming triangle Templates-This PowerPoint Diagram shows the highlighted red arrow signifying the process is going on. It portrays the concept of bolt, cursor, dart, indicator, missile, pointer, projectile, shaft, achievement, attainment, close, conclusion, consummation, culmination, curtains, dispatch etc.-Can be used for presentations on around, arrow, business, button, chart, circle, collection, color, computer, curve, cycle, direction, down, ecology, element, environment, flowing, green, group, guidance, icon, isolated, leadership, leading, moving, pollution, processing, push, rotate, set, shape, shiny, sign, stick, symbol, triangle, turning, up, variation, waste-PPT curved powerpoint graphics arrows stage 2 forming triangle Templates

Ppt Curved Shapes Arrows PowerPoint Pointing Inwards Step 2 Templates
PPT curved shapes arrows powerpoint Pointing inwards step 2 Templates-This PowerPoint Diagram shows the highlighted blue arrow signifying the process is about to complete. It portrays the concept of bolt, cursor, dart, indicator, missile, pointer, projectile, shaft etc.-Can be used for presentations on around, arrow, business, button, chart, circle, collection, color, computer, curve, cycle, direction, down, ecology, element, environment, flowing, green, group, guidance, icon, isolated, leadership, leading, moving, pollution, processing, push, rotate, set, shape, shiny, sign, stick, symbol, triangle, turning, up, variation, waste-PPT curved shapes arrows powerpoint Pointing inwards step 2 Templates
Ppt Correlated Arrows In Horizontal Create PowerPoint Macro 7 State Diagram Templates
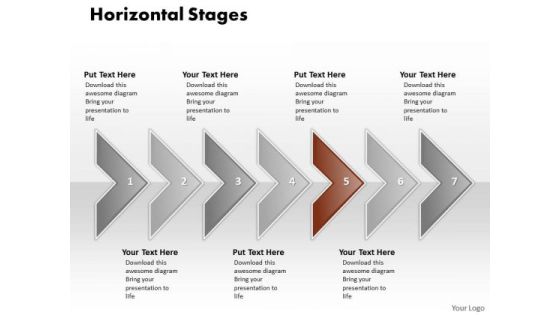
PPT correlated arrows in horizontal create powerpoint macro 7 state diagram Templates-This Diagram is used to illustrate how information will move between interrelated systems in the accomplishment of a given function, task or process. The visual description of this information flow with each given level showing how data is fed into a given process step and subsequently passed along at the completion of that step.-PPT correlated arrows in horizontal create powerpoint macro 7 state diagram Templates-Aim, Arrow, Badge, Border, Color, Connection, Curve, Design, Direction, Download, Icon, Illustration, Indicator, Internet, Label, Link, Magenta, Mark, Next, Object, Orientation, Paper, Peeling, Pointer, Rounded, Set, Shadow, Shape, Sign
Ppt Correlated Arrows PowerPoint Templates Even Line 7 Stages
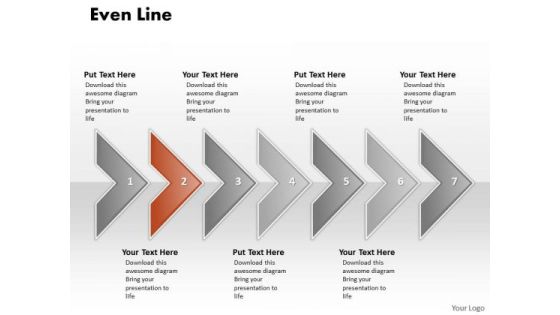
PPT correlated arrows powerpoint templates even line 7 stages-This Diagram is used to illustrate how information will move between interrelated systems in the accomplishment of a given function, task or process. The visual description of this information flow with each given level showing how data is fed into a given process step and subsequently passed along at the completion of that step.-PPT correlated arrows powerpoint templates even line 7 stages-Aim, Arrow, Badge, Border, Color, Connection, Curve, Design, Direction, Download, Icon, Illustration, Indicator, Internet, Label, Link, Magenta, Mark, Next, Object, Orientation, Paper, Peeling, Pointer, Rounded, Set, Shadow, Shape, Sign
Ppt Correlated Circular Arrows PowerPoint 2010 Horizontal Line 7 Stages Templates
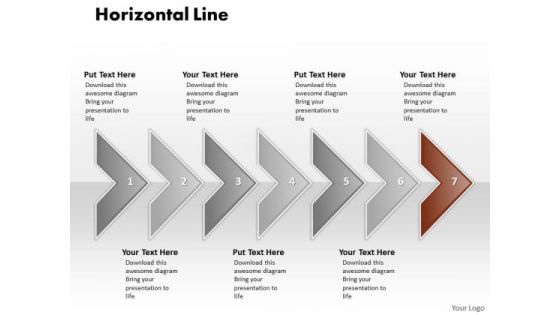
PPT correlated circular arrows powerpoint 2010 horizontal line 7 stages Templates-This Diagram is used to illustrate how information will move between interrelated systems in the accomplishment of a given function, task or process. The visual description of this information flow with each given level showing how data is fed into a given process step and subsequently passed along at the completion of that step.-PPT correlated circular arrows powerpoint 2010 horizontal line 7 stages Templates-Aim, Arrow, Badge, Border, Color, Connection, Curve, Design, Direction, Download, Icon, Illustration, Indicator, Internet, Label, Link, Magenta, Mark, Next, Object, Orientation, Paper, Peeling, Pointer, Rounded, Set, Shadow, Shape, Sign

Ppt Correlated Curved Arrows PowerPoint 2010 Regular Line 7 Stages Templates
PPT correlated curved arrows powerpoint 2010 regular line 7 stages Templates-This Diagram is used to illustrate how information will move between interrelated systems in the accomplishment of a given function, task or process. The visual description of this information flow with each given level showing how data is fed into a given process step and subsequently passed along at the completion of that step.-PPT correlated curved arrows powerpoint 2010 regular line 7 stages Templates-Aim, Arrow, Badge, Border, Color, Connection, Curve, Design, Direction, Download, Icon, Illustration, Indicator, Internet, Label, Link, Magenta, Mark, Next, Object, Orientation, Paper, Peeling, Pointer, Rounded, Set, Shadow, Shape, Sign
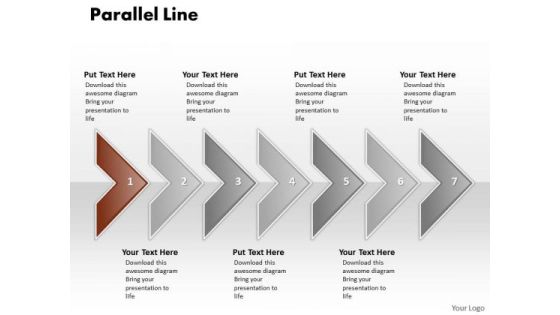
Ppt Correlated PowerPoint Graphics Arrows Parallel Line 7 Stage Templates
PPT correlated powerpoint graphics arrows parallel line 7 stage Templates-This Diagram is used to illustrate how information will move between interrelated systems in the accomplishment of a given function, task or process. The visual description of this information flow with each given level showing how data is fed into a given process step and subsequently passed along at the completion of that step.-PPT correlated powerpoint graphics arrows parallel line 7 stage Templates-Aim, Arrow, Badge, Border, Color, Connection, Curve, Design, Direction, Download, Icon, Illustration, Indicator, Internet, Label, Link, Magenta, Mark, Next, Object, Orientation, Paper, Peeling, Pointer, Rounded, Set, Shadow, Shape, Sign

Ppt Correlated Shapes Arrows PowerPoint Horizontal Stages Templates
PPT correlated shapes arrows powerpoint horizontal stages Templates-This Diagram is used to illustrate how information will move between interrelated systems in the accomplishment of a given function, task or process. The visual description of this information flow with each given level showing how data is fed into a given process step and subsequently passed along at the completion of that step.-PPT correlated shapes arrows powerpoint horizontal stages Templates-Aim, Arrow, Badge, Border, Color, Connection, Curve, Design, Direction, Download, Icon, Illustration, Indicator, Internet, Label, Link, Magenta, Mark, Next, Object, Orientation, Paper, Peeling, Pointer, Rounded, Set, Shadow, Shape, Sign
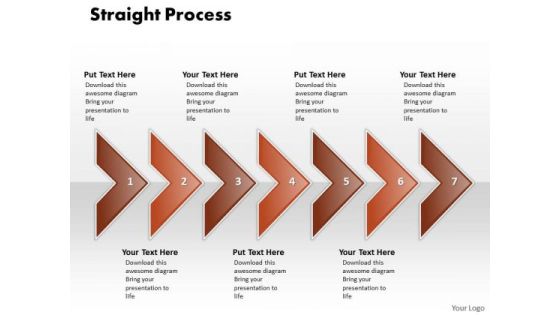
Ppt Correlated Shapes Arrows PowerPoint Straight Line 7 Phase Diagram Templates
PPT correlated shapes arrows powerpoint straight line 7 phase diagram Templates-This Diagram is used to illustrate how information will move between interrelated systems in the accomplishment of a given function, task or process. The visual description of this information flow with each given level showing how data is fed into a given process step and subsequently passed along at the completion of that step.-PPT correlated shapes arrows powerpoint straight line 7 phase diagram Templates-Aim, Arrow, Badge, Border, Color, Connection, Curve, Design, Direction, Download, Icon, Illustration, Indicator, Internet, Label, Link, Magenta, Mark, Next, Object, Orientation, Paper, Peeling, Pointer, Rounded, Set, Shadow, Shape, Sign

Ppt Operation Of 6 Concepts Through Shapes Arrows PowerPoint Templates
PPT operation of 6 concepts through shapes arrows powerpoint Templates-Develop competitive advantage with our above template which contains a arrow diagram. This can be used to build for presenting different ways for a single process. This power point diagram consists of 6 arrows. Continuous and ongoing process can be shown using this PPT Template.-PPT operation of 6 concepts through shapes arrows powerpoint Templates-Aim, Arrow, Badge, Border, Color, Connection, Curve, Design, Direction, Download, Icon, Illustration, Indicator, Internet, Label, Link, Magenta, Mark, Next, Object, Orientation, Paper, Peeling, Pointer, Rounded, Set, Shadow, Shape, Sign
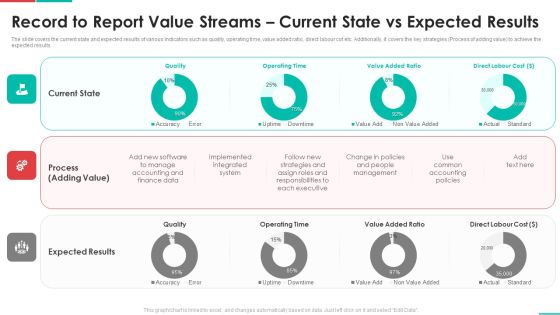
Roadmap For Financial Accounting Transformation Record To Report Value Streams Current State Professional PDF
The slide covers the current state and expected results of various indicators such as quality, operating time, value added ratio, direct labour cot etc. Additionally, it covers the key strategies Process of adding value to achieve the expected results. Deliver and pitch your topic in the best possible manner with this roadmap for financial accounting transformation record to report value streams current state professional pdf. Use them to share invaluable insights on current state, process, expected results and impress your audience. This template can be altered and modified as per your expectations. So, grab it now.

Budget Health Tracking Kpis For Effective Project Planning Ideas PDF
This slide covers different indicators that must be implemented to track the financial health of the organization. The KPIs are time consuming, complex processes, high volume, manual errors and less visibility Persuade your audience using this budget health tracking kpis for effective project planning ideas pdf. This PPT design covers five stages, thus making it a great tool to use. It also caters to a variety of topics including time consuming, complex processes, high volume, manual errors, less visibility . Download this PPT design now to present a convincing pitch that not only emphasizes the topic but also showcases your presentation skills.
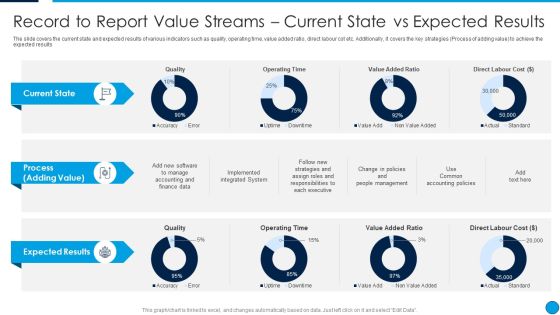
Summary Financial Record To Report Value Streams Current State Vs Expected Results Template PDF
The slide covers the current state and expected results of various indicators such as quality, operating time, value added ratio, direct labour cot etc. Additionally, it covers the key strategies Process of adding value to achieve the expected results. Deliver an awe inspiring pitch with this creative Summary Financial Record To Report Value Streams Current State Vs Expected Results Template PDF bundle. Topics like Current State, Process, Adding Value, Expected Results, Operating Time, Value Added Ratio can be discussed with this completely editable template. It is available for immediate download depending on the needs and requirements of the user.

Roadmap For Corporate Resilience With Key Milestones Infographics PDF
The following slide illustrates the roadmap for business resilience indicating key milestones. This roadmap includes different stages such as assessing the disruption, modifying the process and implementing the changes. Pitch your topic with ease and precision using this Roadmap For Corporate Resilience With Key Milestones Infographics PDF. This layout presents information on Implementing The Changes, Modifying The Process, Assessing The Disruption. It is also available for immediate download and adjustment. So, changes can be made in the color, design, graphics or any other component to create a unique layout.
Finance And Accounting Online Conversion Plan Record To Report Value Streams Mockup PDF
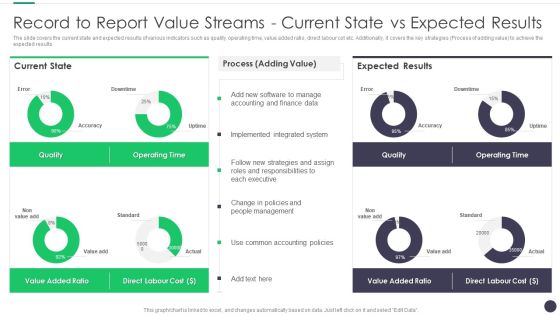
The slide covers the current state and expected results of various indicators such as quality, operating time, value added ratio, direct labour cot etc. Additionally, it covers the key strategies Process of adding value to achieve the expected results. Deliver an awe inspiring pitch with this creative Finance And Accounting Online Conversion Plan Record To Report Value Streams Mockup PDF bundle. Topics like Operating Time, Process, Expected Results can be discussed with this completely editable template. It is available for immediate download depending on the needs and requirements of the user.
Qualitative And Quantitative Matrix Of People Categorization Topics PDF
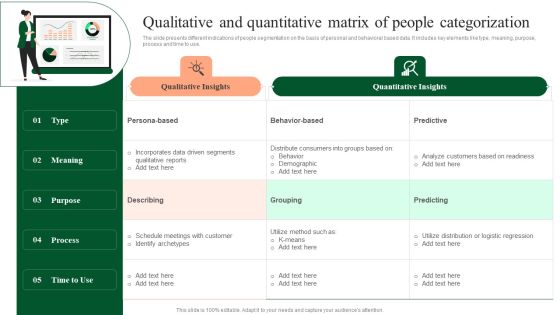
The slide presents different indications of people segmentation on the basis of personal and behavioral based data. It includes key elements like type, meaning, purpose, process and time to use. Persuade your audience using this Qualitative And Quantitative Matrix Of People Categorization Topics PDF. This PPT design covers five stages, thus making it a great tool to use. It also caters to a variety of topics including Qualitative Insights, Quantitative Insights, Process. Download this PPT design now to present a convincing pitch that not only emphasizes the topic but also showcases your presentation skills.

Colorful Gifts Events PowerPoint Templates Ppt Backgrounds For Slides 1112
We present our Colorful Gifts Events PowerPoint Templates PPT Backgrounds for Slides 1112.Use our Boxes PowerPoint Templates because; the core of any organization is the people who work for it. Use our Events PowerPoint Templates because, they are indicators of the path you have in mind. Use our Christmas PowerPoint Templates because, Christian Religion Template: - Spread the powerful message of Christianity to your congregation or community. Use our Festival PowerPoint Templates because; Use them to help you organize the logic of your views. Use our Holidays PowerPoint Templates because, Start the gears of youthful minds and set them in motion. Use these PowerPoint slides for presentations relating to Colorful gift box, Christmas, festival, holidays, events, boxes. The prominent colors used in the PowerPoint template are Pink, Green, and Yellow

Social Media Kpi Analytics Measurement Business Social Strategy Guide Infographics PDF
This template covers key performance indicator KPI to determine the performance against the company objectives. These Social media KPIs would be focusing on social engagements, content reach, purchase leads and conversions. If you are looking for a format to display your unique thoughts, then the professionally designed Social Media Kpi Analytics Measurement Business Social Strategy Guide Infographics PDF is the one for you. You can use it as a Google Slides template or a PowerPoint template. Incorporate impressive visuals, symbols, images, and other charts. Modify or reorganize the text boxes as you desire. Experiment with shade schemes and font pairings. Alter, share or cooperate with other people on your work. Download Social Media Kpi Analytics Measurement Business Social Strategy Guide Infographics PDF and find out how to give a successful presentation. Present a perfect display to your team and make your presentation unforgettable.

Executing Risk Mitigation KPI Dashboard To Track Effectiveness Of Real Estate Rules PDF
The following slide exhibits key performance indicator KPI dashboard which can be used to measure the financial performance of the real estate company. It covers various KPIs such as sales vs target per agent, top 10 projects, top 5 agencies etc. Find highly impressive Executing Risk Mitigation KPI Dashboard To Track Effectiveness Of Real Estate Rules PDF on Slidegeeks to deliver a meaningful presentation. You can save an ample amount of time using these presentation templates. No need to worry to prepare everything from scratch because Slidegeeks experts have already done a huge research and work for you. You need to download Executing Risk Mitigation Kpi Dashboard To Track Effectiveness Of Real Estate Rules PDF for your upcoming presentation. All the presentation templates are 100 percent editable and you can change the color and personalize the content accordingly. Download now.

KPI Metrics Dashboard To Monitor Mobile Performing Mobile SEO Audit To Analyze Web Traffic Graphics PDF
The purpose of this slide is to outline key performance indicator KPI dashboard which will assist the marketer to analyze mobile search engine optimization SEO performance. The key metrics mentioned in the slide are total sessions, search engine rankings etc.Find highly impressive KPI Metrics Dashboard To Monitor Mobile Performing Mobile SEO Audit To Analyze Web Traffic Graphics PDF on Slidegeeks to deliver a meaningful presentation. You can save an ample amount of time using these presentation templates. No need to worry to prepare everything from scratch because Slidegeeks experts have already done a huge research and work for you. You need to download KPI Metrics Dashboard To Monitor Mobile Performing Mobile SEO Audit To Analyze Web Traffic Graphics PDF for your upcoming presentation. All the presentation templates are 100 precent editable and you can change the color and personalize the content accordingly. Download now.
Implementing Succession Planning KPI Dashboard For Human Resource Template PDF
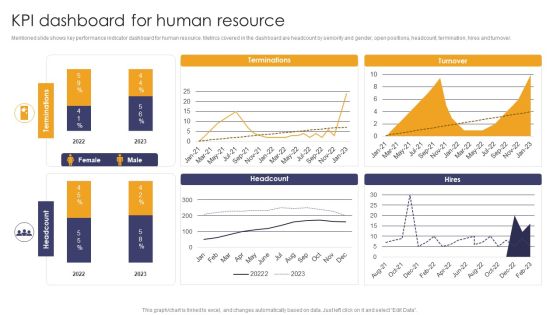
Mentioned slide shows key performance indicator dashboard for human resource. Metrics covered in the dashboard are headcount by seniority and gender, open positions, headcount, termination, hires and turnover. If you are looking for a format to display your unique thoughts, then the professionally designed Implementing Succession Planning KPI Dashboard For Human Resource Template PDF is the one for you. You can use it as a Google Slides template or a PowerPoint template. Incorporate impressive visuals, symbols, images, and other charts. Modify or reorganize the text boxes as you desire. Experiment with shade schemes and font pairings. Alter, share or cooperate with other people on your work. Download Implementing Succession Planning KPI Dashboard For Human Resource Template PDF and find out how to give a successful presentation. Present a perfect display to your team and make your presentation unforgettable.

Executing Video Promotional KPI Dashboard To Measure Effectiveness Of Youtube Marketing Professional PDF
The following slide outlines key performance indicator KPI dashboard which will assist the marketer to track YouTube marketing campaign performance. The key metrics covered in the slide are subscribers gained and lost, likes, dislikes, comments, shares etc. Formulating a presentation can take up a lot of effort and time, so the content and message should always be the primary focus. The visuals of the PowerPoint can enhance the presenters message, so our Executing Video Promotional KPI Dashboard To Measure Effectiveness Of Youtube Marketing Professional PDF was created to help save time. Instead of worrying about the design, the presenter can concentrate on the message while our designers work on creating the ideal templates for whatever situation is needed. Slidegeeks has experts for everything from amazing designs to valuable content, we have put everything into Executing Video Promotional KPI Dashboard To Measure Effectiveness Of Youtube Marketing Professional PDF
Internal Employee Succession KPI Dashboard For Human Resource Information PDF
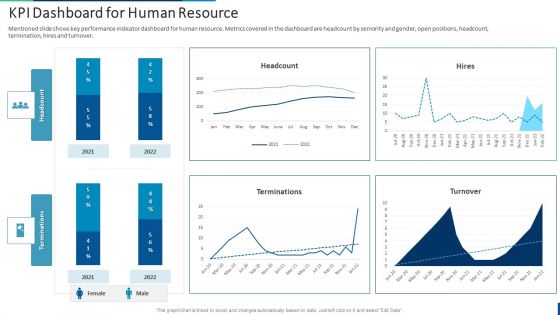
Mentioned slide shows key performance indicator dashboard for human resource. Metrics covered in the dashboard are headcount by seniority and gender, open positions, headcount, termination, hires and turnover. If you are looking for a format to display your unique thoughts, then the professionally designed Internal Employee Succession KPI Dashboard For Human Resource Information PDF is the one for you. You can use it as a Google Slides template or a PowerPoint template. Incorporate impressive visuals, symbols, images, and other charts. Modify or reorganize the text boxes as you desire. Experiment with shade schemes and font pairings. Alter, share or cooperate with other people on your work. Download Internal Employee Succession KPI Dashboard For Human Resource Information PDF and find out how to give a successful presentation. Present a perfect display to your team and make your presentation unforgettable.

Estimating Business Overall Kpi Metrics Dashboard Highlighting Organization Revenue Clipart PDF
The following slide outlines key performance indicator KPI dashboard showcasing various financial metrics of the organization. The key metrics are gross revenue, product revenue, service revenue, gross profit, net profit etc. Formulating a presentation can take up a lot of effort and time, so the content and message should always be the primary focus. The visuals of the PowerPoint can enhance the presenters message, so our Estimating Business Overall Kpi Metrics Dashboard Highlighting Organization Revenue Clipart PDF was created to help save time. Instead of worrying about the design, the presenter can concentrate on the message while our designers work on creating the ideal templates for whatever situation is needed. Slidegeeks has experts for everything from amazing designs to valuable content, we have put everything into Estimating Business Overall Kpi Metrics Dashboard Highlighting Organization Revenue Clipart PDF.

Determining The Ransom Payment Paid By Organizations Over Time Information PDF
Following graphical slide shows the amount of ransom paid by organizations over the last two years. Graph indicates that ransom payments appear to have stabilized as a result of effective incident response approaches.If you are looking for a format to display your unique thoughts, then the professionally designed Determining The Ransom Payment Paid By Organizations Over Time Information PDF is the one for you. You can use it as a Google Slides template or a PowerPoint template. Incorporate impressive visuals, symbols, images, and other charts. Modify or reorganize the text boxes as you desire. Experiment with shade schemes and font pairings. Alter, share or cooperate with other people on your work. Download Determining The Ransom Payment Paid By Organizations Over Time Information PDF and find out how to give a successful presentation. Present a perfect display to your team and make your presentation unforgettable.
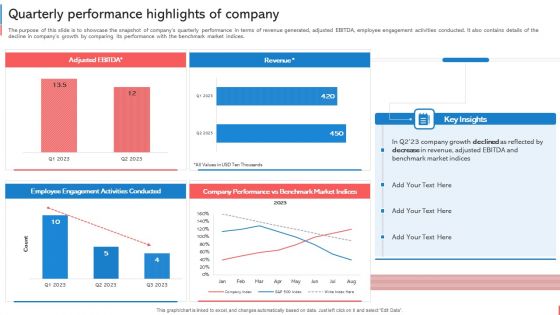
Company Budget Analysis Quarterly Performance Highlights Of Company Ideas PDF
The purpose of this slide is to showcase the snapshot of companys quarterly performance in terms of revenue generated, adjusted EBITDA, employee engagement activities conducted. It also contains details of the decline in companys growth by comparing its performance with the benchmark market indices. Formulating a presentation can take up a lot of effort and time, so the content and message should always be the primary focus. The visuals of the PowerPoint can enhance the presenters message, so our Company Budget Analysis Quarterly Performance Highlights Of Company Ideas PDF was created to help save time. Instead of worrying about the design, the presenter can concentrate on the message while our designers work on creating the ideal templates for whatever situation is needed. Slidegeeks has experts for everything from amazing designs to valuable content, we have put everything into Company Budget Analysis Quarterly Performance Highlights Of Company Ideas PDF.
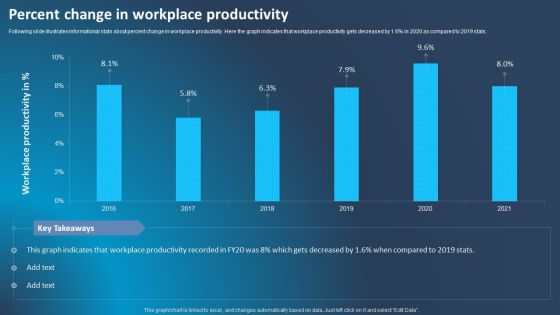
Improving Corporate Performance Percent Change In Workplace Productivity Inspiration PDF
Following slide illustrates informational stats about percent change in workplace productivity. Here the graph indicates that workplace productivity gets decreased by 1.6 percent in 2020 as compared to 2019 stats. Formulating a presentation can take up a lot of effort and time, so the content and message should always be the primary focus. The visuals of the PowerPoint can enhance the presenters message, so our Improving Corporate Performance Percent Change In Workplace Productivity Inspiration PDF was created to help save time. Instead of worrying about the design, the presenter can concentrate on the message while our designers work on creating the ideal templates for whatever situation is needed. Slidegeeks has experts for everything from amazing designs to valuable content, we have put everything into Improving Corporate Performance Percent Change In Workplace Productivity Inspiration PDF.

Implementation Of Digital Marketing Impact Of Digital Marketing Post Implementation Professional PDF
This slide represents performance indicators showcasing impact of digital marketing post implementation. It covers lead generation, customer traffic, bounce rate etc. Formulating a presentation can take up a lot of effort and time, so the content and message should always be the primary focus. The visuals of the PowerPoint can enhance the presenters message, so our Implementation Of Digital Marketing Impact Of Digital Marketing Post Implementation Professional PDF was created to help save time. Instead of worrying about the design, the presenter can concentrate on the message while our designers work on creating the ideal templates for whatever situation is needed. Slidegeeks has experts for everything from amazing designs to valuable content, we have put everything into Implementation Of Digital Marketing Impact Of Digital Marketing Post Implementation Professional PDF.

Guide To SEO Marketing Top SEO Kpis Along The Sales Funnel Slides PDF
This slide covers SEO key performance indicators such as organic clicks, referral traffic, search engine visibility, average session time, bounce rate, leads generated from SEO, goal completions, etc. Find highly impressive Guide To SEO Marketing Top SEO Kpis Along The Sales Funnel Slides PDF on Slidegeeks to deliver a meaningful presentation. You can save an ample amount of time using these presentation templates. No need to worry to prepare everything from scratch because Slidegeeks experts have already done a huge research and work for you. You need to download Guide To SEO Marketing Top SEO Kpis Along The Sales Funnel Slides PDF for your upcoming presentation. All the presentation templates are 100 percent editable and you can change the color and personalize the content accordingly. Download now.
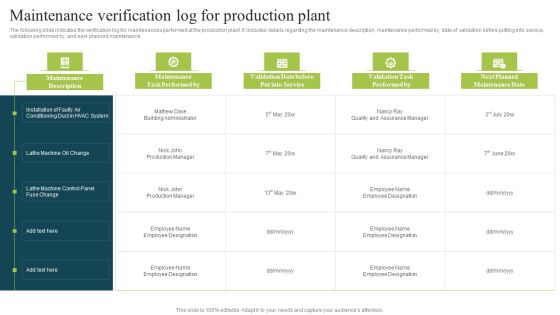
Plan To Enhance Manufacturing Maintenance Verification Log For Production Plant Brochure PDF
The following slide indicates the verification log for maintenances performed at the production plant. It includes details regarding the maintenance description, maintenance performed by, date of validation before putting into service, validation performed by, and next planned maintenance. Boost your pitch with our creative Plan To Enhance Manufacturing Maintenance Verification Log For Production Plant Brochure PDF. Deliver an awe-inspiring pitch that will mesmerize everyone. Using these presentation templates you will surely catch everyones attention. You can browse the ppts collection on our website. We have researchers who are experts at creating the right content for the templates. So you dont have to invest time in any additional work. Just grab the template now and use them.
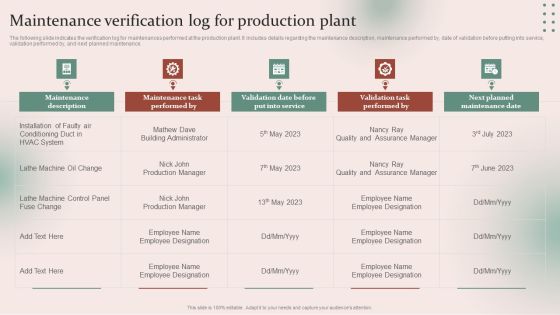
Strategies For Effective Manufacturing Maintenance Verification Log For Production Plant Brochure PDF
The following slide indicates the verification log for maintenances performed at the production plant. It includes details regarding the maintenance description, maintenance performed by, date of validation before putting into service, validation performed by, and next planned maintenance. Boost your pitch with our creative Strategies For Effective Manufacturing Maintenance Verification Log For Production Plant Brochure PDF. Deliver an awe-inspiring pitch that will mesmerize everyone. Using these presentation templates you will surely catch everyones attention. You can browse the ppts collection on our website. We have researchers who are experts at creating the right content for the templates. So you dont have to invest time in any additional work. Just grab the template now and use them.
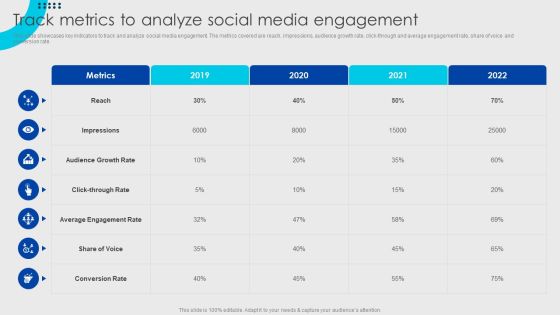
Online Fashion Firm Summary Track Metrics To Analyze Social Media Engagement Topics PDF
This slide showcases key indicators to track and analyze social media engagement. The metrics covered are reach, impressions, audience growth rate, click-through and average engagement rate, share of voice and conversion rate. Find highly impressive Online Fashion Firm Summary Track Metrics To Analyze Social Media Engagement Topics PDF on Slidegeeks to deliver a meaningful presentation. You can save an ample amount of time using these presentation templates. No need to worry to prepare everything from scratch because Slidegeeks experts have already done a huge research and work for you. You need to download Online Fashion Firm Summary Track Metrics To Analyze Social Media Engagement Topics PDF for your upcoming presentation. All the presentation templates are 100 percent editable and you can change the color and personalize the content accordingly. Download now.
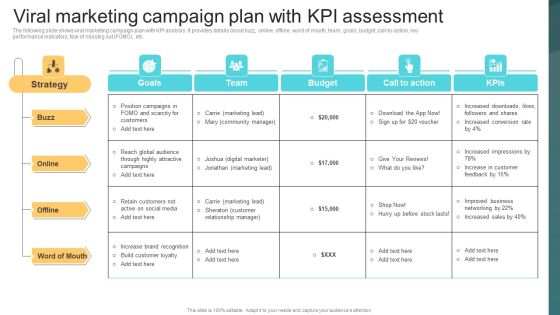
Viral Marketing Campaign Plan With Kpi Assessment Deploying Viral Marketing Strategies Brochure PDF
The following slide shows viral marketing campaign plan with KPI analysis. It provides details about buzz, online, offline, word of mouth, team, goals, budget, call to action, key performance indicators, fear of missing out FOMO, etc. Find highly impressive Viral Marketing Campaign Plan With Kpi Assessment Deploying Viral Marketing Strategies Brochure PDF on Slidegeeks to deliver a meaningful presentation. You can save an ample amount of time using these presentation templates. No need to worry to prepare everything from scratch because Slidegeeks experts have already done a huge research and work for you. You need to download Viral Marketing Campaign Plan With Kpi Assessment Deploying Viral Marketing Strategies Brochure PDF for your upcoming presentation. All the presentation templates are 100 precent editable and you can change the color and personalize the content accordingly. Download now.

Affect Of Consumer Emotions On Brands Kpis Utilizing Emotional And Rational Branding For Improved Themes PDF
This slide showcases impact of customer emotions on brands key performance indicators KPIs. It provides details about emotion, action, impact on brand, connect, empathize, encourage, virality, word of mouth marketing, etc. Boost your pitch with our creative Affect Of Consumer Emotions On Brands Kpis Utilizing Emotional And Rational Branding For Improved Themes PDF. Deliver an awe-inspiring pitch that will mesmerize everyone. Using these presentation templates you will surely catch everyones attention. You can browse the ppts collection on our website. We have researchers who are experts at creating the right content for the templates. So you do not have to invest time in any additional work. Just grab the template now and use them.

KPI Dashboard To Analyze In Store Merchandising Strategy Performance Introduction PDF
The following slide outlines a performance key performance indicator KPI dashboard used to evaluate the effectiveness of in-store merchandising strategy. The KPIs covered in the slide are total sales, average inventory, active stores, distinct products sold, etc. Formulating a presentation can take up a lot of effort and time, so the content and message should always be the primary focus. The visuals of the PowerPoint can enhance the presenters message, so our KPI Dashboard To Analyze In Store Merchandising Strategy Performance Introduction PDF was created to help save time. Instead of worrying about the design, the presenter can concentrate on the message while our designers work on creating the ideal templates for whatever situation is needed. Slidegeeks has experts for everything from amazing designs to valuable content, we have put everything into KPI Dashboard To Analyze In Store Merchandising Strategy Performance Introduction PDF.
 Home
Home