Score Meter

Ecommerce Operations Management Metrics To Measure Performance Professional PDF
This slide showcases essential metrics of e-commerce to make informed decisions. Major key performance indicators covered are website traffic, shopping cart abandonment rate, revenue per visitor and on time delivery rate. Presenting Ecommerce Operations Management Metrics To Measure Performance Professional PDF to dispense important information. This template comprises one stage. It also presents valuable insights into the topics including Abandonment Rate, Industry Benchmark, Performance. This is a completely customizable PowerPoint theme that can be put to use immediately. So, download it and address the topic impactfully.

Table Showing Risk Management Framework Plan Status Download PDF
This slide indicates the risks involved during the development and designing of product car. It also includes the mitigation plan with responsible person and its status. Persuade your audience using this Table Showing Risk Management Framework Plan Status Download PDF. This PPT design covers four stages, thus making it a great tool to use. It also caters to a variety of topics including Mitigation Plan, Responsible Person, Risk. Download this PPT design now to present a convincing pitch that not only emphasizes the topic but also showcases your presentation skills.
Multi Cloud Infrastructure Management Cloud Performance Tracking Dashboard Diagrams PDF
This slide covers the Key performance indicators for tracking performance of the cloud such as violations break down, sources, rules and severity. From laying roadmaps to briefing everything in detail, our templates are perfect for you. You can set the stage with your presentation slides. All you have to do is download these easy-to-edit and customizable templates. Multi Cloud Infrastructure Management Cloud Performance Tracking Dashboard Diagrams PDF will help you deliver an outstanding performance that everyone would remember and praise you for. Do download this presentation today.

Step 8 Event Management Performance Evaluation Metrics Themes PDF
This slide showcases the key metrics that are tracked to measure event success. The indicators covered are registration trends, post survey responses, cost per attendee, NPS and conversion rate. Take your projects to the next level with our ultimate collection of Step 8 Event Management Performance Evaluation Metrics Themes PDF. Slidegeeks has designed a range of layouts that are perfect for representing task or activity duration, keeping track of all your deadlines at a glance. Tailor these designs to your exact needs and give them a truly corporate look with your own brand colors they will make your projects stand out from the rest

Project Management Software Capital Raising Deck Financial Projections Background PDF
Following slide represents forecasted financial performance of company. It includes financial indicators such as cash flow, revenue, operating expenses, COGS and total customers. This Project Management Software Capital Raising Deck Financial Projections Background PDF is perfect for any presentation, be it in front of clients or colleagues. It is a versatile and stylish solution for organizing your meetings. The product features a modern design for your presentation meetings. The adjustable and customizable slides provide unlimited possibilities for acing up your presentation. Slidegeeks has done all the homework before launching the product for you. So, do not wait, grab the presentation templates today
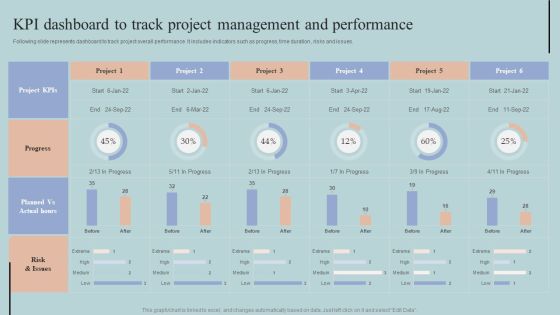
KPI Dashboard To Track Project Management And Performance Elements PDF
Following slide represents dashboard to track project overall performance. It includes indicators such as progress, time duration , risks and issues. Welcome to our selection of the KPI Dashboard To Track Project Management And Performance Elements PDF. These are designed to help you showcase your creativity and bring your sphere to life. Planning and Innovation are essential for any business that is just starting out. This collection contains the designs that you need for your everyday presentations. All of our PowerPoints are 100 percent editable, so you can customize them to suit your needs. This multi-purpose template can be used in various situations. Grab these presentation templates today

Food Processing Industry Latest Insights Trends And Analytics Porters Five Forces Analysis Of Food Manufacturing Industry Formats PDF
This slide indicates the porters five forces analysis of food manufacturing industry providing information regarding threat of new entrant, rivalry among exiting players, threat of substitutes, bargaining power of suppliers and buyers. From laying roadmaps to briefing everything in detail, our templates are perfect for you. You can set the stage with your presentation slides. All you have to do is download these easy to edit and customizable templates. Food Processing Industry Latest Insights Trends And Analytics Porters Five Forces Analysis Of Food Manufacturing Industry Formats PDF will help you deliver an outstanding performance that everyone would remember and praise you for. Do download this presentation today.

PowerPoint Templates Free Download Process Circular Flow Diagram
We present our powerpoint templates free download process Circular Flow Diagram.Download our Ring charts PowerPoint Templates because you must Evolve the strategy to take you down the required path with appropriate, efficient and effective marketing along the way. Download and present our Circle charts PowerPoint Templates because this slide Probe the minds of your colleagues, see their faces light up as they assimilate and understand the value of your suggestions. Download and present our Business PowerPoint Templates because it helps you to explain your plans in all earnest to your colleagues and raise the bar for all. Present our Process and Flows PowerPoint Templates because you know that the core of any organisation is the people who work for it. Use our Marketing PowerPoint Templates because networking is an imperative in todays world. You need to access the views of others. Similarly you need to give access to them of your abilities.Use these PowerPoint slides for presentations relating to Arrowheads, cerulean, circle, circulation, cobalt,colorful, cyan, cycle, element,emblem, grayshadow, green,icon, indicator, interface, internet, label,link, load, marker, motion, movement,navigationpanel, next, orientation, pagsite, pink, pointer, previous, process, reload, rotation, satined, sign, signpost,smooth, sticker, sticky, symbol. The prominent colors used in the PowerPoint template are Yellow, Orange, Gray. Customers tell us our powerpoint templates free download process Circular Flow Diagram are Ultra. We assure you our cobalt PowerPoint templates and PPT Slides are Magical. PowerPoint presentation experts tell us our powerpoint templates free download process Circular Flow Diagram are Awesome. People tell us our cyan PowerPoint templates and PPT Slides are Nice. We assure you our powerpoint templates free download process Circular Flow Diagram are Tasteful. Use our cobalt PowerPoint templates and PPT Slides are Efficient.

Usa Ppt Background Linear Arrow 10 State PowerPoint Project Diagram 5 Image
USA PPT Background linear arrow 10 state powerpoint project diagram 5 Image-Use this diagram to emphasize the process of your corporate growth. Highlight your ideas broad- based on strong fundamentals and illustrate how they step by step achieve the set growth factor.-USA PPT Background linear arrow 10 state powerpoint project diagram 5 Image-Arrow, Background, Collection, Completed, Concept, Confirmation, Design, Flow, Graph, Graphic, Illustration, Indication, Indicator, Information, Instruction, Interface, Internet, Layout, Measurement, Order, Phase, Pointer, Process, Progress, Reflection, Scale, Shape, Sign
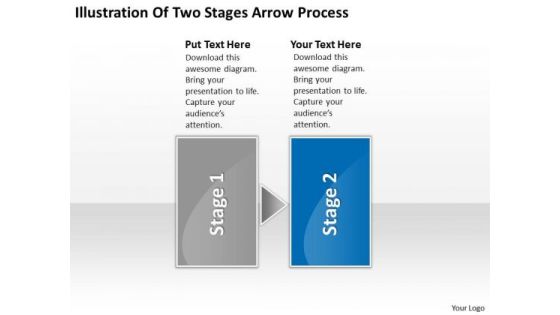
Illustration Of Two Stages Arrow Process Business Flowchart Program PowerPoint Templates
We present our illustration of two stages arrow process business flowchart program PowerPoint templates.Present our Arrows PowerPoint Templates because you should take your team soaring to the pinnacle they crave. Download our Shapes PowerPoint Templates because you have the basic goal in mind. Use our Business PowerPoint Templates because you have selected your team man for man. Download and present our Boxes PowerPoint Templates because honesty is the best policy has an ardent follower in you. Present our Communication PowerPoint Templates because it builds on your foundation or prepares for change ahead to enhance the future.Use these PowerPoint slides for presentations relating to arrow, background, banner, bar, blue, collection, completed, completion, concept, confirmation, design, five, flow, four, graph, graphic, illustration, indication, indicator, information, instruction, interface, internet, layout, measurement, modern, number, one, order, phase, pointer, process, progress, reflection, scale, send, set, shape, stage, status, step, template, three, two, vector, web, web design, web design elements, websites, work flow. The prominent colors used in the PowerPoint template are Blue, Gray, White. The feedback we get is that our illustration of two stages arrow process business flowchart program PowerPoint templates are Appealing. PowerPoint presentation experts tell us our completed PowerPoint templates and PPT Slides are Colorful. People tell us our illustration of two stages arrow process business flowchart program PowerPoint templates will make the presenter look like a pro even if they are not computer savvy. Professionals tell us our completion PowerPoint templates and PPT Slides are Endearing. You can be sure our illustration of two stages arrow process business flowchart program PowerPoint templates are Fancy. We assure you our completion PowerPoint templates and PPT Slides are Swanky.

Optimizing Online Stores Impact Of Ecommerce Management System Post Microsoft PDF
This slide represents the key performance indicators to measure the impact of ecommerce management system on ecommerce business operations. It includes KPIs to such as average order value, gross profit, conversion rate, shopping cart abandonment rate, shopping cart conversion rate etc. Formulating a presentation can take up a lot of effort and time, so the content and message should always be the primary focus. The visuals of the PowerPoint can enhance the presenters message, so our Optimizing Online Stores Impact Of Ecommerce Management System Post Microsoft PDF was created to help save time. Instead of worrying about the design, the presenter can concentrate on the message while our designers work on creating the ideal templates for whatever situation is needed. Slidegeeks has experts for everything from amazing designs to valuable content, we have put everything into Optimizing Online Stores Impact Of Ecommerce Management System Post Microsoft PDF.
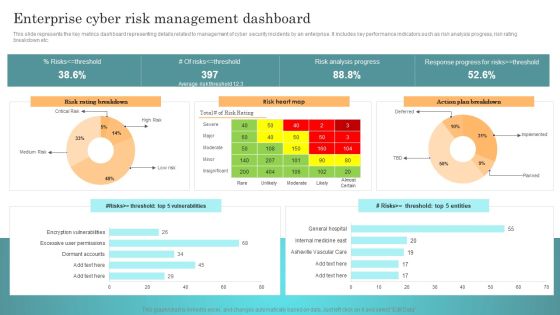
Incident Response Techniques Deployement Enterprise Cyber Risk Management Dashboard Rules PDF
This slide represents the key metrics dashboard representing details related to management of cyber security incidents by an enterprise. It includes key performance indicators such as risk analysis progress, risk rating breakdown etc. Find highly impressive Incident Response Techniques Deployement Enterprise Cyber Risk Management Dashboard Rules PDF on Slidegeeks to deliver a meaningful presentation. You can save an ample amount of time using these presentation templates. No need to worry to prepare everything from scratch because Slidegeeks experts have already done a huge research and work for you. You need to download Incident Response Techniques Deployement Enterprise Cyber Risk Management Dashboard Rules PDF for your upcoming presentation. All the presentation templates are 100 percent editable and you can change the color and personalize the content accordingly. Download now.
Mitigating Sales Risks With Strategic Action Planning Assessing Impact Of Sales Risk Management Diagrams PDF
The following slide highlights some key performance indicators KPIs to measure the influence of executing sales risk management strategies on revenue performance. It includes elements such as target attainment rate, gross profit, annual growth rate etc. If you are looking for a format to display your unique thoughts, then the professionally designed Mitigating Sales Risks With Strategic Action Planning Assessing Impact Of Sales Risk Management Diagrams PDF is the one for you. You can use it as a Google Slides template or a PowerPoint template. Incorporate impressive visuals, symbols, images, and other charts. Modify or reorganize the text boxes as you desire. Experiment with shade schemes and font pairings. Alter, share or cooperate with other people on your work. Download Mitigating Sales Risks With Strategic Action Planning Assessing Impact Of Sales Risk Management Diagrams PDF and find out how to give a successful presentation. Present a perfect display to your team and make your presentation unforgettable.

Implementing Effective Ecommerce Managemnet Platform Impact Of Ecommerce Management System Introduction PDF
This slide represents the key performance indicators to measure the impact of ecommerce management system on ecommerce business operations. It includes KPIs to such as average order value, gross profit, conversion rate, shopping cart abandonment rate, shopping cart conversion rate etc. Formulating a presentation can take up a lot of effort and time, so the content and message should always be the primary focus. The visuals of the PowerPoint can enhance the presenters message, so our Implementing Effective Ecommerce Managemnet Platform Impact Of Ecommerce Management System Introduction PDF was created to help save time. Instead of worrying about the design, the presenter can concentrate on the message while our designers work on creating the ideal templates for whatever situation is needed. Slidegeeks has experts for everything from amazing designs to valuable content, we have put everything into Implementing Effective Ecommerce Managemnet Platform Impact Of Ecommerce Management System Introduction PDF
Managing Organization Finance Financial Analysis Of The Companys Capital Structure Ppt Icon Show PDF
Presenting this set of slides with name managing organization finance financial analysis of the companys capital structure ppt icon show pdf. This is a six stage process. The stages in this process are value of beta less than one indicates a stocks risk less than market risk, rate of return require for an equity investment, rate of amount a company pays on its current debt. This is a completely editable PowerPoint presentation and is available for immediate download. Download now and impress your audience.

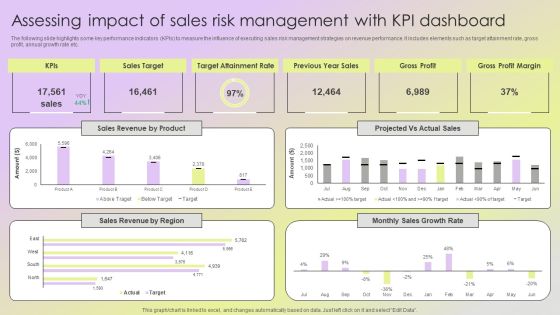
Assessing Impact Of Sales Risk Management With Kpi Dashboard Diagrams PDF
The following slide highlights some key performance indicators KPIs to measure the influence of executing sales risk management strategies on revenue performance. It includes elements such as target attainment rate, gross profit, annual growth rate etc. Boost your pitch with our creative Assessing Impact Of Sales Risk Management With Kpi Dashboard Diagrams PDF. Deliver an awe inspiring pitch that will mesmerize everyone. Using these presentation templates you will surely catch everyones attention. You can browse the ppts collection on our website. We have researchers who are experts at creating the right content for the templates. So you do not have to invest time in any additional work. Just grab the template now and use them.

Dashboard To Track Supplier Quality Performance Vendor Management Program For Supplier Infographics PDF
This slide indicates the dashboard to track supplier performance with multiple metrices such as supplier with least and most complaints, month wise product defects and late deliveries, complaints categorization along with details of amount spend by suppliers.Boost your pitch with our creative Dashboard To Track Supplier Quality Performance Vendor Management Program For Supplier Infographics PDF. Deliver an awe-inspiring pitch that will mesmerize everyone. Using these presentation templates you will surely catch everyones attention. You can browse the ppts collection on our website. We have researchers who are experts at creating the right content for the templates. So you do not have to invest time in any additional work. Just grab the template now and use them.
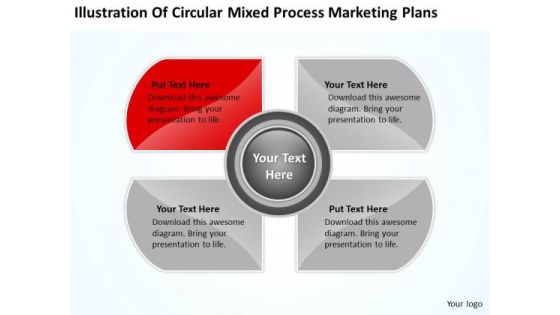
Circular Mixed Process Marketing Plans Ppt Laundromat Business PowerPoint Templates
We present our circular mixed process marketing plans ppt laundromat business PowerPoint templates.Download our Process and Flows PowerPoint Templates because our PowerPoint Templates and Slides will give your ideas the shape. Use our Flow Charts PowerPoint Templates because Our PowerPoint Templates and Slides are effectively colour coded to prioritise your plans They automatically highlight the sequence of events you desire. Download and present our Business PowerPoint Templates because It will get your audience in sync. Present our Marketing PowerPoint Templates because Our PowerPoint Templates and Slides will generate and maintain the level of interest you desire. They will create the impression you want to imprint on your audience. Use our Shapes PowerPoint Templates because you should once Tap the ingenuity of our PowerPoint Templates and Slides. They are programmed to succeed.Use these PowerPoint slides for presentations relating to Flow, process, step, business, concept, vector, success, diagram, circle, graphic, idea, development, management, illustration, circular, system, strategy, round, research, center, direction, method, quality, mix, indicator. The prominent colors used in the PowerPoint template are Red, Gray, White.

Mixed Process Marketing Plans Ppt Business Template Free PowerPoint Slides
We present our mixed process marketing plans ppt business template free PowerPoint Slides.Download our Process and Flows PowerPoint Templates because Our PowerPoint Templates and Slides will let you Leave a lasting impression to your audiences. They possess an inherent longstanding recall factor. Download our Flow Charts PowerPoint Templates because You have the co-ordinates for your destination of success. Let our PowerPoint Templates and Slides map out your journey. Present our Business PowerPoint Templates because our PowerPoint Templates and Slides are the string of your bow. Fire of your ideas and conquer the podium. Download and present our Marketing PowerPoint Templates because Our PowerPoint Templates and Slides are innately eco-friendly. Their high recall value negate the need for paper handouts. Use our Shapes PowerPoint Templates because Our PowerPoint Templates and Slides are designed to help you succeed. They have all the ingredients you need.Use these PowerPoint slides for presentations relating to Flow, process, step, business, concept, vector, success, diagram, circle, graphic, idea, development, management, illustration, circular, system, strategy, round, research, center, direction, method, quality, mix, indicator. The prominent colors used in the PowerPoint template are Blue, Gray, White.

Ppt Continous Mobile Marketing PowerPoint Presentation Process Using 8 Stages Templates
PPT continous mobile marketing powerpoint presentation process using 8 stages Templates-This diagram representing steps or actions in a process with the help of linear arrows. This diagram depict process stages in a more understandable and vivid manner. Linear arrows are used to emphasize direction of movement and interconnections of stages in a flow.-PPT continous mobile marketing powerpoint presentation process using 8 stages Templates-Aim, Arrow, Badge, Border, Color, Connection, Curve, Design, Direction, Download, Icon, Illustration, Indicator, Internet, Label, Link, Magenta, Mark, Next, Object, Orientation, Paper, Peeling, Pointer, Rounded, Set, Shadow, Shape, Sign
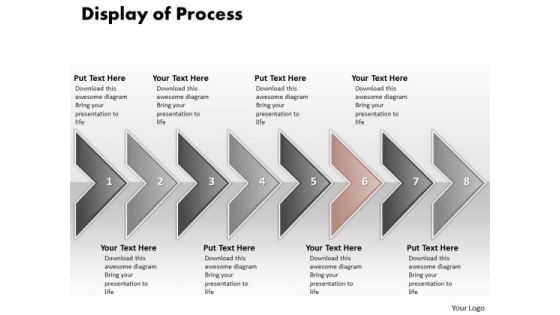
Ppt Display Of Marketing Process Using 8 Power Point Stage PowerPoint Templates
PPT display of marketing process using 8 power point stage PowerPoint Templates-This Diagram is used to illustrate how information will move between interrelated systems in the accomplishment of a given function, task or process. The visual description of this information flow with each given level showing how data is fed into a given process step and subsequently passed along at the completion of that step.-PPT display of marketing process using 8 power point stage PowerPoint Templates-Aim, Arrow, Badge, Border, Color, Connection, Curve, Design, Direction, Download, Icon, Illustration, Indicator, Internet, Label, Link, Magenta, Mark, Next, Object, Orientation, Paper, Peeling, Pointer, Rounded, Set, Shadow, Shape, Sign
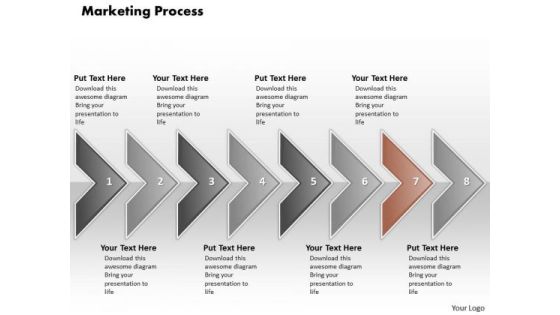
Ppt Illustration Of Marketing Process Using 8 State Diagram PowerPoint Templates
PPT illustration of marketing process using 8 state diagram PowerPoint Templates-This Diagram is used to illustrate how information will move between interrelated systems in the accomplishment of a given function, task or process. The visual description of this information flow with each given level showing how data is fed into a given process step and subsequently passed along at the completion of that step.-PPT illustration of marketing process using 8 state diagram PowerPoint Templates-Aim, Arrow, Badge, Border, Color, Connection, Curve, Design, Direction, Download, Icon, Illustration, Indicator, Internet, Label, Link, Magenta, Mark, Next, Object, Orientation, Paper, Peeling, Pointer, Rounded, Set, Shadow, Shape, Sign

Ppt Continuous Implementation Of 8 PowerPoint Slide Numbers Required Process Templates
PPT continuous implementation of 8 powerpoint slide numbers required process Templates-This image clearly defines the concept of program flow plans that can be used to illustrate activities. You can use this diagram for the description of those business processes that describe the functionality of the business system. Create captivating presentations to deliver comparative and weighted arguments.-PPT continuous implementation of 8 powerpoint slide numbers required process Templates-Aim, Arrow, Badge, Border, Color, Connection, Curve, Design, Direction, Download, Icon, Illustration, Indicator, Internet, Label, Link, Magenta, Mark, Next, Object, Orientation, Paper, Peeling, Pointer, Rounded, Set, Shadow, Shape, Sign

Ppt Continuous Implementation Of 8 Steps Live Connections To Process PowerPoint Templates
PPT continuous implementation of 8 steps live connections to process PowerPoint Templates-This image clearly defines the concept of program flow plans that can be used to illustrate activities. You can use this diagram for the description of those business processes that describe the functionality of the business system. Create captivating presentations to deliver comparative and weighted arguments.-PPT continuous implementation of 8 steps live connections to process PowerPoint Templates-Aim, Arrow, Badge, Border, Color, Connection, Curve, Design, Direction, Download, Icon, Illustration, Indicator, Internet, Label, Link, Magenta, Mark, Next, Object, Orientation, Paper, Peeling, Pointer, Rounded, Set, Shadow, Shape, Sign
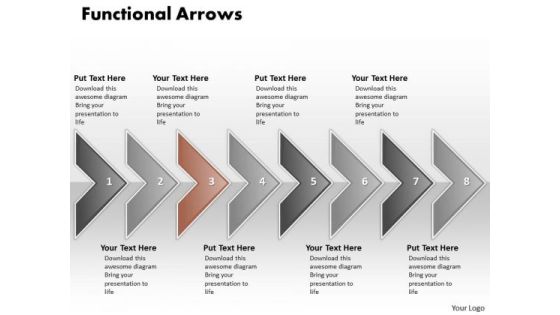
Ppt Increasing Functions Of International Marketing PowerPoint Slides Process 1 Templates
PPT increasing functions of international marketing powerpoint slides process 1 Templates-This diagram helps to shows different processes or objects that live simultaneously, as horizontal arrows, the messages exchanged between them, in the order in which they occur. This allows the specification of simple runtime scenarios in a graphical manner. Our PPT image is so ideally designed that helps you to make your presentation logical and interesting -PPT increasing functions of international marketing powerpoint slides process 1 Templates-Aim, Arrow, Badge, Border, Color, Connection, Curve, Design, Direction, Download, Icon, Illustration, Indicator, Internet, Label, Link, Magenta, Mark, Next, Object, Orientation, Paper, Peeling, Pointer, Rounded, Set, Shadow, Shape, Sign
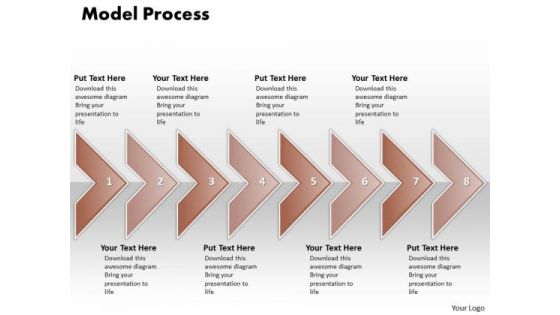
Ppt Model Of Social Presentation Process Using 5 Stages PowerPoint Templates
PPT model of social presentation process using 5 stages PowerPoint Templates-Create dynamic Microsoft office PPT Presentations with our professional templates containing a graphic of curved arrows. This Diagram is mainly used to depict the progress of sequential steps in the flow or process. It is a powerful tool conceived to enable you to define your message more clearly in your PPT presentations. -PPT model of social presentation process using 5 stages PowerPoint Templates-Aim, Arrow, Badge, Border, Color, Connection, Curve, Design, Direction, Download, Icon, Illustration, Indicator, Internet, Label, Link, Magenta, Mark, Next, Object, Orientation, Paper, Peeling, Pointer, Rounded, Set, Shadow, Shape, Sign
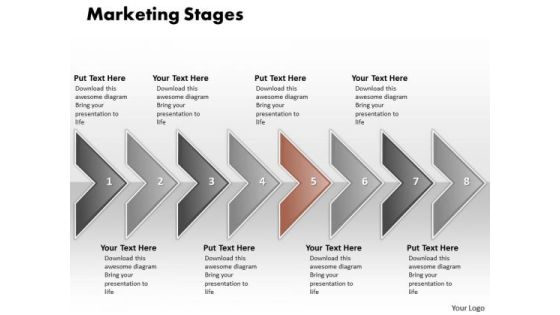
Ppt Stages Of How To Create Social Media PowerPoint Presentation Process Templates
PPT stages of how to create social media powerpoint presentation process Templates-Visually support your Microsoft office PPT Presentation with our above template illustrating arrows as steps. This sequent diagram is a kind of interaction diagram that shows how processes operate with one another and in what order. Deliver amazing presentations with confidence, competence and clarity.-PPT stages of how to create social media powerpoint presentation process Templates-Aim, Arrow, Badge, Border, Color, Connection, Curve, Design, Direction, Download, Icon, Illustration, Indicator, Internet, Label, Link, Magenta, Mark, Next, Object, Orientation, Paper, Peeling, Pointer, Rounded, Set, Shadow, Shape, Sign
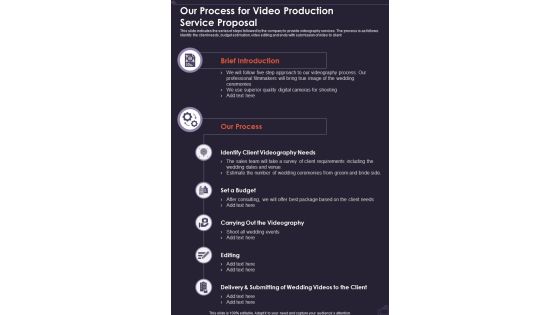
Our Process For Video Production Service Proposal One Pager Sample Example Document
This slide indicates the series of steps followed by the company to provide videography services. The process is as follows Identify the client needs, budget estimation, video editing and ends with submission of video to client. Presenting you an exemplary Our Process For Video Production Service Proposal One Pager Sample Example Document. Our one-pager comprises all the must-have essentials of an inclusive document. You can edit it with ease, as its layout is completely editable. With such freedom, you can tweak its design and other elements to your requirements. Download this Our Process For Video Production Service Proposal One Pager Sample Example Document brilliant piece now.

Corresponding Plans To Decrease Employee Turnover Rate Ideas PDF
This slide represents the parallel plans for increasing employees retention rate and their job satisfaction levels. It includes two plans such as training and development programs and work life balance. Persuade your audience using this Corresponding Plans To Decrease Employee Turnover Rate Ideas PDF. This PPT design covers two stages, thus making it a great tool to use. It also caters to a variety of topics including Development Programs, Encourage Employees, Performance Indicator. Download this PPT design now to present a convincing pitch that not only emphasizes the topic but also showcases your presentation skills.

Kaizen Process Report With Improvement Metrics Ppt PowerPoint Presentation File Icons PDF
This slide focuses on the kaizen event report which covers process owner, key performance indicators, summary, problem description, improvement metrics, goals, daily milestones, team members and other considerations, etc. Pitch your topic with ease and precision using this Kaizen Process Report With Improvement Metrics Ppt PowerPoint Presentation File Icons PDF. This layout presents information on Key Performance Indoctrinator, Improvement Goal, Improvement Metric. It is also available for immediate download and adjustment. So, changes can be made in the color, design, graphics or any other component to create a unique layout.

Recruitment Metrics For Data Driven Selection Process Ppt PowerPoint Presentation Inspiration Graphics Download PDF
This slide highlights the key performance indicators to analyze hiring process in organization which includes time to fill, first year attrition rate, cost per hire, candidate job satisfaction and interview to hire ratio. Persuade your audience using this Recruitment Metrics For Data-Driven Selection Process Ppt PowerPoint Presentation Inspiration Graphics Download PDF. This PPT design covers one stage, thus making it a great tool to use. It also caters to a variety of topics including Candidate Job, Satisfaction, Attrition Rate. Download this PPT design now to present a convincing pitch that not only emphasizes the topic but also showcases your presentation skills.

Kpis To Evaluate Applicant Selection Process Ppt PowerPoint Presentation File Introduction PDF
This slide shows key performance indicators to evaluate the efficiency of applicant selection process. It includes various metrics such as hiring, sourcing channel efficiency, number of qualified candidates, etc. Showcasing this set of slides titled Kpis To Evaluate Applicant Selection Process Ppt PowerPoint Presentation File Introduction PDF. The topics addressed in these templates are Metrics, Expected, Actual, Variance. All the content presented in this PPT design is completely editable. Download it and make adjustments in color, background, font etc. as per your unique business setting.

KPI Dashboard To Track Sales And Operations Process Of Manufacturing Enterprise Brochure PDF
This slide depicts a dashboard to track the key performance metrics in sales and operations process of a manufacturing enterprise to analyze deviations in the actual and planned output. The key performing indicators are percentage deviation, dollar deviation, inventory in hand etc.Pitch your topic with ease and precision using this KPI Dashboard To Track Sales And Operations Process Of Manufacturing Enterprise Brochure PDF. This layout presents information on Planned Output, Yearly Growth, Inventory Hand. It is also available for immediate download and adjustment. So, changes can be made in the color, design, graphics or any other component to create a unique layout.

Clinical Trial Phases With Number Of Participating Institutions New Clinical Drug Trial Process Topics PDF
This slide indicates the information regarding the multiple stages of the clinical trial process such as the number of participants, the cost involved, and the time required to complete each phase. Want to ace your presentation in front of a live audience Our Clinical Trial Phases With Number Of Participating Institutions New Clinical Drug Trial Process Topics PDF can help you do that by engaging all the users towards you. Slidegeeks experts have put their efforts and expertise into creating these impeccable powerpoint presentations so that you can communicate your ideas clearly. Moreover, all the templates are customizable, and easy-to-edit and downloadable. Use these for both personal and commercial use.
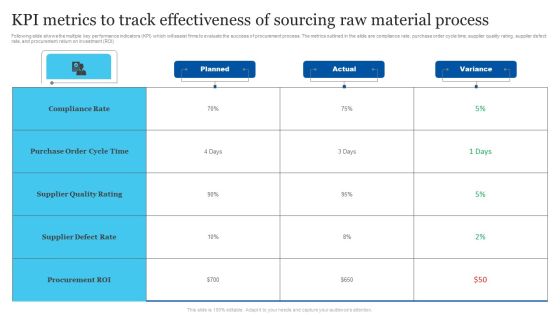
KPI Metrics To Track Effectiveness Of Sourcing Raw Material Process Portrait PDF
Following slide shows the multiple key performance indicators KPI which will assist firms to evaluate the success of procurement process. The metrics outlined in the slide are compliance rate, purchase order cycle time, supplier quality rating, supplier defect rate, and procurement return on investment ROI. Pitch your topic with ease and precision using this KPI Metrics To Track Effectiveness Of Sourcing Raw Material Process Portrait PDF. This layout presents information on Purchase Order Cycle Time, Supplier Defect Rate, Procurement Roi. It is also available for immediate download and adjustment. So, changes can be made in the color, design, graphics or any other component to create a unique layout.
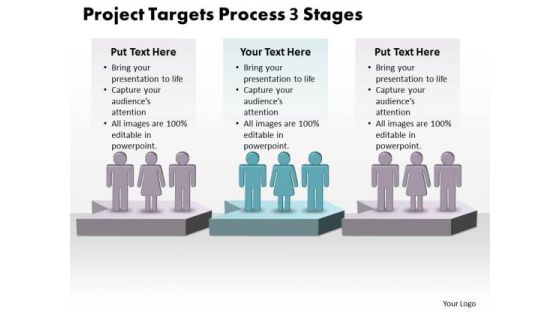
Sales Ppt Project Targets Process 3 Power Point Stage Business Plan PowerPoint Graphic
We present our sales PPT project targets process 3 power point stage business plan Powerpoint Graphic. Use our People PowerPoint Templates because, There are various viable propositions available to further your commercial interests. Use our Arrows PowerPoint Templates because, to go forgold and not just silver. Use our Communication PowerPoint Templates because; Use our templates for your colleagues knowledge to feed. Use our Teamwork PowerPoint Templates because, Clarity of thought has been the key to your growth. Use our Marketing PowerPoint Templates because, they are indicators of the path you have in mind. Use these PowerPoint slides for presentations relating to Business,
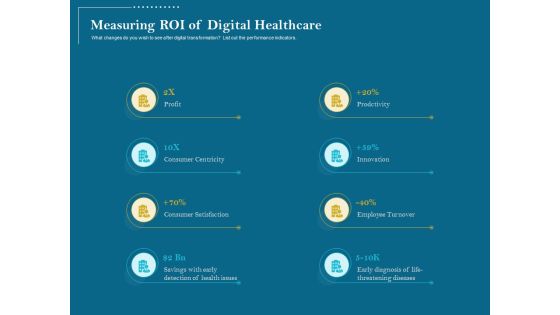
Utilizing Cyber Technology For Change Process Measuring ROI Of Digital Healthcare Formats PDF
What changes do you wish to see after digital transformation List out the performance indicators. This is a utilizing cyber technology for change process measuring roi of digital healthcare formats pdf template with various stages. Focus and dispense information on eight stages using this creative set, that comes with editable features. It contains large content boxes to add your information on topics like profit, consumer centricity, consumer satisfaction, savings with early detection of health issues, prodctivity, innovation, employee turnover, early diagnosis of life-threatening diseases. You can also showcase facts, figures, and other relevant content using this PPT layout. Grab it now.

User Onboarding Process Development Key Objectives Set By The Company Download PDF
This slide provides the major objectives set by the company to measure the teams performance. Key KPIs key performance Indicators covered in the slide are number of customers, customer churn rate, customer retention rate etc. Deliver and pitch your topic in the best possible manner with this User Onboarding Process Development Key Objectives Set By The Company Download PDF. Use them to share invaluable insights on customer churn rate, customer retention rate, target and impress your audience. This template can be altered and modified as per your expectations. So, grab it now.
Instigating Efficient Value Process Vendors Selection Factors And Kpis Icons PDF
Following slide illustrates vendor selection factors along with their key performance indicators. Selection factors covered are strategic commitment, capability and ability to meet requirement. Presenting instigating efficient value process vendors selection factors and kpis icons pdf to provide visual cues and insights. Share and navigate important information on five stages that need your due attention. This template can be used to pitch topics like strategic commitment, requirement, capability. In addtion, this PPT design contains high resolution images, graphics, etc, that are easily editable and available for immediate download.

Social Media Hiring Process Optimization Kpis To Measure Social Media Recruitment Success Sample PDF
This slide focuses on key performance indicators to measure social media recruitment success which includes time to hire, recruitment costs, age of applicants, recruitment funnel, ratio of male and female.Deliver and pitch your topic in the best possible manner with this social media hiring process optimization kpis to measure social media recruitment success sample pdf Use them to share invaluable insights on kpis to measure social media recruitment success and impress your audience. This template can be altered and modified as per your expectations. So, grab it now.

Tactical Process For Social Kpis To Measure Social Media Recruitment Success Demonstration PDF
This slide focuses on key performance indicators to measure social media recruitment success which includes time to hire, recruitment costs, age of applicants, recruitment funnel, ratio of male and female. Deliver an awe inspiring pitch with this creative Tactical Process For Social Kpis To Measure Social Media Recruitment Success Demonstration PDF bundle. Topics like Male Female Ratio, Recruitment Funnel, Number Applicants can be discussed with this completely editable template. It is available for immediate download depending on the needs and requirements of the user.
Robotic Process Automation Shipping And Logistics Tracking Dashboard With Shipments Clipart PDF
This slide covers Key performance indicators to track the automation system of the company. This dashboard includes Logistics Efficiency Status, delivery time accuracy etc. If your project calls for a presentation, then Slidegeeks is your go-to partner because we have professionally designed, easy-to-edit templates that are perfect for any presentation. After downloading, you can easily edit Robotic Process Automation Shipping And Logistics Tracking Dashboard With Shipments Clipart PDF and make the changes accordingly. You can rearrange slides or fill them with different images. Check out all the handy templates

Leveraging Predictive Maintenance To Enhance Production Process Impact Of Maintenance Strategy Production Plant Graphics PDF
This slide indicates the impact of preventive maintenance strategy on production plant operational efficiency in terms of low maintenance cost, early detection of malfunctions, reduction in downtime, increased equipment lifespan and increased machine safety and reliability From laying roadmaps to briefing everything in detail, our templates are perfect for you. You can set the stage with your presentation slides. All you have to do is download these easy-to-edit and customizable templates. Leveraging Predictive Maintenance To Enhance Production Process Impact Of Maintenance Strategy Production Plant Graphics PDF will help you deliver an outstanding performance that everyone would remember and praise you for. Do download this presentation today.
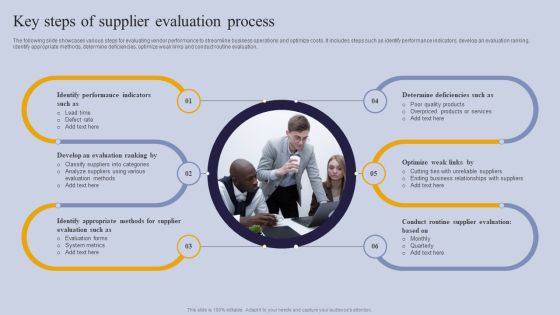
Vendor Performance Analysis And Administration Key Steps Of Supplier Evaluation Process Structure PDF
The following slide showcases various steps for evaluating vendor performance to streamline business operations and optimize costs. It includes steps such as identify performance indicators, develop an evaluation ranking, identify appropriate methods, determine deficiencies, optimize weak links and conduct routine evaluation. There are so many reasons you need a Vendor Performance Analysis And Administration Key Steps Of Supplier Evaluation Process Structure PDF. The first reason is you cannot spend time making everything from scratch, Thus, Slidegeeks has made presentation templates for you too. You can easily download these templates from our website easily.
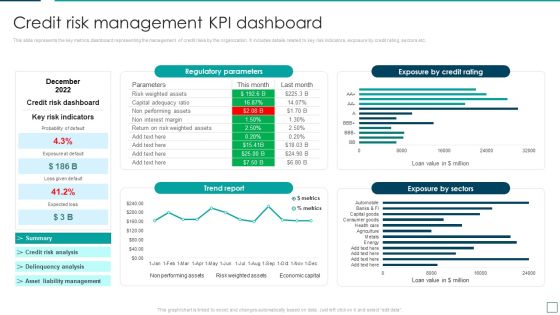
Strategic Risk Management And Mitigation Plan Credit Risk Management Kpi Dashboard Formats PDF
This slide represents the key metrics dashboard representing the management of credit risks by the organization. It includes details related to key risk indicators, exposure by credit rating, sectors etc. Get a simple yet stunning designed Strategic Risk Management And Mitigation Plan Credit Risk Management Kpi Dashboard Formats PDF. It is the best one to establish the tone in your meetings. It is an excellent way to make your presentations highly effective. So, download this PPT today from Slidegeeks and see the positive impacts. Our easy to edit Strategic Risk Management And Mitigation Plan Credit Risk Management Kpi Dashboard Formats PDF can be your go to option for all upcoming conferences and meetings. So, what are you waiting for Grab this template today.
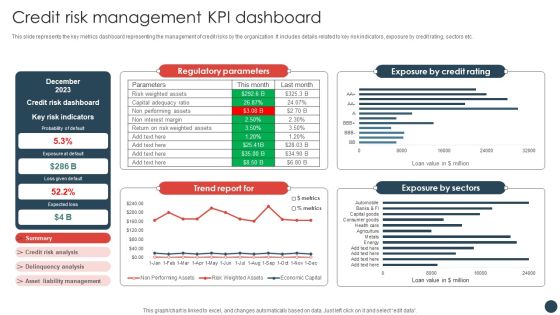
Strategic Risk Management Plan Credit Risk Management KPI Dashboard Information PDF
This slide represents the key metrics dashboard representing the management of credit risks by the organization. It includes details related to key risk indicators, exposure by credit rating, sectors etc.Coming up with a presentation necessitates that the majority of the effort goes into the content and the message you intend to convey. The visuals of a PowerPoint presentation can only be effective if it supplements and supports the story that is being told. Keeping this in mind our experts created Strategic Risk Management Plan Credit Risk Management KPI Dashboard Information PDF to reduce the time that goes into designing the presentation. This way, you can concentrate on the message while our designers take care of providing you with the right template for the situation.
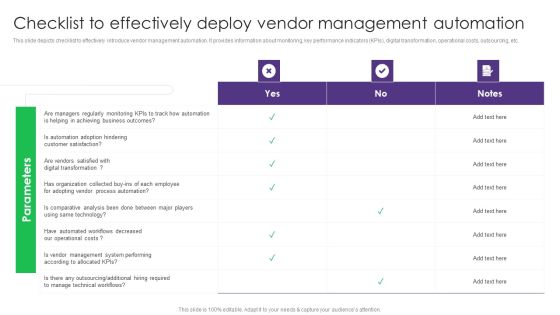
Vendor Management System Deployment Checklist To Effectively Deploy Vendor Management Automation Ideas PDF
This slide depicts checklist to effectively introduce vendor management automation. It provides information about monitoring, key performance indicators KPIs, digital transformation, operational costs, outsourcing, etc. Do you know about Slidesgeeks Vendor Management System Deployment Checklist To Effectively Deploy Vendor Management Automation Ideas PDF These are perfect for delivering any kind od presentation. Using it, create PowerPoint presentations that communicate your ideas and engage audiences. Save time and effort by using our pre-designed presentation templates that are perfect for a wide range of topic. Our vast selection of designs covers a range of styles, from creative to business, and are all highly customizable and easy to edit. Download as a PowerPoint template or use them as Google Slides themes.
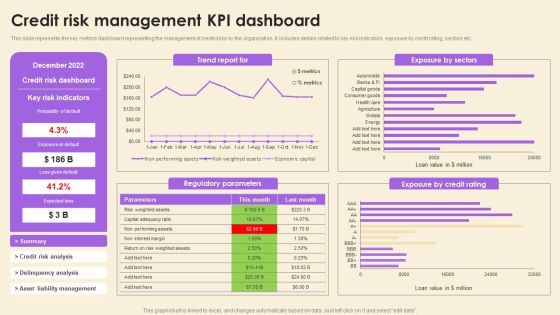
Operational Risk Assessment And Management Plan Credit Risk Management KPI Dashboard Guidelines PDF
This slide represents the key metrics dashboard representing the management of credit risks by the organization. It includes details related to key risk indicators, exposure by credit rating, sectors etc. Present like a pro with Operational Risk Assessment And Management Plan Credit Risk Management KPI Dashboard Guidelines PDF Create beautiful presentations together with your team, using our easy-to-use presentation slides. Share your ideas in real-time and make changes on the fly by downloading our templates. So whether you are in the office, on the go, or in a remote location, you can stay in sync with your team and present your ideas with confidence. With Slidegeeks presentation got a whole lot easier. Grab these presentations today.

Implementing An Effective Ecommerce Management Framework Impact Of Ecommerce Management System Post Implementation Structure PDF
This slide represents the key performance indicators to measure the impact of ecommerce management system on ecommerce business operations. It includes KPIs to such as average order value, gross profit, conversion rate, shopping cart abandonment rate, shopping cart conversion rate etc. Coming up with a presentation necessitates that the majority of the effort goes into the content and the message you intend to convey. The visuals of a PowerPoint presentation can only be effective if it supplements and supports the story that is being told. Keeping this in mind our experts created Implementing An Effective Ecommerce Management Framework Impact Of Ecommerce Management System Post Implementation Structure PDF to reduce the time that goes into designing the presentation. This way, you can concentrate on the message while our designers take care of providing you with the right template for the situation.
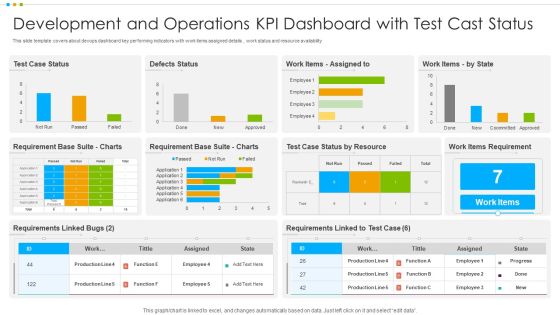
Development And Operations KPI Dashboard With Test Cast Status Graphics PDF
This slide template covers about devops dashboard key performing indicators with work items assigned details , work status and resource availability.Pitch your topic with ease and precision using this Development And Operations KPI Dashboard With Test Cast Status Graphics PDF This layout presents information on Items Requirement, Requirement Base, Assigned It is also available for immediate download and adjustment. So, changes can be made in the color, design, graphics or any other component to create a unique layout.
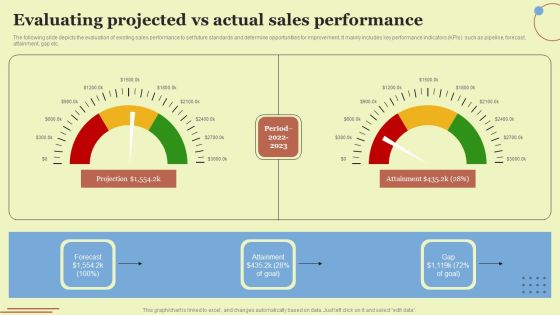
Evaluating Projected Vs Actual Sales Performance Diagrams PDF
The following slide depicts the evaluation of existing sales performance to set future standards and determine opportunities for improvement. It mainly includes key performance indicators KPIs such as pipeline, forecast, attainment, gap etc. There are so many reasons you need a Evaluating Projected Vs Actual Sales Performance Diagrams PDF. The first reason is you can not spend time making everything from scratch, Thus, Slidegeeks has made presentation templates for you too. You can easily download these templates from our website easily.

Business Coaching Drivers Of Employee Turnover Content Ppt PowerPoint Presentation Summary Infographics PDF
Presenting this set of slides with name business coaching drivers of employee turnover content ppt powerpoint presentation summary infographics pdf. This is a ten stage process. The stages in this process are job content, ext environment, co worker, work satisfaction, compensation, job satisfaction, leadership, indicators, demographic, stress. This is a completely editable PowerPoint presentation and is available for immediate download. Download now and impress your audience.
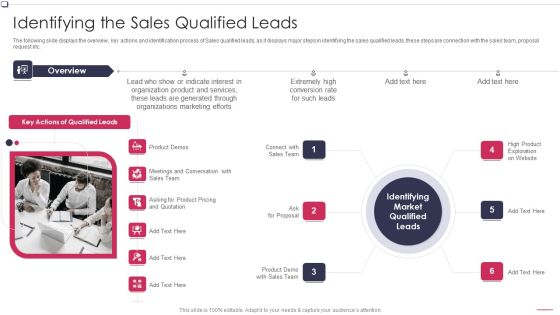
Identifying The Sales Qualified Leads Business To Business Promotion Sales Lead Rules PDF
The following slide displays the overview, key actions and identification process of Sales qualified leads, as it displays major steps in identifying the sales qualified leads, these steps are connection with the sales team, proposal request etc.Presenting Identifying The Sales Qualified Leads Business To Business Promotion Sales Lead Rules PDF to provide visual cues and insights. Share and navigate important information on one stage that need your due attention. This template can be used to pitch topics like Indicate Interest, Organization Product, Generated Through In addtion, this PPT design contains high resolution images, graphics, etc, that are easily editable and available for immediate download.

Components Of Employee Performance Optimization Strategy Information PDF
This slide mentions the components of performance improvement process for employees. It includes areas of concern, goals, metrics and scheduled checkpoints.Persuade your audience using this Components Of Employee Performance Optimization Strategy Information PDF. This PPT design covers five stages, thus making it a great tool to use. It also caters to a variety of topics including Instances Performance, Measuring Indicators, Expected Actions. Download this PPT design now to present a convincing pitch that not only emphasizes the topic but also showcases your presentation skills.
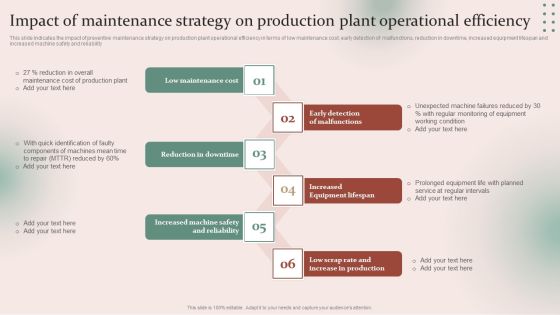
Strategies For Effective Manufacturing Impact Of Maintenance Strategy On Production Plant Rules PDF
This slide indicates the impact of preventive maintenance strategy on production plant operational efficiency in terms of low maintenance cost, early detection of malfunctions, reduction in downtime, increased equipment lifespan and increased machine safety and reliability. Take your projects to the next level with our ultimate collection of Strategies For Effective Manufacturing Impact Of Maintenance Strategy On Production Plant Rules PDF. Slidegeeks has designed a range of layouts that are perfect for representing task or activity duration, keeping track of all your deadlines at a glance. Tailor these designs to your exact needs and give them a truly corporate look with your own brand colors theyll make your projects stand out from the rest.

Key Tactics For Online Media Buying Journey Ppt PowerPoint Presentation File Master Slide PDF
Presenting key tactics for online media buying journey ppt powerpoint presentation file master slide pdf to dispense important information. This template comprises one stages. It also presents valuable insights into the topics including discover audience, developing key performance indicators, selecting platforms. This is a completely customizable PowerPoint theme that can be put to use immediately. So, download it and address the topic impactfully.
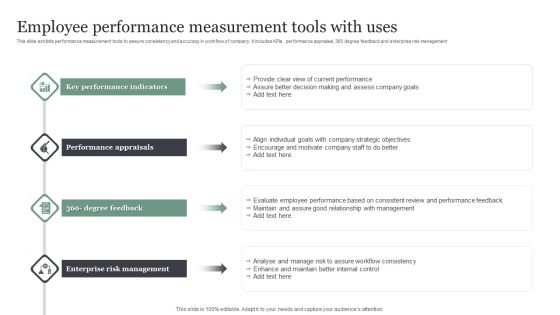
Employee Performance Measurement Tools With Uses Microsoft PDF
This slide exhibits performance measurement tools to assure consistency and accuracy in workflow of company. It includes KPIs, performance appraisal, 360 degree feedback and enterprise risk management. Presenting Employee Performance Measurement Tools With Uses Microsoft PDF to dispense important information. This template comprises four stages. It also presents valuable insights into the topics including Performance Appraisals, Key Performance Indicators, Enterprise Risk Management. This is a completely customizable PowerPoint theme that can be put to use immediately. So, download it and address the topic impactfully.

Business Product Strategy With Focus On Benefits Ppt PowerPoint Presentation Ideas Layouts
Presenting this set of slides with name business product strategy with focus on benefits ppt powerpoint presentation ideas layouts. This is a eight stage process. The stages in this process are indicate why product or service needed, focus on benefits, experience, expertise and allocates, special offerings of your product and services, highlight features, clear and concise, communication in laymen terms, customer oriented. This is a completely editable PowerPoint presentation and is available for immediate download. Download now and impress your audience.

Stages To Set Up An Operational Plan Ppt PowerPoint Presentation Professional Template PDF
Presenting this set of slides with name stages to set up an operational plan ppt powerpoint presentation professional template pdf. This is a five stage process. The stages in this process are hand over, one pager, crew talk, boardwalk, business review, report of key performance indicators, daily issues, opportunities, daily scheduled field where senior hear and respond, team review of recent data trends. This is a completely editable PowerPoint presentation and is available for immediate download. Download now and impress your audience.

COVID 19 Mitigating Impact On High Tech Industry COVID 19 Supply Chain Disruption Assessment Mockup PDF
Presenting this set of slides with name covid 19 mitigating impact on high tech industry covid 19 supply chain disruption assessment mockup pdf. This is a four stage process. The stages in this process are identify suppliers and key points failure, speak logistics providers to understand mitigation plans, analyzed, current inventory, cover and modelled stock scenarios based supplier delay, warning indicators, business failures. This is a completely editable PowerPoint presentation and is available for immediate download. Download now and impress your audience.
 Home
Home