Score Comparison
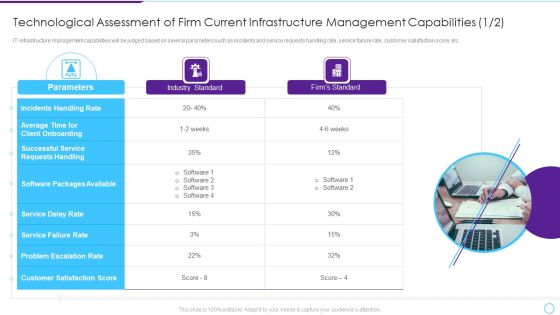
Technological Assessment Of Firm Current Infrastructure Management Capabilities Professional PDF
IT infrastructure management capabilities will be judged based on several parameters such as incidents and service requests handling rate, service failure rate, customer satisfaction score, etc. This is a Technological Assessment Of Firm Current Infrastructure Management Capabilities Professional PDF template with various stages. Focus and dispense information on three stages using this creative set, that comes with editable features. It contains large content boxes to add your information on topics like Parameters, Industry Standard, Firms Standard, Software Packages Available. You can also showcase facts, figures, and other relevant content using this PPT layout. Grab it now.

Monthly Employee Performance Review Report Form Sample PDF
The following slide outlines a comprehensive report form which can be used by the manager to review the employee performance on a monthly basis. It covers information about key performance indicators KPIs, description, total and actual score, and action plan. Pitch your topic with ease and precision using this Monthly Employee Performance Review Report Form Sample PDF. This layout presents information on Teamwork, Work Ethics, Work Efficiency. It is also available for immediate download and adjustment. So, changes can be made in the color, design, graphics or any other component to create a unique layout.

IT Security Risk Management Dashboard With Risk Rating And Breakdown Pictures PDF
This slide displays dashboard for real- time tracking and management of cybersecurity risk to help company formulate appropriate mitigation strategies. It includes kpis such as response plan progress, heat map, action plan, top 5 vulnerabilities, etc. Pitch your topic with ease and precision using this IT Security Risk Management Dashboard With Risk Rating And Breakdown Pictures PDF. This layout presents information on Risk Rating Breakdown, Action Plan Breakdown, Risk Probability Score, Risk Analysis Progress. It is also available for immediate download and adjustment. So, changes can be made in the color, design, graphics or any other component to create a unique layout.
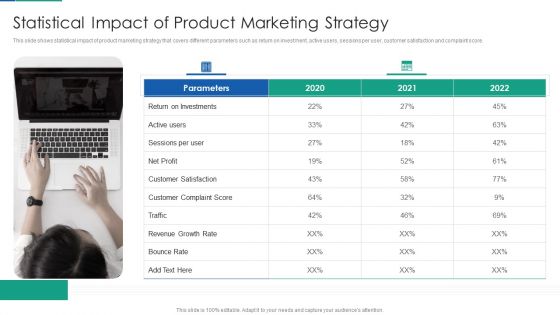
Agile Product Life Process Management Statistical Impact Of Product Marketing Strategy Themes PDF
This slide shows statistical impact of product marketing strategy that covers different parameters such as return on investment, active users, sessions per user, customer satisfaction and complaint score. This is a agile product life process management statistical impact of product marketing strategy themes pdf template with various stages. Focus and dispense information on one stages using this creative set, that comes with editable features. It contains large content boxes to add your information on topics like statistical impact of product marketing strategy . You can also showcase facts, figures, and other relevant content using this PPT layout. Grab it now.

Supplier Association Management Techniques Supplier Rating Scorecard Template Criteria Mockup PDF
This slide covers the supplier rating scorecard including criteria such as quality, service, delivery and price along with self evaluation and internal evaluation scores. This is a supplier association management techniques supplier performance management kpi dashboards guidelines pdf template with various stages. Focus and dispense information on three stages using this creative set, that comes with editable features. It contains large content boxes to add your information on topics like reduction in costs, increased efficiency, increase in profitability. You can also showcase facts, figures, and other relevant content using this PPT layout. Grab it now.
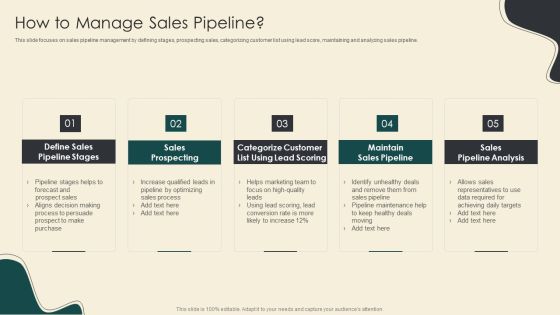
Digitally Streamline Automation Sales Operations How To Manage Sales Pipeline Graphics PDF
This slide focuses on sales pipeline management by defining stages, prospecting sales, categorizing customer list using lead score, maintaining and analyzing sales pipeline. This is a Digitally Streamline Automation Sales Operations How To Manage Sales Pipeline Graphics PDF template with various stages. Focus and dispense information on five stages using this creative set, that comes with editable features. It contains large content boxes to add your information on topics like Sales Prospecting, Maintain Sales Pipeline, Sales Pipeline Analysis. You can also showcase facts, figures, and other relevant content using this PPT layout. Grab it now.
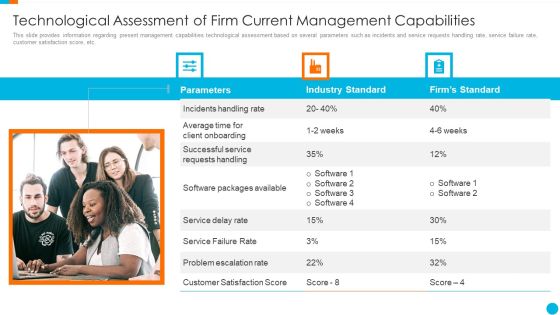
Upgrading Total Project Safety IT Technological Assessment Of Firm Current Management Inspiration PDF
This slide provides information regarding present management capabilities technological assessment based on several parameters such as incidents and service requests handling rate, service failure rate, customer satisfaction score, etc. This is a upgrading total project safety it technological assessment of firm current management inspiration pdf template with various stages. Focus and dispense information on three stages using this creative set, that comes with editable features. It contains large content boxes to add your information on topics like parameters, industry standard, firms standard. You can also showcase facts, figures, and other relevant content using this PPT layout. Grab it now.

Illustrating Product Leadership Plan Incorporating Innovative Techniques Metrics Used To Measure Summary PDF
This slide represents metrics used to measure product team performance that covers product stickiness and usage, feature adoption and retention, net promoter score, product delivery predictability, etc. This is a illustrating product leadership plan incorporating innovative techniques metrics used to measure summary pdf template with various stages. Focus and dispense information on three stages using this creative set, that comes with editable features. It contains large content boxes to add your information on topics like metrics, description, percentage. You can also showcase facts, figures, and other relevant content using this PPT layout. Grab it now.

Assuring Management In Product Innovation To Enhance Processes Metrics Used By Product Leader To Measure Performance Diagrams PDF
This slide focuses on metrics used by product leader to measure performance such as net promoter score, feature adoption, retention rate, churn rate, customer satisfaction, stickiness, etc.Presenting assuring management in product innovation to enhance processes metrics used by product leader to measure performance diagrams pdf to provide visual cues and insights. Share and navigate important information on one stage that need your due attention. This template can be used to pitch topics like percentage of fulfilling, customers that leave, quantifies customer happiness In addtion, this PPT design contains high resolution images, graphics, etc, that are easily editable and available for immediate download.

Corporate Physical Health And Fitness Culture Playbook Physical Wellbeing Team Activities Squats Demonstration PDF
Mentioned slide showcases details about squats exercise that team members can practice for staying physically fit. Sections covered in the slide are activity objective, group size and in-depth details about the exercise. This is a corporate physical health and fitness culture playbook physical wellbeing team activities squats demonstration pdf template with various stages. Focus and dispense information on four stages using this creative set, that comes with editable features. It contains large content boxes to add your information on topics like organizer, equipments, stopwatch, chair optional, group size, duration, scoring. You can also showcase facts, figures, and other relevant content using this PPT layout. Grab it now.
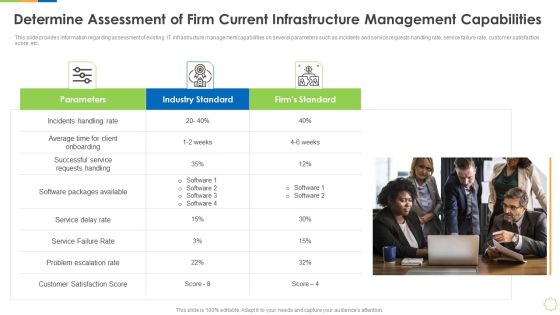
Infrastructure As Code For Devops Growth IT Determine Assessment Of Firm Current Infrastructure Management Capabilities Structure PDF
This slide provides information regarding assessment of existing IT infrastructure management capabilities on several parameters such as incidents and service requests handling rate, service failure rate, customer satisfaction score, etc. This is a infrastructure as code for devops growth it determine assessment of firm current infrastructure management capabilities structure pdf template with various stages. Focus and dispense information on three stages using this creative set, that comes with editable features. It contains large content boxes to add your information on topics like service, parameters, industry standard, escalation. You can also showcase facts, figures, and other relevant content using this PPT layout. Grab it now.
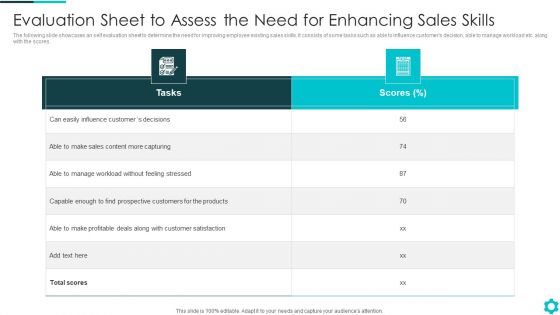
Evaluation Sheet To Assess The Need For Enhancing Sales Skills Template PDF
The following slide showcases an self evaluation sheet to determine the need for improving employee existing sales skills. It consists of some tasks such as able to influence customers decision, able to manage workload etc. along with the scores.Pitch your topic with ease and precision using this Evaluation Sheet To Assess The Need For Enhancing Sales Skills Template PDF This layout presents information on Profitable Deals, Manage Workload, Capable Enough It is also available for immediate download and adjustment. So, changes can be made in the color, design, graphics or any other component to create a unique layout.
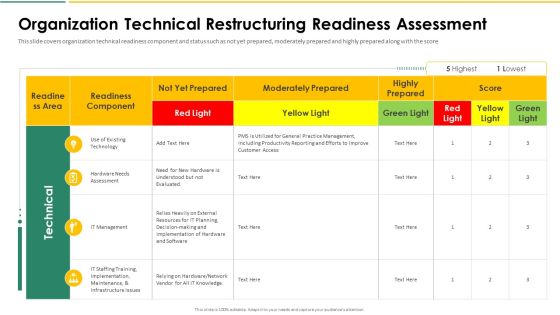
Organization Chart And Corporate Model Transformation Organization Technical Restructuring Graphics PDF
This slide covers organization technical readiness component and status such as not yet prepared, moderately prepared and highly prepared along with the score. Deliver an awe inspiring pitch with this creative organization chart and corporate model transformation organization technical restructuring graphics pdf bundle. Topics like use of existing technology, hardware needs assessment, it management, it staffing training, implementation, maintenance, infrastructure issues can be discussed with this completely editable template. It is available for immediate download depending on the needs and requirements of the user.

Brand Governance Strategy Key Performance Indicators Portrait PDF
The following slide highlights key performance indicators monitoring brand management strategy. It includes KPIs such as top of mind awareness, brand recognition, functional associations, emotive associations, net promoter score, customer satisfaction, website activity, email performance, usage, frequency etc. Pitch your topic with ease and precision using this Brand Governance Strategy Key Performance Indicators Portrait PDF. This layout presents information on Brand Awareness, Brand Associations, Brand Experience . It is also available for immediate download and adjustment. So, changes can be made in the color, design, graphics or any other component to create a unique layout.
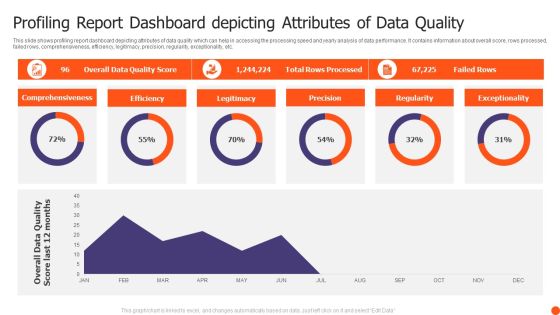
Profiling Report Dashboard Depicting Attributes Of Data Quality Themes PDF
This slide shows profiling report dashboard depicting attributes of data quality which can help in accessing the processing speed and yearly analysis of data performance. It contains information about overall score, rows processed, failed rows, comprehensiveness, efficiency, legitimacy, precision, regularity, exceptionality, etc. Pitch your topic with ease and precision using this Profiling Report Dashboard Depicting Attributes Of Data Quality Themes PDF. This layout presents information on Comprehensiveness, Efficiency, Legitimacy, Precision. It is also available for immediate download and adjustment. So, changes can be made in the color, design, graphics or any other component to create a unique layout.

Deliver Efficiency Innovation Metrics Used By Product Leader To Measure Performance Microsoft PDF
This slide focuses on metrics used by product leader to measure performance such as net promoter score, feature adoption, retention rate, churn rate, customer satisfaction, stickiness, etc. Deliver and pitch your topic in the best possible manner with this Deliver Efficiency Innovation Metrics Used By Product Leader To Measure Performance Microsoft PDF. Use them to share invaluable insights on Feature Adoption, Churn Rate, Customer Satisfaction, Conversion Rate and impress your audience. This template can be altered and modified as per your expectations. So, grab it now.
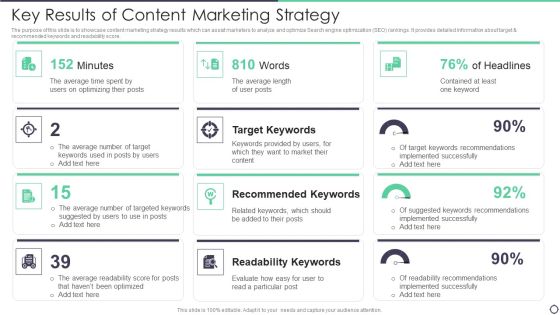
Key Results Of Content Marketing Strategy Background PDF
The purpose of this slide is to showcase content marketing strategy results which can assist marketers to analyze and optimize Search engine optimization SEO rankings. It provides detailed information about target and recommended keywords and readability score. Pitch your topic with ease and precision using this Key Results Of Content Marketing Strategy Background PDF. This layout presents information on Average, Target Keywords, Readability Keywords. It is also available for immediate download and adjustment. So, changes can be made in the color, design, graphics or any other component to create a unique layout.

Real Time Analytics Dashboard To Measure Marketing Campaign Performance Information PDF
The purpose of this slide is to outline analytics dashboard to evaluate the success rate of marketing campaign performance. It provides information about metrics such as clicks, impressions, spend, conversions, site audit score, audience growth, etc. Pitch your topic with ease and precision using this Real Time Analytics Dashboard To Measure Marketing Campaign Performance Information PDF. This layout presents information on Real Time Analytics Dashboard To Measure Marketing Campaign Performance. It is also available for immediate download and adjustment. So, changes can be made in the color, design, graphics or any other component to create a unique layout.

Brand Value Proposition Assessment Questionnaire Download PDF
The slide highlights the brand value proposition assessment questionnaire illustrating assessment questions and responses with scores. Assessment questions depicts clearly draft and define, relevance, differentiation, reflection in brand behaviour Pitch your topic with ease and precision using this Brand Value Proposition Assessment Questionnaire Download PDF This layout presents information on Assessment Questions, Completely Disagree, Mostly Disagree It is also available for immediate download and adjustment. So, changes can be made in the color, design, graphics or any other component to create a unique layout.

Support Team New Employee Members Performance Dashboard Designs PDF
This slide shows the dashboard representing the performance evaluation of the new staff members of the support team staff. It shoes details related to occupancy rate, net promoter score, average first contact resolution rate etc. Pitch your topic with ease and precision using this Support Team New Employee Members Performance Dashboard Designs PDF. This layout presents information on Target Range, Occupancy Rate, Contact Resolution Rate. It is also available for immediate download and adjustment. So, changes can be made in the color, design, graphics or any other component to create a unique layout.

Dashboard For Customer Satisfaction Survey Outcome Demonstration PDF
This slide outlines customer satisfaction survey outcome dashboard that can help organization to analyze the ratings and determine areas of improvement in customer service and make changes in strategies to increase the satisfied customers in future. Its key components are survey response rate, total invitations, total responses and CSAT score. Showcasing this set of slides titled Dashboard For Customer Satisfaction Survey Outcome Demonstration PDF. The topics addressed in these templates are Total Invitations, Survey Response Rate, Total Responses. All the content presented in this PPT design is completely editable. Download it and make adjustments in color, background, font etc. as per your unique business setting.

Customer Grievance Call Handling Dashboard With Abandon Rate Introduction PDF
This slide showcases dashboard that can help organization to identify the resolution time and average abandon rate of customer grievance calls. Its key components are average answer speed, avg calls or minute and overall satisfaction score. Showcasing this set of slides titled Customer Grievance Call Handling Dashboard With Abandon Rate Introduction PDF. The topics addressed in these templates are Customer Grievance Call Handling, Dashboard With Abandon Rate. All the content presented in this PPT design is completely editable. Download it and make adjustments in color, background, font etc. as per your unique business setting.

Customer Service Metrics Dashboard With Net Retention Rate Sample PDF
This slide showcases KPI dashboard for customer service that can help to compare the customer churn rate, revenue churn rate, net retention rate and MRR growth rate as compared to previous month. Its key elements are net promoter score, loyal customer rate, percentage of premium users and customer lifetime value. Pitch your topic with ease and precision using this Customer Service Metrics Dashboard With Net Retention Rate Sample PDF. This layout presents information on Loyal Customer Rate, Premium Users, Customer Lifetime Value. It is also available for immediate download and adjustment. So, changes can be made in the color, design, graphics or any other component to create a unique layout.

5S Lean Production Strategies Audit Sheet For Safety Ppt Infographics Graphics Template PDF
This slide defines the 5s lean safety audit sheet for an organization. It includes information related observations, remarks and suggestions along with the scores. Pitch your topic with ease and precision using this 5S Lean Production Strategies Audit Sheet For Safety Ppt Infographics Graphics Template PDF. This layout presents information on Remarks And Suggestion, Safety Equipment, Extinguishers Available. It is also available for immediate download and adjustment. So, changes can be made in the color, design, graphics or any other component to create a unique layout.

Key Metrics To Business Product Campaign Success Measurement Clipart PDF
The following slide illustrates product campaign success measurement with major KPIs. It provides information about organic traffic, referral traffic, return visitors, conversion rate, net promoter score, etc. Pitch your topic with ease and precision using this Key Metrics To Business Product Campaign Success Measurement Clipart PDF. This layout presents information on Organic Traffic, Referral Traffic, Return Visitors. It is also available for immediate download and adjustment. So, changes can be made in the color, design, graphics or any other component to create a unique layout.

Technology Company Quarterly Revenue Projections And Retention Rate Clipart PDF
This slide covers quarter 4 tech company product revenue estimation. It also includes kpis such as net revenue retention rates, total customers, data marketplace listing, customer satisfaction and net promoter score. Pitch your topic with ease and precision using this Technology Company Quarterly Revenue Projections And Retention Rate Clipart PDF. This layout presents information on Product Revenue, Total Customers, Data Marketplace Listings. It is also available for immediate download and adjustment. So, changes can be made in the color, design, graphics or any other component to create a unique layout.
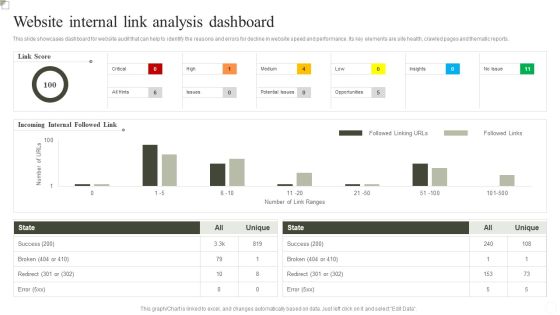
Website Internal Link Analysis Dashboard Ppt Inspiration Outline PDF
This slide showcases dashboard for website Analysis that can help to identify the reasons and errors for decline in website speed and performance. Its key elements are site health, crawled pages and thematic reports. Pitch your topic with ease and precision using this Website Internal Link Analysis Dashboard Ppt Inspiration Outline PDF. This layout presents information on Success, Incoming Internal Followed Link, Link Score. It is also available for immediate download and adjustment. So, changes can be made in the color, design, graphics or any other component to create a unique layout.
Finance Department Employee Performance Assessment Survey Icons PDF
This slide depicts the comparative assessment of multiple employees in the financial department for developing better skills through appropriate training programs. The various skills include financial statement preparation, book keeping, taxation, and so on along with average score. Pitch your topic with ease and precision using this Finance Department Employee Performance Assessment Survey Icons PDF. This layout presents information on Taxation, Business Law, Financial Statement Preparation. It is also available for immediate download and adjustment. So, changes can be made in the color, design, graphics or any other component to create a unique layout.

Support Center Report On Customer Executive Performance Evaluation Background PDF
This slide signifies the call center KPI dashboard on customer support executive performance. It includes daily and weekly volume, CSAT score, pie chart on service level agreement. Pitch your topic with ease and precision using this Support Center Report On Customer Executive Performance Evaluation Background PDF. This layout presents information on Weekly Call Volume, Response Time, Service Level Agreement. It is also available for immediate download and adjustment. So, changes can be made in the color, design, graphics or any other component to create a unique layout.
Eligibility Criteria For Mortgage Application And Tracking Status In Progress Mockup PDF
The following slide highlights loan application eligibility criteria and tracking progress status. It includes components such as age, debt to income ratio, employment type, employment status, minimum income, maximum loan amount, tenure and credit score. Persuade your audience using this Eligibility Criteria For Mortgage Application And Tracking Status In Progress Mockup PDF. This PPT design covers one stages, thus making it a great tool to use. It also caters to a variety of topics including Employment Type, Age, Employment Status. Download this PPT design now to present a convincing pitch that not only emphasizes the topic but also showcases your presentation skills.

Employee Retention And Turnover Rates Monitoring Dashboard Mockup PDF
This slide showcases a dashboard to supervise and monitor employee retention and turnover score. It includes key components such as active employees, hires, exits, retention rate, turnover rate, etc. If your project calls for a presentation, then Slidegeeks is your go to partner because we have professionally designed, easy to edit templates that are perfect for any presentation. After downloading, you can easily edit Employee Retention And Turnover Rates Monitoring Dashboard Mockup PDF and make the changes accordingly. You can rearrange slides or fill them with different images. Check out all the handy templates

Safety Kpis Dashboard For Manufacturing Company Slides PDF
This slide shows the metrics dashboard representing the safety metrics for the manufacturing company. It includes details related to incidents per employee, total number of incidents in the company, incidents accumulated total etc.. Pitch your topic with ease and precision using this Safety Kpis Dashboard For Manufacturing Company Slides PDF. This layout presents information on Incidents Per Employee, Safety Incident Reported, Incidence Avoidance Quiz Score. It is also available for immediate download and adjustment. So, changes can be made in the color, design, graphics or any other component to create a unique layout.
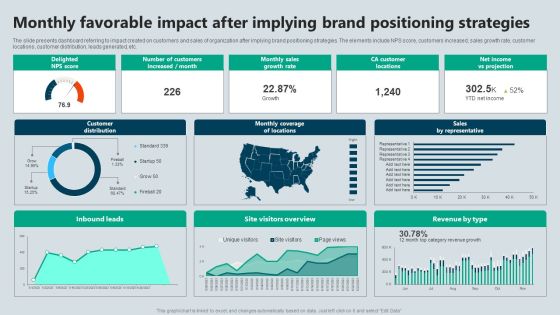
Monthly Favorable Impact After Implying Brand Positioning Strategies Demonstration PDF
The slide presents dashboard referring to impact created on customers and sales of organization after implying brand positioning strategies. The elements include NPS score, customers increased, sales growth rate, customer locations, customer distribution, leads generated, etc. Pitch your topic with ease and precision using this Monthly Favorable Impact After Implying Brand Positioning Strategies Demonstration PDF. This layout presents information on Strategies, Projection, Growth Rate. It is also available for immediate download and adjustment. So, changes can be made in the color, design, graphics or any other component to create a unique layout.

Six Sigma Continuous Process Kpis To Measure The Growth Of Operational Strategy Rules PDF
Purpose of the following slide is to show the KPIs or key performance indicators for measuring the progress of operational strategy. These KPIs can be customer satisfaction rate, net promoter score, Downtime etc. This is a Six Sigma Continuous Process Kpis To Measure The Growth Of Operational Strategy Rules PDF template with various stages. Focus and dispense information on four stages using this creative set, that comes with editable features. It contains large content boxes to add your information on topics like Customer KPIs, Employee KPIs, Production KPIs. You can also showcase facts, figures, and other relevant content using this PPT layout. Grab it now.
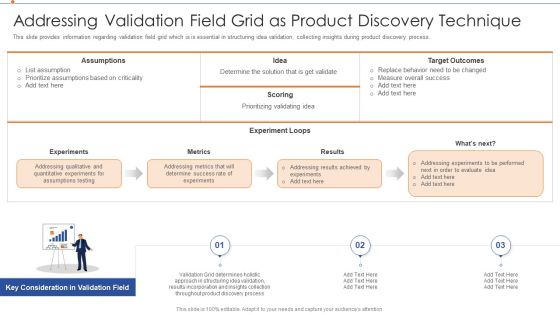
Strategies For Improving Product Discovery Addressing Validation Field Grid As Product Discovery Technique Diagrams PDF
This slide provides information regarding validation field grid which is is essential in structuring idea validation, collecting insights during product discovery process. This is a strategies for improving product discovery addressing validation field grid as product discovery technique diagrams pdf template with various stages. Focus and dispense information on three stages using this creative set, that comes with editable features. It contains large content boxes to add your information on topics like experiments, metrics, results, target outcomes, scoring, idea. You can also showcase facts, figures, and other relevant content using this PPT layout. Grab it now.

Collection Of Quality Assurance PPT Metrics To Measure Customer Satisfaction Guidelines PDF
This slide shows NPS metrics that can be used by the organization to measure its customer satisfaction score. It also displays information about interactive forecasted future scenarios. This is a collection of quality assurance ppt metrics to measure customer satisfaction guidelines pdf template with various stages. Focus and dispense information on four stages using this creative set, that comes with editable features. It contains large content boxes to add your information on topics like quality, price. You can also showcase facts, figures, and other relevant content using this PPT layout. Grab it now.
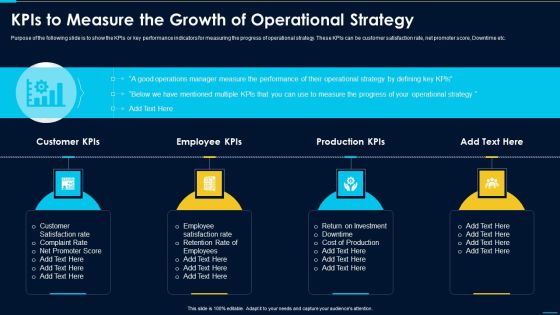
Kpis To Measure The Growth Of Operational Strategy Information PDF
Purpose of the following slide is to show the KPIs or key performance indicators for measuring the progress of operational strategy. These KPIs can be customer satisfaction rate, net promoter score, Downtime etc.This is a kpis to measure the growth of operational strategy information pdf template with various stages. Focus and dispense information on four stages using this creative set, that comes with editable features. It contains large content boxes to add your information on topics like unnecessary transportation, producing excessive, multiple products. You can also showcase facts, figures, and other relevant content using this PPT layout. Grab it now.

Digital Assessment To Analyze Social Media Brand Presence Findings Of Web Analytics Audit Portrait PDF
This slide highlights the key findings for web analytics audit which includes the conversation rate score, purchase by device type, website traffic form which browser and new visitor ratio.This is a Digital Assessment To Analyze Social Media Brand Presence Findings Of Web Analytics Audit Portrait PDF template with various stages. Focus and dispense information on six stages using this creative set, that comes with editable features. It contains large content boxes to add your information on topics like Development Is Necessary, Website Is Decreased, Conversion Decreased. You can also showcase facts, figures, and other relevant content using this PPT layout. Grab it now.

Website And Social Media Findings Of Web Analytics Audit Ppt Inspiration Graphic Images PDF
This slide highlights the key findings for web analytics audit which includes the conversation rate score, purchase by device type, website traffic form which browser and new visitor ratio. This is a Website And Social Media Findings Of Web Analytics Audit Ppt Inspiration Graphic Images PDF template with various stages. Focus and dispense information on six stages using this creative set, that comes with editable features. It contains large content boxes to add your information on topics like Chrome Browser, Conversion Rate, Smartphone. You can also showcase facts, figures, and other relevant content using this PPT layout. Grab it now.

Issues And Impact Of Failure Mode And Effects Analysis FMEA Calculation Of Risk Preference Number Structure PDF
This slide provides the RPN calculation along with the ranking of severity, occurrence, and detection for different various failure modes. Additionally, it identifies the highest priority task based on the RPN score.This is a Issues And Impact Of Failure Mode And Effects Analysis FMEA Calculation Of Risk Preference Number Structure PDF template with various stages. Focus and dispense information on five stages using this creative set, that comes with editable features. It contains large content boxes to add your information on topics like Invariably Discovered, Affecting Customer, Escapes Detection. You can also showcase facts, figures, and other relevant content using this PPT layout. Grab it now.
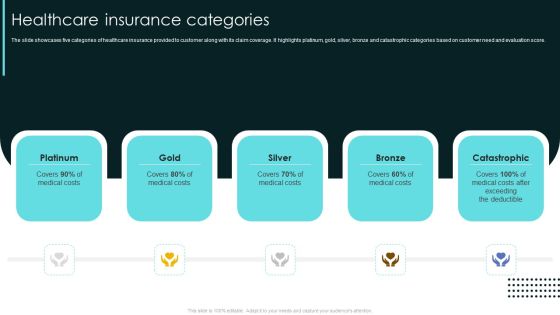
Term Life And General Insurance Company Profile Healthcare Insurance Categories Clipart PDF
The slide showcases five categories of healthcare insurance provided to customer along with its claim coverage. It highlights platinum, gold, silver, bronze and catastrophic categories based on customer need and evaluation score. This is a Term Life And General Insurance Company Profile Healthcare Insurance Categories Clipart PDF template with various stages. Focus and dispense information on five stages using this creative set, that comes with editable features. It contains large content boxes to add your information on topics like Platinum, Silver, Catastrophic, Bronze. You can also showcase facts, figures, and other relevant content using this PPT layout. Grab it now.

Property And Casualties Insurance Business Profile Healthcare Insurance Categories Ideas PDF
The slide showcases five categories of healthcare insurance provided to customer along with its claim coverage. It highlights platinum, gold, silver, bronze and catastrophic categories based on customer need and evaluation score. This is a Property And Casualties Insurance Business Profile Healthcare Insurance Categories Ideas PDF template with various stages. Focus and dispense information on five stages using this creative set, that comes with editable features. It contains large content boxes to add your information on topics like Healthcare Insurance Categories. You can also showcase facts, figures, and other relevant content using this PPT layout. Grab it now.
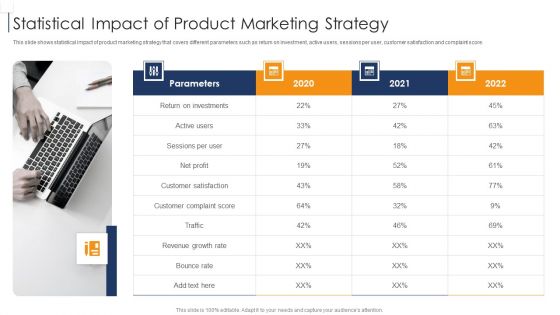
Product Lifecycle Management IT Statistical Impact Of Product Marketing Strategy Background PDF
This slide shows statistical impact of product marketing strategy that covers different parameters such as return on investment, active users, sessions per user, customer satisfaction and complaint score. This is a product lifecycle management it statistical impact of product marketing strategy background pdf template with various stages. Focus and dispense information on four stages using this creative set, that comes with editable features. It contains large content boxes to add your information on topics like statistical impact of product marketing strategy. You can also showcase facts, figures, and other relevant content using this PPT layout. Grab it now.

Improving Employee Performance Management System In Organization Dashboard For Measuring Support Graphics PDF
his slide represents the support team performance dashboard that includes unassigned, open, solved, escalated, occupancy rate, top agen ts, net promoter score, average first contact resolution rate, etc.This is a improving employee performance management system in organization dashboard for measuring support graphics pdf template with various stages. Focus and dispense information on one stage using this creative set, that comes with editable features. It contains large content boxes to add your information on topics like dashboard for measuring support team performance You can also showcase facts, figures, and other relevant content using this PPT layout. Grab it now.

Enabling Business Case Development For Project Project Managers Playbook Diagrams PDF
This slide provides information regarding business case development which enables in detecting and identifying alternative and compare them based on relative costs and benefits associated to project .This is a Enabling Business Case Development For Project Project Managers Playbook Diagrams PDF template with various stages. Focus and dispense information on seven stages using this creative set, that comes with editable features. It contains large content boxes to add your information on topics like Satisfaction Score, Estimated Customer, Ongoing Initiatives. You can also showcase facts, figures, and other relevant content using this PPT layout. Grab it now.

Deliver Efficiency Innovation Challenges Associated With User Experience Team Themes PDF
This slide represents metrics used to measure product team performance that covers product stickiness and usage, feature adoption and retention, net promoter score, product delivery predictability, etc. Deliver an awe inspiring pitch with this creative Deliver Efficiency Innovation Challenges Associated With User Experience Team Themes PDF bundle. Topics like Product Development Procedure, Value Achieving Objectives, Securing Resources And Budget, Experience And Research Value can be discussed with this completely editable template. It is available for immediate download depending on the needs and requirements of the user.
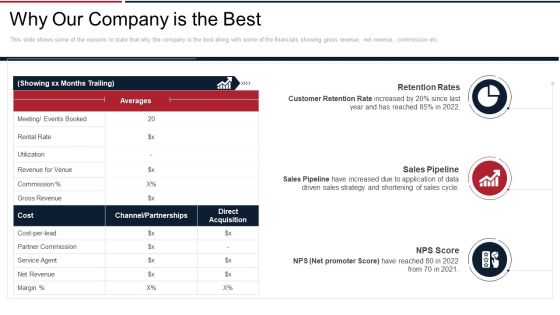
Next View Ventures Fundraising Pitch Deck Why Our Company Is The Best Microsoft PDF
This slide shows some of the reasons to state that why the company is the best along with some of the financials showing gross revenue, net revenue, commission etc. This is a next view ventures fundraising pitch deck why our company is the best microsoft pdf template with various stages. Focus and dispense information on three stages using this creative set, that comes with editable features. It contains large content boxes to add your information on topics like retention rates, sales pipeline, net promoter score. You can also showcase facts, figures, and other relevant content using this PPT layout. Grab it now.

Continuous Enhancement Strategy Kpis To Measure The Growth Of Operational Strategy Inspiration PDF
Purpose of the following slide is to show the KPIs or key performance indicators for measuring the progress of operational strategy. These KPIs can be customer satisfaction rate, net promoter score, Downtime etc. This is a Continuous Enhancement Strategy Kpis To Measure The Growth Of Operational Strategy Inspiration PDF template with various stages. Focus and dispense information on four stages using this creative set, that comes with editable features. It contains large content boxes to add your information on topics like Customer KPIs, Employee KPIs, Production KPIs, Customer Satisfaction rate. You can also showcase facts, figures, and other relevant content using this PPT layout. Grab it now.

Tools For Prioritization Rcve Prioritization Matrix Ppt PowerPoint Presentation Infographics Designs PDF
Following slide covers risk, cost, value and effort matrix. Task will be prioritized based on effort and imact score. This is a tools for prioritization rcve prioritization matrix ppt powerpoint presentation infographics designs pdf template with various stages. Focus and dispense information on four stages using this creative set, that comes with editable features. It contains large content boxes to add your information on topics like avoid, investigate, consider, prioritize, low, high. You can also showcase facts, figures, and other relevant content using this PPT layout. Grab it now.

Executing Advance Data Analytics At Workspace Technological Assessment Themes PDF
IT infrastructure management capabilities will be judged based on several parameters such as incidents and service requests handling rate, service failure rate, customer satisfaction score, etc. This is a executing advance data analytics at workspace technological assessment themes pdf template with various stages. Focus and dispense information on four stages using this creative set, that comes with editable features. It contains large content boxes to add your information on topics like technological assessment of firm current infrastructure management capabilities. You can also showcase facts, figures, and other relevant content using this PPT layout. Grab it now.
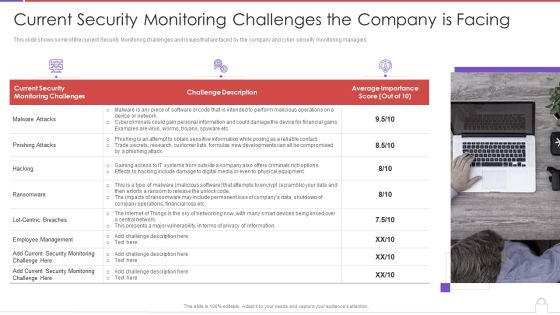
Methods To Develop Advanced Current Security Monitoring Challenges The Company Is Facing Professional PDF
This slide shows some of the current Security Monitoring challenges and issues that are faced by the company and cyber security monitoring managers. This is a methods to develop advanced current security monitoring challenges the company is facing professional pdf template with various stages. Focus and dispense information on three stages using this creative set, that comes with editable features. It contains large content boxes to add your information on topics like current security, monitoring challenges, challenge description, average importance score. You can also showcase facts, figures, and other relevant content using this PPT layout. Grab it now.
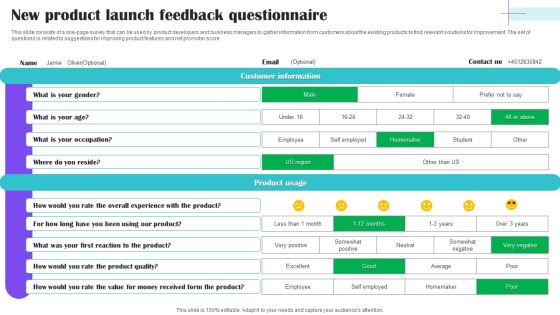
New Product Launch Feedback Questionnaire Survey SS
This slide consists of a one-page survey that can be used by product developers and business managers to gather information from customers about the existing products to find relevant solutions for improvement. The set of questions is related to suggestions for improving product features and net promoter score. Showcasing this set of slides titled New Product Launch Feedback Questionnaire Survey SS. The topics addressed in these templates are Customer Information, Product Usage, Occupation, Value For Money, Overall Experience. All the content presented in this PPT design is completely editable. Download it and make adjustments in color, background, font etc. as per your unique business setting.
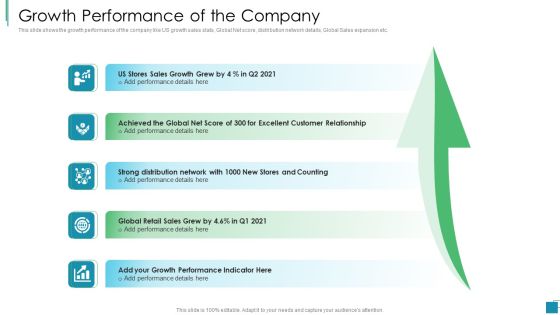
Venture Capital Pitch Decks For Private Companies Growth Performance Of The Company Pictures PDF
This slide shows the growth performance of the company like US growth sales stats, Global Net score, distribution network details, Global Sales expansion etc. This is a venture capital pitch decks for private companies growth performance of the company pictures pdf template with various stages. Focus and dispense information on five stages using this creative set, that comes with editable features. It contains large content boxes to add your information on topics like growth performance of the company. You can also showcase facts, figures, and other relevant content using this PPT layout. Grab it now.

Investor Pitch Deck To Generate Venture Capital Funds Growth Performance Of The Company Ppt File Inspiration PDF
This slide shows the growth performance of the company like US growth sales stats, Global Net score, distribution network details, Global Sales expansion etc. This is a investor pitch deck to generate venture capital funds growth performance of the company ppt file inspiration pdf template with various stages. Focus and dispense information on five stages using this creative set, that comes with editable features. It contains large content boxes to add your information on topics like growth performance indicator, global retail sales, stores sales growth. You can also showcase facts, figures, and other relevant content using this PPT layout. Grab it now.
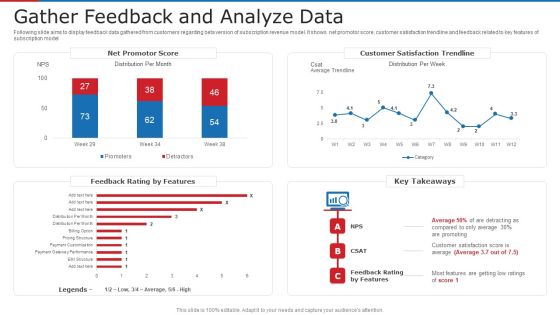
Gather Feedback And Analyze Data Ppt Themes PDF
Following slide aims to display feedback data gathered from customers regarding beta version of subscription revenue model. It shows net promotor score, customer satisfaction trendline and feedback related to key features of subscription model. Deliver and pitch your topic in the best possible manner with this gather feedback and analyze data ppt themes pdf. Use them to share invaluable insights on gather feedback and analyze data and impress your audience. This template can be altered and modified as per your expectations. So, grab it now.

PLM Execution In Company Statistical Impact Of Product Marketing Strategy Designs PDF
This slide shows statistical impact of product marketing strategy that covers different parameters such as return on investment, active users, sessions per user, customer satisfaction and complaint score. This is a plm execution in company statistical impact of product marketing strategy designs pdf template with various stages. Focus and dispense information on four stages using this creative set, that comes with editable features. It contains large content boxes to add your information on topics like statistical impact of product marketing strategy . You can also showcase facts, figures, and other relevant content using this PPT layout. Grab it now.

Major Strategies To Nurture Effective Vendor Association Supplier Rating Scorecard Template Mockup PDF
This slide covers the supplier rating scorecard including criteria such as quality, service, delivery and price along with self evaluation and internal evaluation scores. This is a major strategies to nurture effective vendor association supplier rating scorecard template mockup pdf template with various stages. Focus and dispense information on three stages using this creative set, that comes with editable features. It contains large content boxes to add your information on topics like criteria, self evaluation, internal evaluation. You can also showcase facts, figures, and other relevant content using this PPT layout. Grab it now.

Agile Group For Product Development Metrics Used By Product Leader To Measure Performance Designs PDF
This slide focuses on metrics used by product leader to measure performance such as net promoter score, feature adoption, retention rate, churn rate, customer satisfaction, stickiness, etc. Deliver an awe inspiring pitch with this creative agile group for product development metrics used by product leader to measure performance designs pdf bundle. Topics like quantifies customer happiness with product, customers that leave over certain period, customer satisfaction can be discussed with this completely editable template. It is available for immediate download depending on the needs and requirements of the user.

Agile Group For Product Development Metrics Used To Measure Product Team Performance Download PDF
This slide represents metrics used to measure product team performance that covers product stickiness and usage, feature adoption and retention, net promoter score, product delivery predictability, etc. Deliver and pitch your topic in the best possible manner with this agile group for product development metrics used to measure product team performance download pdf. Use them to share invaluable insights on leading indicators, product delivery predictability, product stickiness and impress your audience. This template can be altered and modified as per your expectations. So, grab it now.
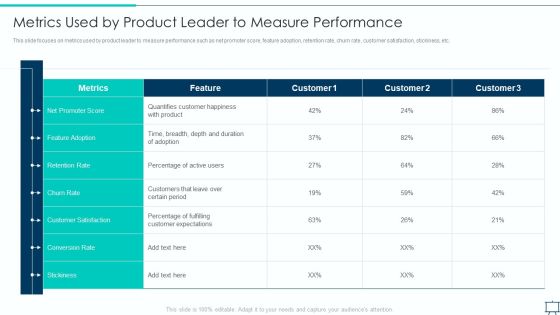
Formulating Competitive Plan Of Action For Effective Product Leadership Metrics Used By Product Leader Microsoft PDF
This slide focuses on metrics used by product leader to measure performance such as net promoter score, feature adoption, retention rate, churn rate, customer satisfaction, stickiness, etc. Deliver and pitch your topic in the best possible manner with this formulating competitive plan of action for effective product leadership metrics used by product leader microsoft pdf. Use them to share invaluable insights on conversion rate, customer satisfaction, duration of adoption and impress your audience. This template can be altered and modified as per your expectations. So, grab it now.

 Home
Home