Scope Diagram
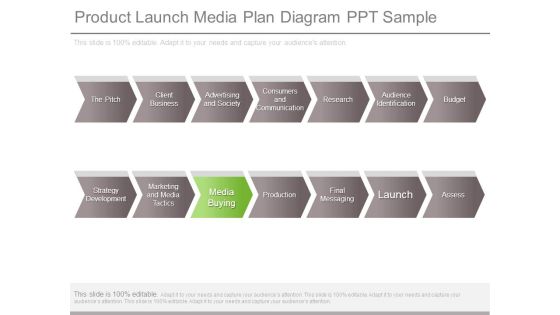
Product Launch Media Plan Diagram Ppt Sample
This is a product launch media plan diagram ppt sample. This is a seven stage process. The stages in this process are the pitch, client business, advertising and society, consumers and communication, research, audience identification, budget, strategy development, marketing and media tactics, media buying, production , final messaging, launch, assess.

Brand And Behavior Methodology Analysis Diagram Images
This is a brand and behavior methodology analysis diagram images. This is a three stage process. The stages in this process are report roi lessons, brand and behavior action plan, customer funnel analyzing, customer journey mapping, brand and behavior, marketing plan, strategic plan, execution, monitoring, channels election, task brief, marketing objective, brand objective.

Account Management Development Diagram Ppt Background
This is a account management development diagram ppt background. This is a ten stage process. The stages in this process are measuring and rewarding performance, achieving a customer centric culture, programme and change management, managing account knowledge, business opportunities, strategic planning, situation analysis, branding, competitive intelligence business performance.

Sales Lifecycle Management Diagram Good Ppt Example
This is a sales lifecycle management diagram good ppt example. This is a eight stage process. The stages in this process are customer service, marketing, sales, sales team and territory planning, lead management, opportunity management, account management, forecasting and sales analytics.
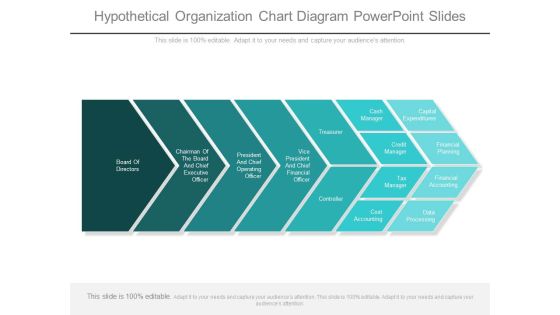
Hypothetical Organization Chart Diagram Powerpoint Slides
This is a hypothetical organization chart diagram powerpoint slides. This is a seven stage process. The stages in this process are board of directors, chairman of the board and chief executive officer, president and chief operating officer, vice president and chief financial officer, treasurer, controller, cash manager, capital expenditures, credit manager, financial planning, tax manager, financial accounting, cost accounting, data processing.

PowerPoint Templates Process Diagram Circular Flow Network
We present our powerpoint templates process diagram Circular Flow Network.Download our Circle Charts PowerPoint Templates because it can illustrate your chain of ideas focusing on that aspect or resource in order to enhance the quality of your product. Download our Arrows PowerPoint Templates because this diagram helps you to develop your marketing strategy and communicate your enthusiasm and motivation to raise the bar. Use our Shapes PowerPoint Templates because it Creates a winner with your passion and dream. Use our Business PowerPoint Templates because it helps you to explain your plans in all earnest to your colleagues and raise the bar for all. Present our Flow Charts PowerPoint Templates because they highlight the depth of your thought process.Use these PowerPoint slides for presentations relating to 9, abstract, arrows, blank, business, central, centralized, chart, circle, circular, circulation, concept, conceptual, converging, design, diagram, empty, executive, icon, idea, illustration, management, map, mapping, mba, model, numbers, organization, outwards, pointing, procedure, process, radial, radiating, relationship, resource, sequence, sequential, seven, square, strategy, template. The prominent colors used in the PowerPoint template are Purple, Gray, Black. Presenters tell us our powerpoint templates process diagram Circular Flow Network are Playful. The feedback we get is that our central PowerPoint templates and PPT Slides are Exuberant. Presenters tell us our powerpoint templates process diagram Circular Flow Network are Efficacious. You can be sure our central PowerPoint templates and PPT Slides are Delightful. People tell us our powerpoint templates process diagram Circular Flow Network are Vintage. PowerPoint presentation experts tell us our central PowerPoint templates and PPT Slides are Royal.

Ppt Pyramid Diagram Design Certificate Templates PowerPoint
PPT pyramid diagram design certificate templates powerpoint-Pyramids are truly wonders of the world. Thus a wonderful graphic to impress your audience with your Business or professional ideas that are broad based but funnel or narrow down to specific groups, issues or goals. Reach the peak with this graphic.-PPT pyramid diagram design certificate templates powerpoint-Adult, Art, Background, Business, Career, Chart, Communication, Concept, Conference, Corporate, Creative, Design, Economy, Executive, Finance, Group, Growth, Idea, Illustration, Leadership, Meeting, New, Occupation, Office, People, Person, Progress, Silhouette, Space, Speaking, Standing, Success
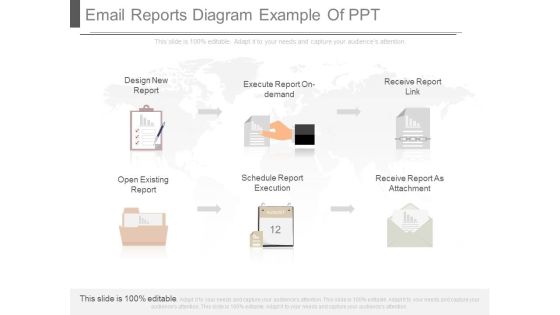
Email Reports Diagram Example Of Ppt
This is a email reports diagram example of ppt. This is a six stage process. The stages in this process are design new report, execute report on demand, receive report link, open existing report, schedule report execution, receive report as attachment.
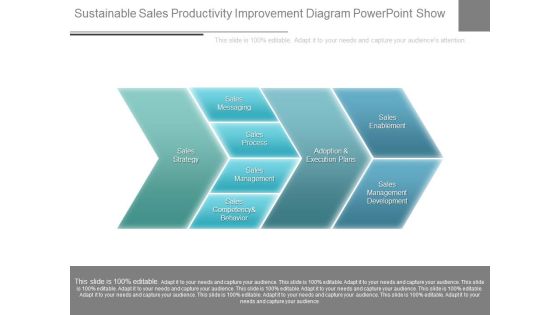
Sustainable Sales Productivity Improvement Diagram Powerpoint Show
This is a sustainable sales productivity improvement diagram powerpoint show. This is a four stage process. The stages in this process are sales strategy, sales messaging, sales process, sales management, sales competency and behavior, adoption and execution plans, sales enablement, sales management development.
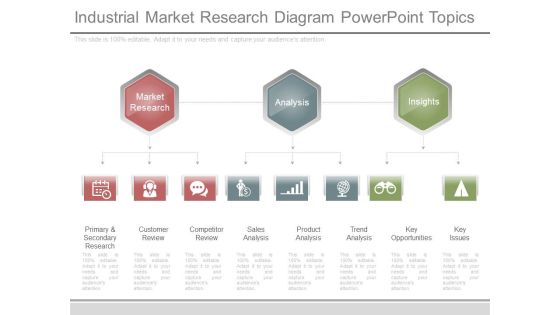
Industrial Market Research Diagram Powerpoint Topics
This is a industrial market research diagram powerpoint topics. This is a three stage process. The stages in this process are market research, analysis, insights, primary and secondary research, customer review, competitor review, sales analysis, product analysis, trend analysis, key opportunities, key issues.
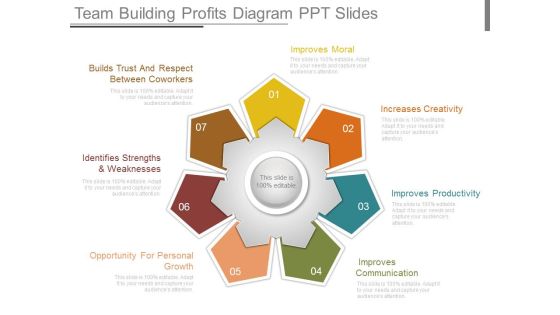
Team Building Profits Diagram Ppt Slides
This is a team building profits diagram ppt slides. This is a seven stage process. The stages in this process are improves moral, increases creativity, improves productivity, improves communication, builds trust and respect between coworkers, identifies strengths and weaknesses, opportunity for personal growth.

Business Management Entrepreneurship Diagram Presentation Portfolio
This is a business management entrepreneurship diagram presentation portfolio. This is an eight stage process. The stages in this process are overcoming obstacles, financial social, aesthetic capital, showing determination in the fact of adversity, managing risk, motivation to make a difference, spotting and exploiting opportunities, finding the required resources, using network extensively.

Business Management Entrepreneurship Diagram Powerpoint Slide Graphics
This is a business management entrepreneurship diagram powerpoint slide graphics. This is a nine stage process. The stages in this process are finding the required resources, using networks extensively, motivation to make a difference, spotting and exploiting opportunities, overcoming obstacles, controlling the business, financial, social, aesthetic capital, managing risk, showing determination in the face of adversity.\n\n\n\n

Business Analysis Levels Sample Diagram Examples Slides
This is a business analysis levels sample diagram examples slides. This is a one stage process. The stages in this process are business analysis, strategic, operational, tactical, vision goal objective, structure polices, i want, you want, we weant, they want, opportunities, problems, application architecture, text, cep, vp marketing, vp proctive, sales manager, project manager, vpit, prodect owner, sme.
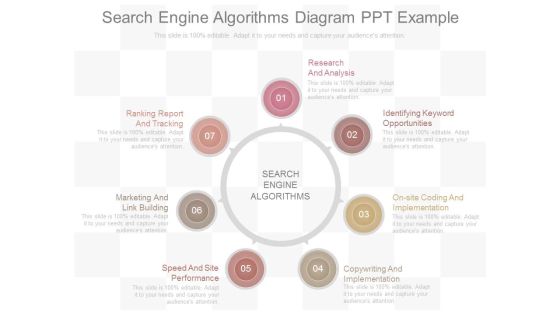
Search Engine Algorithms Diagram Ppt Example
This is a search engine algorithms diagram ppt example. This is a seven stage process. The stages in this process are ranking report and tracking, marketing and link building, speed and site performance, copywriting and implementation, on site coding and implementation, identifying keyword opportunities, research and analysis, search engine algorithms.

People Brand Relationship Diagram Powerpoint Slides
This is a people brand relationship diagram powerpoint slides. This is a three stage process. The stages in this process are opportunity and choice, accredited qualifications, focused development, co responsibility, assessment and feedback, self esteem and identity, sense of purpose, competitive remuneration, attract, develop, retain.

Value Chain Analysis Quantitative Diagram Presentation
This is a value chain analysis quantitative diagram presentation. This is a three stage process. The stages in this process are identify bottlenecks hindering development, misalignments in value chains, governance insights into the decision making targeting vulnerable, opportunities for improvement, adequate technologies, value chain analysis quantitative and qualitative approach.

Business Accounting Network Diagram Powerpoint Guide
This is a business accounting network diagram powerpoint guide. This is a six stage process. The stages in this process are proposal and presentations, proposal and presentations, strategic sales, media relations, chief execute officer, chief financial officer, manage, directors, staff, vice president, ceo, cfo, business network.

Operational Efficiency Example Diagram Powerpoint Show
This is a operational efficiency example diagram powerpoint show. This is a eight stage process. The stages in this process are developing skills and resources, tools and infrastructure, governance, measurements, initiative identification discovery, linking initiative and strategy, initiative execution, methods and standards, operational efficiency.

Data Governance Organizational Framework Diagram Powerpoint Ideas
This is a data governance organizational framework diagram powerpoint ideas. This is a one stage process. The stages in this process are data governance council dgc, data governance steering committee dgsc, business and technical stewards and custodians, consumers, executives, business and technical members owners, data stewardship team virtual, end users.

Effective Marketing Optimization Diagram Ppt Images Gallery
This is a effective marketing optimization diagram ppt images gallery. This is a eight stage process. The stages in this process are build targeted lists, execute campaigns, retain customers, sell smarter, engage, measure and improve, analyze marketing, segment bases on activity.

Local Marketing Support Analysis Diagram Presentation Visuals
This is a local marketing support analysis diagram presentation visuals. This is a eight stage process. The stages in this process are ad builders and asset mgmt, local online marketing, training support, local marketing execution, marketing automation, video marketing promotion, local directory promotion, review marketing and mgmt.

Military Decision Making Process Diagram Presentation Slides
This is a military decision making process diagram presentation slides. This is a nine stage process. The stages in this process are receipt of mission, mission analysis, warning order, course of action development, course of action comparison, execution and assessment, course of action approval, orders production, rehearsal.

Thank You Ppt Powerpoint Presentation Diagram PDF
Presenting Thank You Ppt Powerpoint Presentation Diagram PDF to dispense important information. This template comprises three stages. It also presents valuable insights into the topics including Thank You. This is a completely customizable PowerPoint theme that can be put to use immediately. So, download it and address the topic impactfully.

Annual Trends Ppt PowerPoint Presentation Diagram PDF
Presenting Annual Trends Ppt PowerPoint Presentation Diagram PDF to dispense important information. This template comprises two stages. It also presents valuable insights into the topics including Annual Trends. This is a completely customizable PowerPoint theme that can be put to use immediately. So, download it and address the topic impactfully.

Forecasting And Replenishment Diagram Powerpoint Show
This is a forecasting and replenishment diagram powerpoint show. This is a sixteen stage process. The stages in this process are finance and accounting, field sales collaboration, distribution planning, customer collaboration, advanced planning and scheduling, master production scheduling, forecasting and planning, budgeting, purchasing, supplier collaboration, product development engineering, capacity planning, waterfall charts, sales and operations planning, enterprise system, marketing and sales.

Marketing Materials Development Diagram Ppt Ideas
This is a marketing materials development diagram ppt ideas. This is a nine stage process. The stages in this process are business or product launch, business plan, strategic marketing plan, business development plan, internet marketing plan, video marketing plan, create marketing materials, create sales tools, measure results and make.

Commercial Financial Services Example Diagram Powerpoint Guide
This is a commercial financial services example diagram powerpoint guide. This is a nine stage process. The stages in this process are private wealth management, personal and family insurance, estate planning, employee benefit plans, retirement plans, succession and continuity plans, compliance and fiduciary support, business insurance, voluntary benefit plans.
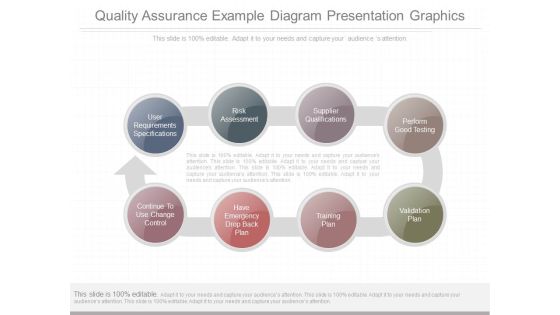
Quality Assurance Example Diagram Presentation Graphics
This is a quality assurance example diagram presentation graphics. This is a eight stage process. The stages in this process are user requirements specifications, risk assessment, supplier qualifications, perform good testing, continue to use change control, have emergency drop back plan, training plan, validation plan.

Organizational Effectiveness Vision Diagram Powerpoint Slide Show
This is a organizational effectiveness vision diagram powerpoint slide show. This is a three stage process. The stages in this process are change management, strategic planning facilitation, retreat workshop facilitation, organization, individual, team, individual coaching, leadership effectiveness, individual development planning, senior team alignment, strategic planning, conflict resolution.

Shop Floor 5s Implementation Diagram Powerpoint Templates
This is a shop floor 5s implementation diagram powerpoint templates. This is a eight stage process. The stages in this process are sustainment, shop floor 5s implementation, straighten, implementation team, implementation plan, develop communication plan, training plan, standardization, cleanliness, visual placement, systematic organization.
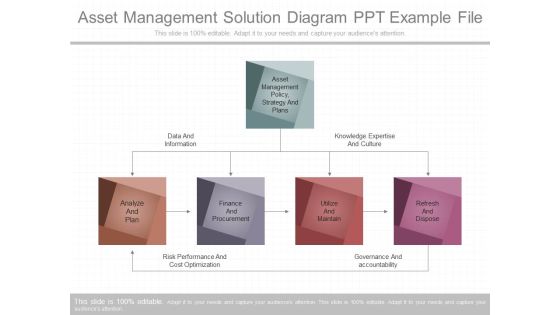
Asset Management Solution Diagram Ppt Example File
This is a asset management solution diagram ppt example file. This is a five stage process. The stages in this process are asset management policy, strategy and plans, analyze and plan, finance and procurement, utilize and maintain, refresh and dispose, data and information, knowledge expertise and culture, risk performance and cost optimization, governance and accountability.

Advertisement Optimization Model Diagram Powerpoint Slides Themes
This is a advertisement optimization model diagram powerpoint slides themes. This is a six stage process. The stages in this process are media planning buying and management, identify and analyze target audience, advertising development and transcreation, create advertising message, event connectivity, evaluate advertising effectiveness.

Inventory Control Pipeline Diagram Chart Structure PDF
This slide shows the inventory control pipeline flow chart. It includes stages like order received, dispatch, quality control, purchase invoice, etc. Pitch your topic with ease and precision using this Inventory Control Pipeline Diagram Chart Structure PDF. This layout presents information on Inventory Request, Inventory Inquiry, Quality Control . It is also available for immediate download and adjustment. So, changes can be made in the color, design, graphics or any other component to create a unique layout.
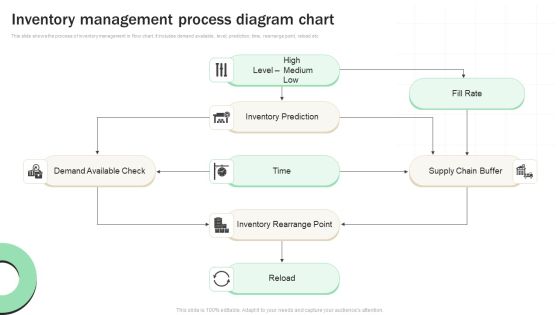
Inventory Management Process Diagram Chart Infographics PDF
This slide shows the process of inventory management in flow chart. It includes demand available, level, prediction, time, rearrange point, reload etc. Pitch your topic with ease and precision using this Inventory Management Process Diagram Chart Infographics PDF. This layout presents information on Demand Available Check, Inventory Rearrange Point, Supply Chain Buffer. It is also available for immediate download and adjustment. So, changes can be made in the color, design, graphics or any other component to create a unique layout.

Departmental Inventory Management Diagram Chart Download PDF
This slide shows how the inventory is managed in various departments. It also includes material acquisition, billing, manufacturing, dispatch etc. Pitch your topic with ease and precision using this Departmental Inventory Management Diagram Chart Download PDF. This layout presents information on Inventory Request, Inventory Details, Manufacturing. It is also available for immediate download and adjustment. So, changes can be made in the color, design, graphics or any other component to create a unique layout.
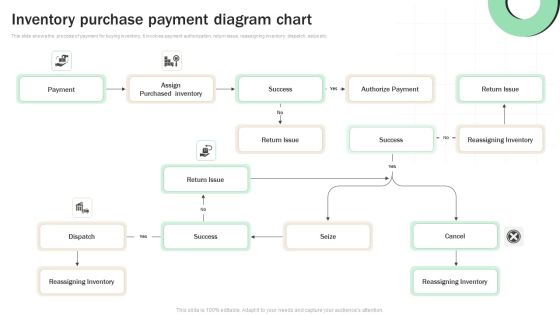
Inventory Purchase Payment Diagram Chart Rules PDF
This slide shows the process of payment for buying inventory. It involves payment authorization, return issue, reassigning inventory, dispatch, seize etc. Pitch your topic with ease and precision using this Inventory Purchase Payment Diagram Chart Rules PDF. This layout presents information on Assign Purchased Inventory, Authorize Payment, Reassigning Inventory. It is also available for immediate download and adjustment. So, changes can be made in the color, design, graphics or any other component to create a unique layout.

Business Analysis Services Sample Diagram Presentation Graphics
This is a business analysis services sample diagram presentation graphics. This is a three stage process. The stages in this process are hierarchy in business service, analysis service, management and planning service, management and planning service, elicitation service, analysis and documentation service, communication service, assessment and validation service, telecommunications, entertainment and media, internet web services.
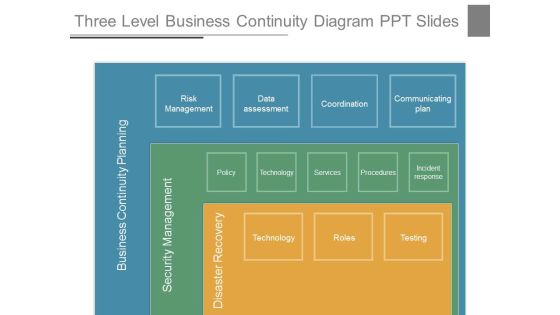
Three Level Business Continuity Diagram Ppt Slides
This is a three level business continuity diagram ppt slides. This is a three stage process. The stages in this process are business continuity planning, security management, disaster recovery, technology, roles, testing, risk management, data assessment, coordination, communicating plan, policy, technology, services, procedures, incident response.

Business Accounting Consultants Diagram Powerpoint Guide
This is a business accounting consultants diagram powerpoint guide. This is a eight stage process. The stages in this process are monthly coaching, strategic planning, system and diagnostic, exit and succession, monthly coaching, milestones accountability, exit planning readiness, valuation gap analysis, client needs, high performance business, kpi dashboard, virtual cfo.

Human Resources Flowchart Diagram Ppt Example
This is a human resources flowchart diagram ppt example. This is a eight stage process. The stages in this process are critical skills gap analysis, compensation and benefits, succession planning, training and performance support, performance management, organizational socialization, recruiting, workforce planning, analysis job descriptions job role competency model.

Market Research Solutions Diagram Ppt Example
This is a market research solutions diagram ppt example. This is a four stage process. The stages in this process are defining the problems and setting the research objectives, developing the research plan, implementing the research plan, interpreting and reporting the finding.

Trade Promotion Management Diagram Presentation Layouts
This is a trade promotion management diagram presentation layouts. This is a eight stage process. The stages in this process are review high level plan, manage product ranging, manage base volumes, define trading terms, monitor and analyze account, refine promotional events, view promotional events, review base account plan.
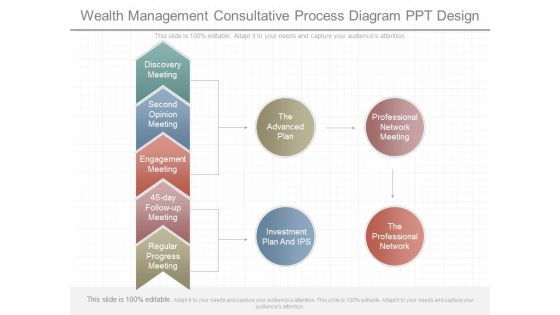
Wealth Management Consultative Process Diagram Ppt Design
This is a wealth management consultative process diagram ppt design. This is a two stage process. The stages in this process are discovery meeting, second opinion meeting, engagement meeting, 45 day follow up meeting, regular progress meeting, the advanced plan, investment plan and ips, professional network meeting, the professional network.
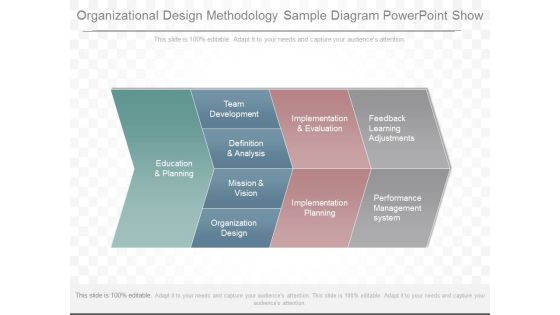
Organizational Design Methodology Sample Diagram Powerpoint Show
This is a organizational design methodology sample diagram powerpoint show. This is a four stage process. The stages in this process are education and planning, team development, definition and analysis, mission and vision, organization design, implementation and evaluation, implementation planning, feedback learning adjustments, performance management system.
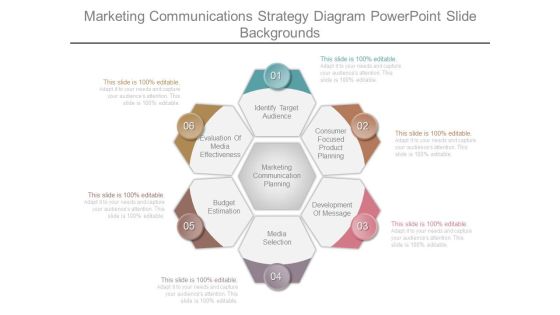
Marketing Communications Strategy Diagram Powerpoint Slide Backgrounds
This is a marketing communications strategy diagram powerpoint slide backgrounds. This is a six stage process. The stages in this process are identify target audience, consumer focused product planning, development of message, media selection, budget estimation, evaluation of media effectiveness, marketing communication planning.

Continuous Assessment Diagram Powerpoint Slides Presentation Tips
This is a continuous assessment diagram powerpoint slides presentation tips. This is a eight stage process. The stages in this process are define goals and outcomes, analyze and report, monitor, plan assessment, gather evidence, communicate and improve, identify and assess, plan curriculum.
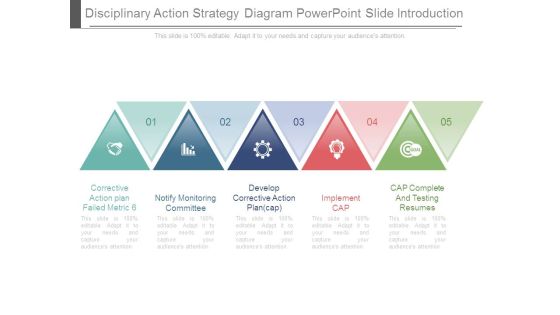
Disciplinary Action Strategy Diagram Powerpoint Slide Introduction
This is a disciplinary action strategy diagram powerpoint slide introduction. This is a five stage process. The stages in this process are corrective action plan failed metric, notify monitoring committee, develop corrective action plan cap, implement cap, cap complete and testing resumes.
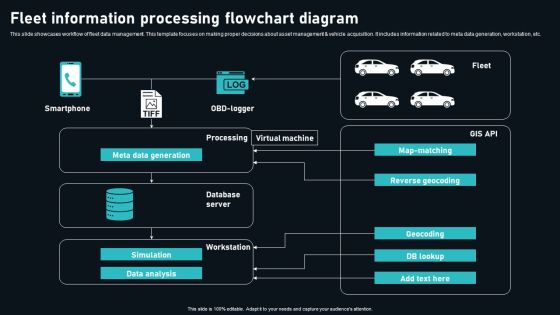
Fleet Information Processing Flowchart Diagram Themes PDF
This slide showcases workflow of fleet data management. This template focuses on making proper decisions about asset management and vehicle acquisition. It includes information related to meta data generation, workstation, etc. Showcasing this set of slides titled Fleet Information Processing Flowchart Diagram Themes PDF. The topics addressed in these templates are Smartphone, Processing, Virtual Machine. All the content presented in this PPT design is completely editable. Download it and make adjustments in color, background, font etc. as per your unique business setting.

Corporate Crisis Management Diagram Presentation Powerpoint
This is a corporate crisis management diagram presentation powerpoint. This is a eight stage process. The stages in this process are issues identification, stakeholder analysis, risk communication, planning and program development, employee and community awareness, spokesperson training and theme development, exercising, media operations program maintenance.

PowerPoint Templates Company Funnel Diagram Ppt Backgrounds
PowerPoint Templates Company Funnel Diagram PPT Backgrounds-Explore the various directions and layers existing in your in your plans and processes. Unravel the desired and essential elements of your overall strategy. Explain the relevance of the different layers and stages and directions in getting down to your core competence, ability and desired result.
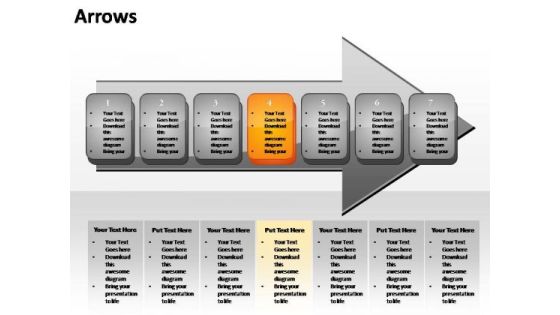
PowerPoint Design Diagram Linear Dimensions Ppt Designs
PowerPoint Design Diagram Linear Dimensions PPT Designs-Explore the various directions and layers existing in your in your plans and processes. Unravel the desired and essential elements of your overall strategy. Explain the relevance of the different layers and stages and directions in getting down to your core competence, ability and desired result.
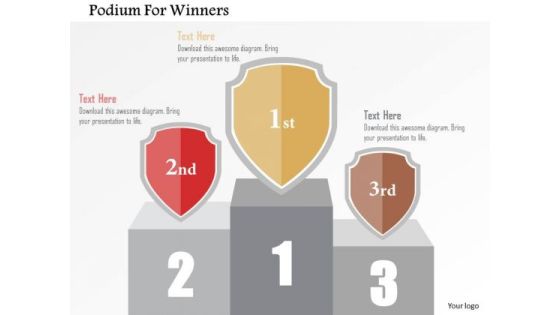
Business Diagram Podium For Winners Presentation Template
Our professionally designed winners podium business diagram is as an effective tool for communicating business ideas and strategies for corporate planning. You can also use this for motivating clients, team members, associates and subordinates. Above slide is suitable for teamwork and success related topics.

Human Resources Knowledge Diagram Powerpoint Show
This is a human resources knowledge diagram powerpoint show. This is a nine stage process. The stages in this process are personal research and information system, union labour relations, employee assistance, compensation and benefits, organizational development, human resource planning, design of the organization and job, selection and staffing, training and development.

Change Management Concepts Diagram Presentation Slides
This is a change management concepts diagram presentation slides. This is a nine stage process. The stages in this process are implement change, evaluate, learning, recognizing the need for change, setting a vision, understanding culture and policies, identify change approach, planning the change, control.

Corporate Finance Management Diagram Powerpoint Presentation
This is a corporate finance management diagram powerpoint presentation. This is a eight stage process. The stages in this process are corporate finance management system, general ledger, payroll, accounts payable, financial analytics, accounts receivable, asset lifecycle management, financial planning, governance risk compliance.

Corporate Risk Management Diagram Ppt Slide
This is a corporate risk management diagram ppt slide. This is a six stage process. The stages in this process are report on governance and culture, implement and test, develop response plan and solutions, quantify risk, identify and priorities risk, review risk process, monitor, manage, improve.
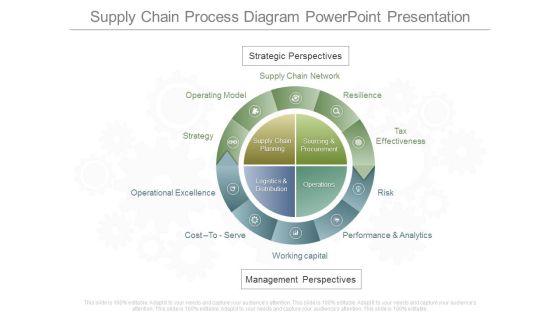
Supply Chain Process Diagram Powerpoint Presentation
This is a supply chain process diagram powerpoint presentation. This is a ten stage process. The stages in this process are strategic perspectives, supply chain network, operating model, resilience, tax effectiveness, operational excellence, cost to serve, working capital, performance and analytics, risk, supply chain planning, sourcing And procurement, logistics and distribution, operations, management perspectives.\n\n\n\n\n\n\n\n\n\n\n\n\n\n

Operations Management Research Diagram Presentation Visuals
This is a operations management research diagram presentation visuals. This is a eight stage process. The stages in this process are location of facilities, plant layout and material handling, product design, process design, production planning and control, quality control, material management, maintenance management.

Sales Continuous Improvement Diagram Powerpoint Presentation Templates
This is a sales continuous improvement diagram powerpoint presentation templates. This is a six stage process. The stages in this process are sales continuous improvement, value for customer, people and organization, sales and customer operation, planning and achievement, network and partnership, value proposition.

 Home
Home