Schedule
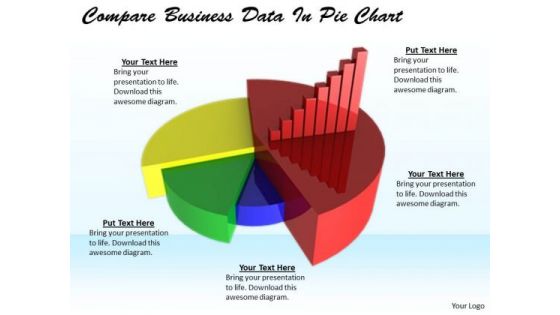
Stock Photo Develop Business Strategy Compare Data Pie Chart Stock Images
All for one and one for all. Our stock photo develop business strategy compare data pie chart stock images are all for you. Get things done on a war footing. Our marketing are excellent accelerators.
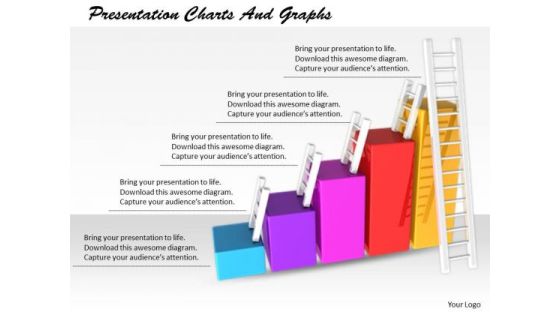
Stock Photo Innovative Marketing Concepts Presentation Charts And Graphs Business Clipart
Put In A Dollop Of Our stock photo innovative marketing concepts presentation charts and graphs business clipart Powerpoint Templates. Give Your Thoughts A Distinctive Flavor. Create Your Domain With Our Success Powerpoint Templates. Rule Minds With Your Thoughts.

Mba Models And Frameworks Arrows Pointing Inwards Chart 7 Stages Consulting Diagram
Our MBA Models And Frameworks Arrows Pointing Inwards Chart 7 Stages Consulting Diagram Powerpoint Templates Team Are A Dogged Lot. They Keep At It Till They Get It Right.
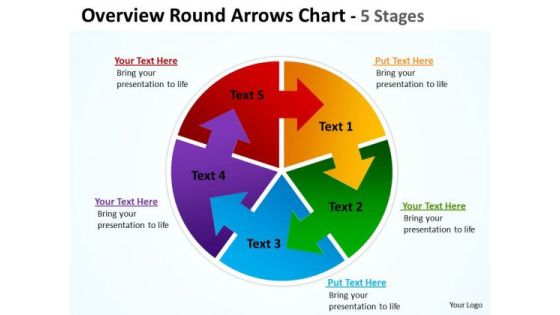
Marketing Diagram Overview Round Diagram Colorful Arrows Chart 5 Stages Consulting Diagram
Our Marketing Diagram Overview Round Diagram Colorful Arrows Chart 5 Stages Consulting Diagram Powerpoint Templates Team Are A Dogged Lot. They Keep At It Till They Get It Right.
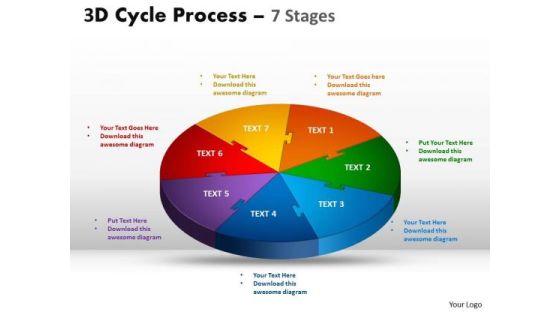
Sales Diagram 3d Cycle Process Templates Flow Diagram Chart 7 Stages Strategy Diagram
Our Sales Diagram 3D Cycle Process Templates Flow Diagram Chart 7 Stages Strategy Diagram Powerpoint Templates Team Are A Dogged Lot. They Keep At It Till They Get It Right.
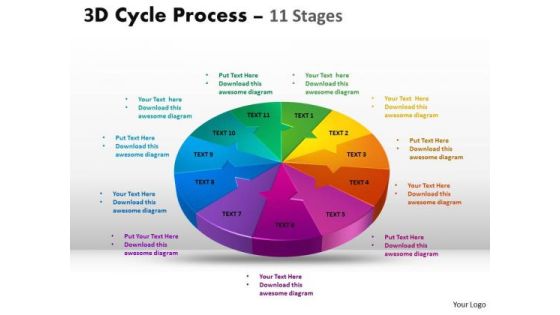
Sales Diagram 3d Cycle Process Flow Diagram Chart 11 Stages Strategy Diagram
Our Sales Diagram 3D Cycle Process Flow Diagram Chart 11 Stages Strategy Diagram Powerpoint Templates Team Are A Dogged Lot. They Keep At It Till They Get It Right.

Mba Models And Frameworks 3d Jigsaw Circular Pie Chart 12 Stages Business Diagram
Our MBA Models And Frameworks 3D Jigsaw Circular Pie Chart 12 Stages Business Diagram Powerpoint Templates Team Are A Dogged Lot. They Keep At It Till They Get It Right.
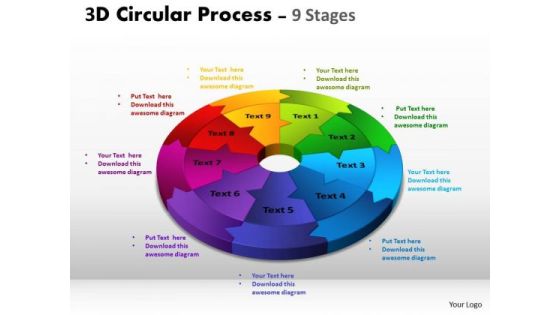
Consulting Diagram 3d Circular Process Cycle Diagram Chart 9 Stages Business Diagram
Our Consulting Diagram 3D Circular Process Cycle Diagram Chart 9 Stages Business Diagram Powerpoint Templates Team Are A Dogged Lot. They Keep At It Till They Get It Right.

Consulting Diagram 3d Circular Process Cycle Diagram Chart 10 Stages Design 2 Business Diagram
Get The Domestics Right With Our Consulting Diagram 3d Circular Process Cycle Diagram Chart 10 Stages Design 2 Business Diagram Powerpoint Templates. Create The Base For Thoughts To Grow.

Consulting Diagram 3d Circular Process Cycle Diagram Chart 11 Stages Business Diagram
Our Consulting Diagram 3d Circular Process Cycle Diagram Chart 11 Stages Business Diagram Powerpoint Templates Team Are A Dogged Lot. They Keep At It Till They Get It Right.
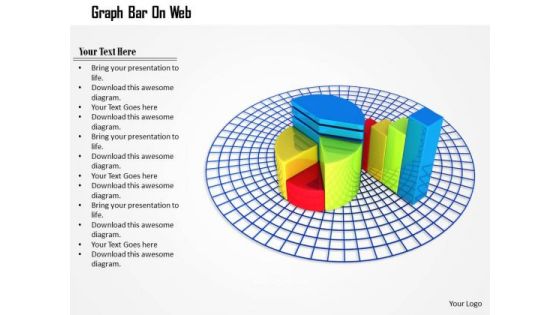
Stock Photo Pie Chart And Bar Graph On Web PowerPoint Slide
This image is designed with pie chart and bar graph on web. Use this diagram to explain your strategy to co-ordinate activities. Deliver amazing presentations to mesmerize your audience.

Stock Photo Black Brown Pie Chart For Business Result PowerPoint Slide
This high quality image is designed with pie chart. Use this image to make business reports. Use this outstanding image in presentations relating to data analysis and reports. Go ahead and add charm to your presentations.
Stock Photo Colorful 3d Pie Chart For Business Result PowerPoint Slide
This high quality image is designed with pie chart. Use this image to make business reports. Use this outstanding image in presentations relating to data analysis and reports. Go ahead and add charm to your presentations.

Business Diagram Colored 3d Flow Chart For Data Processing Presentation Template
Colored 3d flow chart has been used to design this power point template. This PPT contains the concept of data processing. Use this PPT for your data communication and analysis related presentations.
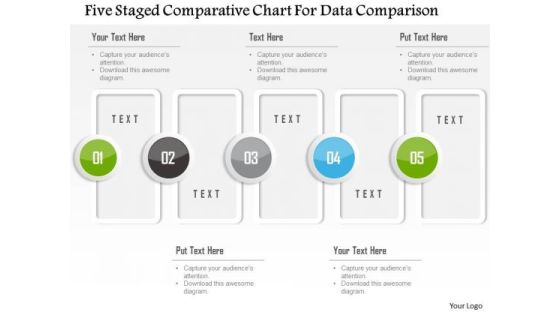
Business Diagram Five Staged Comparative Chart For Data Comparison Presentation Template
Five staged comparative chart has been used to design this power point template. This PPT contains the concept of data comparison. Use this PPT for your business and finance based data comparison in any financial presentation.
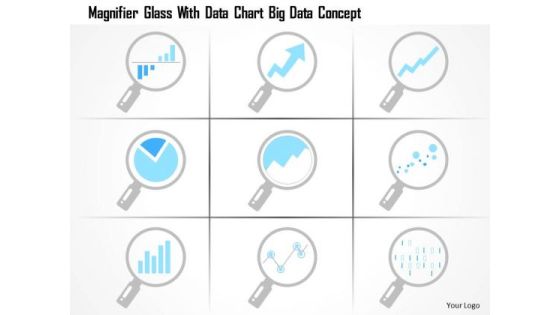
Business Diagram Magnifier Glass With Data Chart Big Data Concept Ppt Slide
This technology diagram has been designed with graphic of magnifier glass and big data chart. This diagram slide depicts the concept of data search. Use this diagram for your data search and focus related topics.

Business Diagram Four Colorful Pie Charts For Data Representation Presentation Template
This diagram is designed with four colorful pie charts. Download this diagram to analyze the key points. This diagram offers a way for your audience to visually conceptualize the process.
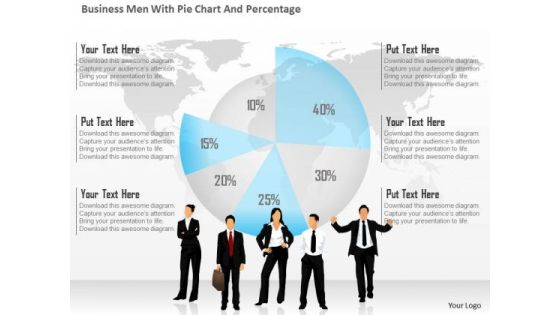
Business Diagram Business Men With Pie Chart And Percentage Presentation Template
This business diagram has been designed with graphic of business people and pie chart with percentage. This diagram is designed to depict team meeting on financial matter. This diagram offers a way for your audience to visually conceptualize the process.
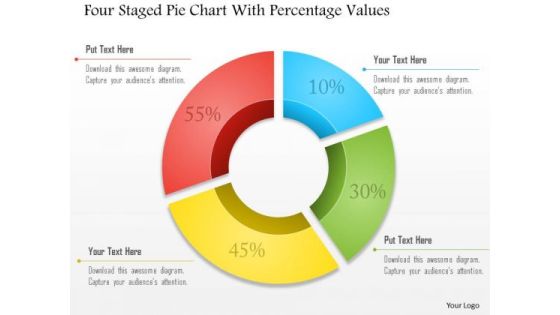
Business Diagram Four Staged Pie Chart With Percentage Values Presentation Template
Four staged pie chart and percentage values are used to design this business slide. Download this diagram to make business and financial reports. Use our above diagram to express information in a visual way.

Business Diagram Three Different Pie Charts For Result Analysis Presentation Template
Three different pie charts are used to designed this power point template slide. This PPT slide contains the concept of result analysis. Use this PPT slide for your data and process related presentations.
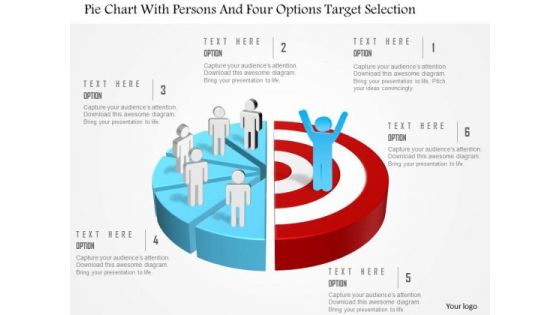
Business Diagram Pie Chart With Persons And Four Options Target Selection Presentation Template
This power point template slide has been crafted with graphic of pie chart ,persons and four options. This PPT contains the concept of option representation for targets selection. This PPT diagram is can be used business and sales presentations.
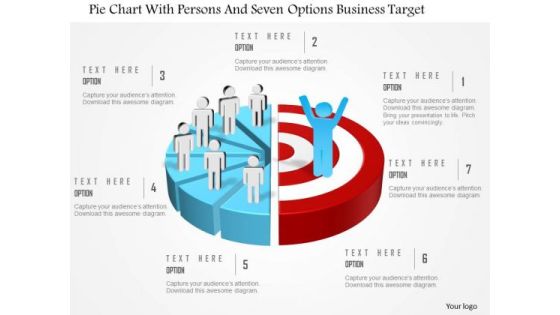
Business Diagram Pie Chart With Persons And Seven Options Business Target Presentation Template
This power point template slide has been crafted with graphic of pie chart ,persons and seven options. This PPT contains the concept of option representation for business targets. This PPT diagram is can be used business and marketing presentations.

Business Diagram Pie Chart With Persons And Three Options Marketing Targets Presentation Template
This power point template slide has been crafted with graphic of pie chart and three persons. This PPT contains the concept of option representation for marketing targets. This PPT diagram is suitable for marketing presentations.
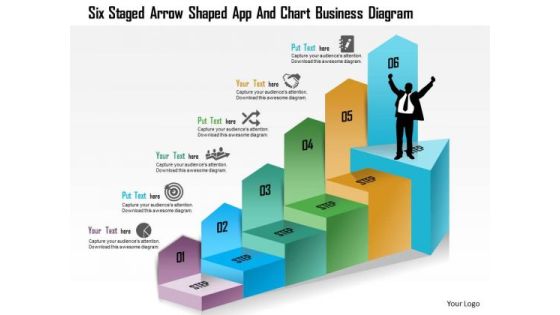
Business Diagram Six Staged Arrow Shaped App And Chart Business Diagram Presentation Template
Six staged arrow shaped aap and chart has been used to decorate this power point template. This PPT contains the concept of text representation. This PPT can be used for business and technology related topics in any presentation.
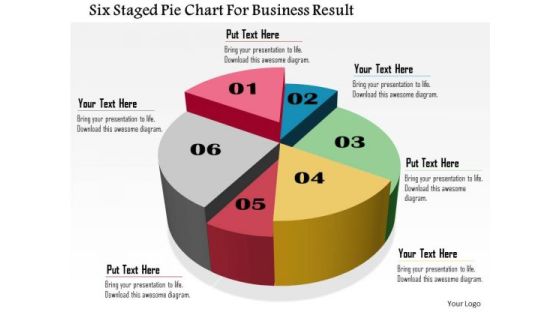
Business Daigram Six Staged Pie Chart For Business Result Presentation Templets
Six staged pie chart is used to design this business slide. Download this diagram to make business and financial reports. Use our above diagram to express information in a visual way.
Business Diagram Pie Chart With Icons For Result Analysis Presentation Template
This business slide contains graphics of pie chart with business icons. Download this impressive diagram to present marketing performance measurement. This image slide is best to present your newer thoughts.
Business Diagram Pie Chart With Icons For Financial Analysis Presentation Template
This professional business diagram slide has been designed with pie chart and icons. It contains concept of financial analysis. Use this slide to build exclusive presentations for your viewers.

Business Diagram Pie Chart In Shape Of Lock For Trading Costs Presentation Template
This slide has been designed with pie chart in shape of lock. This diagram contains the concept of trading costs, finance and marketing. Use this slide for your business related presentations.

Linear Flow Chart Of Channel Marketing Flow For Consumer Diagram Powerpoint Slides Design Templates
This is a linear flow chart of channel marketing flow for consumer diagram powerpoint slides design templates. This is a five stage process. The stages in this process are manufacture, distributor, wholesaler, retailer, consumer.

Supply Chain Web With E Commerce Retail Trade Chart Ppt Example
This is a supply chain web with e commerce retail trade chart ppt example. This is a five stage process. The stages in this process are imports, manufacturing, wholesale, retail, consumer.
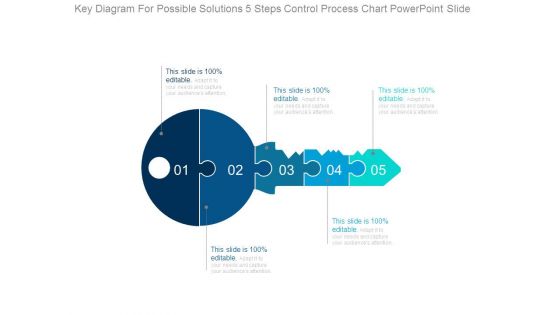
Key Diagram For Possible Solutions 5 Steps Control Process Chart Powerpoint Slide
This is a key diagram for possible solutions 5 steps control process chart powerpoint slide. This is a five stage process. The stages in this process are puzzles, business, problem, solution, game pieces, key.

Hierarchy Chart For Business Team Level Formation Ppt PowerPoint Presentation Files
This is a hierarchy chart for business team level formation ppt powerpoint presentation files. This is a six stage process. The stages in this process are business, strategy, marketing, management, communication.

5 Cylinders Column Chart For Market Growth Ppt PowerPoint Presentation Outline
This is a 5 cylinders column chart for market growth ppt powerpoint presentation outline. This is a five stage process. The stages in this process are business, marketing, icons, growth, finance.

Data Collection And Analysis Control Chart Ppt PowerPoint Presentation Example File
This is a data collection and analysis control chart ppt powerpoint presentation example file. This is a four stage process. The stages in this process are business, strategy, marketing, bar graph, growth strategy.

Competitive Analysis Template 8 Matrix Chart Ppt PowerPoint Presentation Designs Download
This is a competitive analysis template 8 matrix chart ppt powerpoint presentation designs download. This is a six stage process. The stages in this process are product quality, product fidelity, after sales service, customer service, price, shipping speed.

Customer Service Benchmarking Chart Ppt PowerPoint Presentation Infographic Template Graphics Tutorials
This is a customer service benchmarking chart ppt powerpoint presentation infographic template graphics tutorials. This is a eight stage process. The stages in this process are category, business, marketing, management.
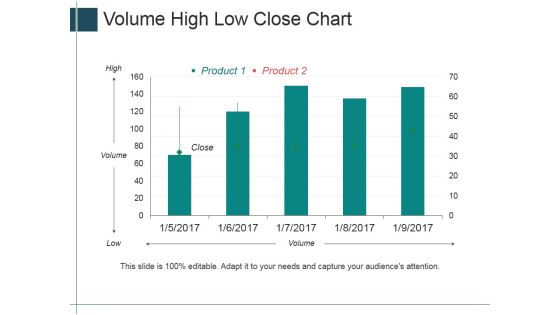
Volume High Low Close Chart Ppt PowerPoint Presentation Summary Layout Ideas
This is a volume high low close chart ppt powerpoint presentation summary layout ideas. This is a five stage process. The stages in this process are high, volume, low, close, product.

Competitive Analysis Template 6 Scatter Chart Ppt PowerPoint Presentation Icon Example Topics
This is a competitive analysis template 6 scatter chart ppt powerpoint presentation icon example topics. This is a eight stage process. The stages in this process are users interface, data import, example, pricing, support, update, tutorials, easy to use.

Competitive Analysis Template 7 Bubble Chart Ppt PowerPoint Presentation Summary Guidelines
This is a competitive analysis template 7 bubble chart ppt powerpoint presentation summary guidelines. This is a six stage process. The stages in this process are business, bubble, management, strategy, marketing.

Competitive Analysis Template 8 Matrix Chart Ppt PowerPoint Presentation Show Outfit
This is a competitive analysis template 8 matrix chart ppt powerpoint presentation show outfit. This is a six stage process. The stages in this process are product quality, product fidelity, after sales service, customer service, price, shipping speed.
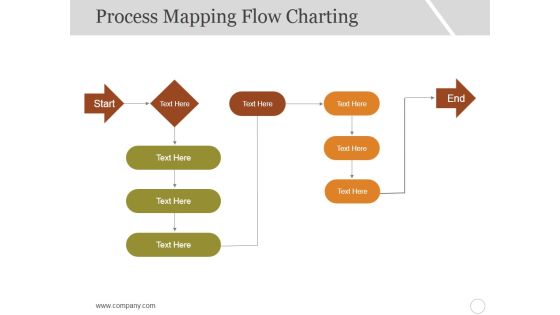
Process Mapping Flow Charting Ppt PowerPoint Presentation Infographic Template Graphics Pictures
This is a process mapping flow charting ppt powerpoint presentation infographic template graphics pictures. This is a five stage process. The stages in this process are start, end, business, marketing, management.

High Low Close Chart Template 1 Ppt PowerPoint Presentation Infographics Graphics Design
This is a high low close chart template 1 ppt powerpoint presentation infographics graphics design. This is a five stage process. The stages in this process are close, high, volume, low, open, product.
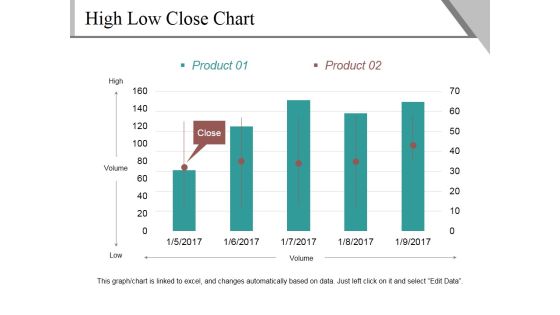
High Low Close Chart Template 2 Ppt PowerPoint Presentation Outline Show
This is a high low close chart template 2 ppt powerpoint presentation outline show. This is a five stage process. The stages in this process are high, volume, low, close, product.

Volume Open High Low Close Chart Ppt PowerPoint Presentation Infographics Guide
This is a volume open high low close chart ppt powerpoint presentation infographics guide. This is a two stage process. The stages in this process are close, high, volume, low, open, product.

Project Management Gantt Chart Template 2 Ppt PowerPoint Presentation Pictures Outfit
This is a project management gantt chart template 2 ppt powerpoint presentation pictures outfit. This is a three stage process. The stages in this process are start, duration, task, complete, sub task.

Project Management Gantt Chart Template 1 Ppt PowerPoint Presentation Show Professional
This is a project management gantt chart template 1 ppt powerpoint presentation show professional. This is a nine stage process. The stages in this process are table, business, strategy, compare, marketing.

Project Management Gantt Chart Template 2 Ppt PowerPoint Presentation Pictures Model
This is a project management gantt chart template 2 ppt powerpoint presentation pictures model. This is a four stage process. The stages in this process are table, business, strategy, compare, marketing.

Project Management Gantt Chart Template 1 Ppt PowerPoint Presentation Professional Skills
This is a project management gantt chart template 1 ppt powerpoint presentation professional skills. This is a three stage process. The stages in this process are compare, business, marketing, table, strategy.
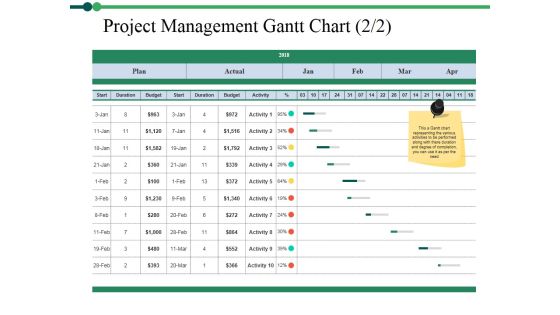
Project Management Gantt Chart Template 2 Ppt PowerPoint Presentation Layouts Smartart
This is a project management gantt chart template 2 ppt powerpoint presentation layouts smartart. This is a four stage process. The stages in this process are compare, business, marketing, table, strategy.
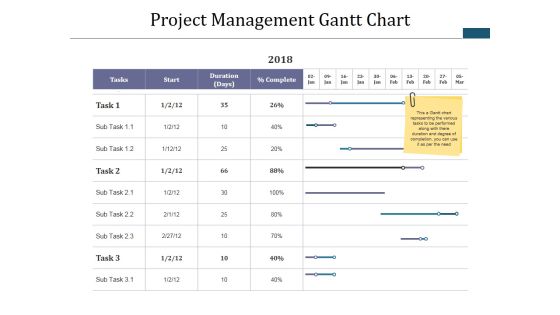
Project Management Gantt Chart Template 1 Ppt PowerPoint Presentation Infographics Tips
This is a project management gantt chart template 1 ppt powerpoint presentation infographics tips. This is a four stage process. The stages in this process are table, business, marketing, strategy, compare.
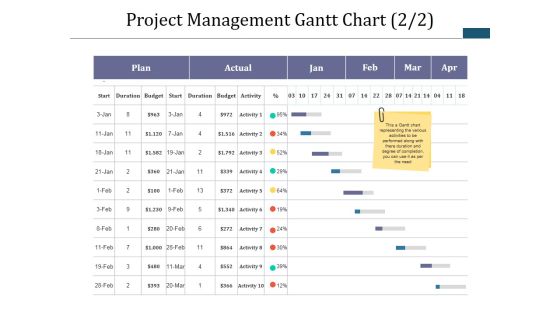
Project Management Gantt Chart Template 2 Ppt PowerPoint Presentation Infographic Template Master Slide
This is a project management gantt chart template 2 ppt powerpoint presentation infographic template master slide. This is a five stage process. The stages in this process are table, business, marketing, strategy, compare.
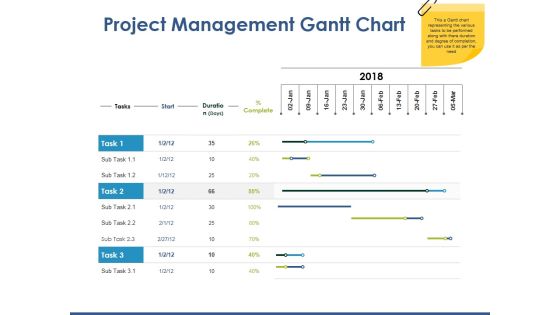
Project Management Gantt Chart Template 1 Ppt PowerPoint Presentation Professional Example File
This is a project management gantt chart template 1 ppt powerpoint presentation professional example file. This is a three stage process. The stages in this process are compare, business, strategy, marketing, table.
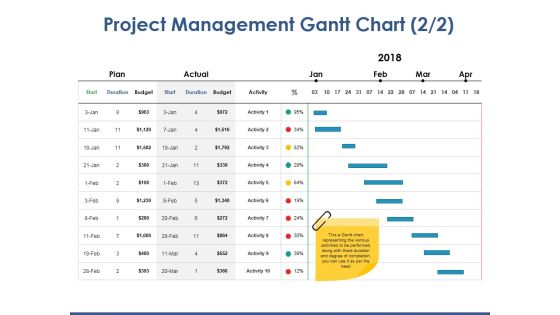
Project Management Gantt Chart Template 2 Ppt PowerPoint Presentation Inspiration Gallery
This is a project management gantt chart template 2 ppt powerpoint presentation inspiration gallery. This is a four stage process. The stages in this process are compare, table, business, strategy, marketing.

Data Collection And Analysis Control Chart Ppt PowerPoint Presentation Model Backgrounds
This is a data collection and analysis control chart ppt powerpoint presentation model backgrounds. This is a two stage process. The stages in this process are business, marketing, strategy, finance, analysis.
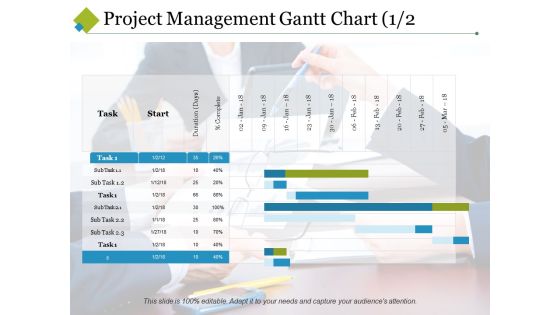
Project Management Gantt Chart Template 1 Ppt PowerPoint Presentation Visual Aids Summary
This is a project management gantt chart template 1 ppt powerpoint presentation visual aids summary. This is a two stage process. The stages in this process are start, task, sub task, duration, complete.

Business Investment Management Flow Chart Ppt PowerPoint Presentation Outline Example Topics
This is a business investment management flow chart ppt powerpoint presentation outline example topics. This is a three stage process. The stages in this process are investment, funding, private equity, venture capital.
Volume Open High Low Close Chart Ppt PowerPoint Presentation Icon Design Inspiration
This is a volume open high low close chart ppt powerpoint presentation icon design inspiration. This is a three stage process. The stages in this process are close, high, low, volume, open.

Bar Chart For Business Performance Evaluation Ppt PowerPoint Presentation Infographics Professional
This is a bar chart for business performance evaluation ppt powerpoint presentation infographics professional. This is a five stage process. The stages in this process are metrics icon, kpis icon, statistics icon.

Chart With Magnifying Glass For Business Research Ppt PowerPoint Presentation Inspiration Shapes
This is a chart with magnifying glass for business research ppt powerpoint presentation inspiration shapes. This is a two stage process. The stages in this process are metrics icon, kpis icon, statistics icon.

Six Gears Business Growth Factors Ppt PowerPoint Presentation Diagram Graph Charts
This is a six gears business growth factors ppt powerpoint presentation diagram graph charts. This is a seven stage process. The stages in this process are growth opportunity, growth drivers, market drivers.
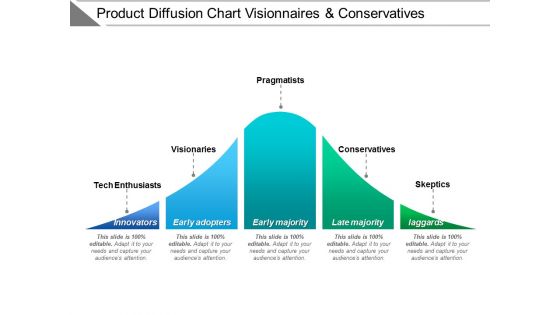
Product Diffusion Chart Visionaries And Conservatives Ppt PowerPoint Presentation Model Clipart
This is a product diffusion chart visionaries and conservatives ppt powerpoint presentation model clipart. This is a five stage process. The stages in this process are adoption curve, crossing the chasm, hype cycle.

Scatter Bubble Chart Highest Sale Ppt PowerPoint Presentation Show Slide Download
This is a scatter bubble chart highest sale ppt powerpoint presentation show slide download. This is a two stage process. The stages in this process are finance, investment, analysis, business, marketing.

Open High Low Close Chart Ppt PowerPoint Presentation Slides File Formats
This is a open high low close chart ppt powerpoint presentation slides file formats. This is a five stage process. The stages in this process are open, high, low, close, finance.

Company Competitors Analysis Chart Market Share And Return On Equity Ppt PowerPoint Presentation Picture
This is a company competitors analysis chart market share and return on equity ppt powerpoint presentation picture. This is a seven stage process. The stages in this process are competitive analysis, benchmark competition, competition landscape.

Volume Open High Low Close Chart Ppt PowerPoint Presentation Professional Maker
This is a volume open high low close chart ppt powerpoint presentation professional maker. This is a two stage process. The stages in this process are percentage, product, marketing.

Volume Open High Low Close Chart Ppt PowerPoint Presentation Model Inspiration
This is a volume open high low close chart ppt powerpoint presentation model inspiration. This is a three stage process. The stages in this process are business, management, strategy, marketing, sales.
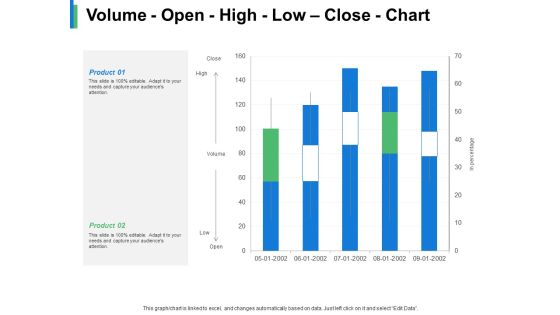
Volume Open High Low Close Chart Product Ppt PowerPoint Presentation Gallery Example
This is a volume open high low close chart product ppt powerpoint presentation gallery example. This is a two stage process. The stages in this process are business, management, strategy, marketing, sales.

Pie Chart With Dollar Symbol Ppt PowerPoint Presentation Infographic Template Graphics Design
This is a pie chart with dollar symbol ppt powerpoint presentation infographic template graphics design. This is a two stage process. The stages in this process are sectioned circle, segmented circle, partitioned circle.
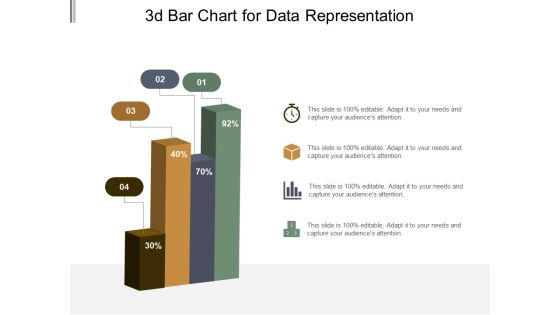
3D Bar Chart For Data Representation Ppt PowerPoint Presentation Model Graphic Tips
This is a 3d bar chart for data representation ppt powerpoint presentation model graphic tips. This is a four stage process. The stages in this process are art, colouring, paint brush.

3D Bar Chart For Percentage Values Comparison Ppt PowerPoint Presentation Professional Visual Aids
This is a 3d bar chart for percentage values comparison ppt powerpoint presentation professional visual aids. This is a five stage process. The stages in this process are art, colouring, paint brush.

3D Bar Chart For Technical Analysis Ppt PowerPoint Presentation Summary Visuals
This is a 3d bar chart for technical analysis ppt powerpoint presentation summary visuals. This is a five stage process. The stages in this process are art, colouring, paint brush.

3D Bar Chart To Display Data Ppt PowerPoint Presentation Icon Design Inspiration
This is a 3d bar chart to display data ppt powerpoint presentation icon design inspiration. This is a four stage process. The stages in this process are art, colouring, paint brush.

3D Chart For Graphical Display Of Data Ppt PowerPoint Presentation Styles Icon
This is a 3d chart for graphical display of data ppt powerpoint presentation styles icon. This is a four stage process. The stages in this process are art, colouring, paint brush.

3D Charts For Comparing Amounts And Volume Ppt PowerPoint Presentation Show Deck
This is a 3d charts for comparing amounts and volume ppt powerpoint presentation show deck. This is a five stage process. The stages in this process are art, colouring, paint brush.
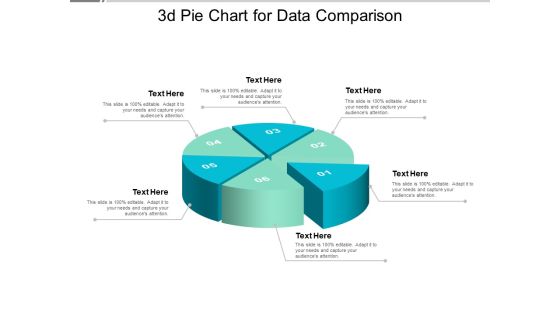
3D Pie Chart For Data Comparison Ppt PowerPoint Presentation Model Design Ideas
This is a 3d pie chart for data comparison ppt powerpoint presentation model design ideas. This is a six stage process. The stages in this process are art, colouring, paint brush.
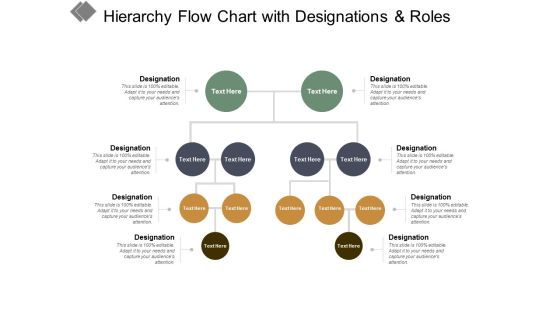
Hierarchy Flow Chart With Designations And Roles Ppt PowerPoint Presentation Styles Format Ideas
This is a hierarchy flow chart with designations and roles ppt powerpoint presentation styles format ideas. This is a four stage process. The stages in this process are business ownership, family business, owned business.
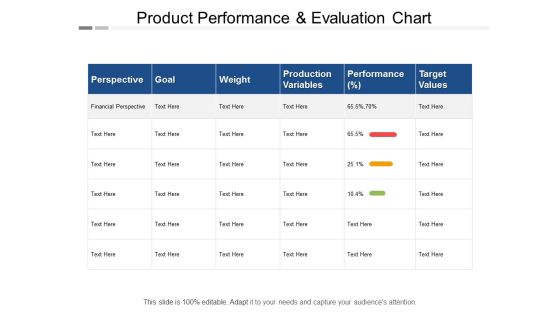
Product Performance And Evaluation Chart Ppt PowerPoint Presentation Pictures Slide Download
This is a product performance and evaluation chart ppt powerpoint presentation pictures slide download. This is a sex stage process. The stages in this process are production management, production performance, production improvement.

Bar Charts For Business Performance Analysis Ppt PowerPoint Presentation Show Slideshow
This is a bar charts for business performance analysis ppt powerpoint presentation show slideshow. This is a two stage process. The stages in this process are compare, comparison of two, competitive analysis.

Column Chart Employee Value Proposition Ppt PowerPoint Presentation Slides Graphics Design
This is a column chart employee value proposition ppt powerpoint presentation slides graphics design. This is a two stage process. The stages in this process are business, management, strategy, analysis, marketing.

Donut Pie Chart Sample Budget Ppt Ppt PowerPoint Presentation Layouts Styles
This is a donut pie chart sample budget ppt ppt powerpoint presentation layouts styles. This is a four stage process. The stages in this process are business, management, strategy, analysis, marketing.

Billing Cycle Flow Chart Print And Post Bills Ppt Powerpoint Presentation Model Portfolio
This is a billing cycle flow chart print and post bills ppt powerpoint presentation model portfolio. This is a six stage process. The stages in this process are billing process, billing procedure, billing cycle.

Billing Process Flow Chart Receive Bill Data Adjust Invoices Ppt Powerpoint Presentation Pictures Introduction
This is a billing process flow chart receive bill data adjust invoices ppt powerpoint presentation pictures introduction. This is a eight stage process. The stages in this process are billing process, billing procedure, billing cycle.

Career Progression And Growth Chart Ppt PowerPoint Presentation Professional Design Inspiration
This is a career progression and growth chart ppt powerpoint presentation professional design inspiration. This is a three stage process. The stages in this process are career progression, career aspiration, career promotion powerpoint presentation slides.
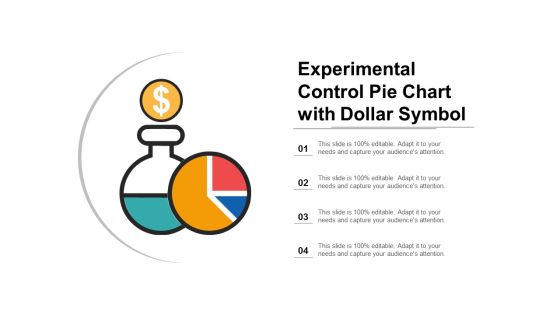
Experimental Control Pie Chart With Dollar Symbol Ppt Powerpoint Presentation Infographics Background Images
This is a experimental control pie chart with dollar symbol ppt powerpoint presentation infographics background images. This is a four stage process. The stages in this process are exploratory, experimental, investigational.

Insurance Claim Workflow Chart Claim Scrutiny Pay Ppt Powerpoint Presentation Styles Portfolio
This is a insurance claim workflow chart claim scrutiny pay ppt powerpoint presentation styles portfolio. This is a four stage process. The stages in this process are insurance claim process, insurance claim steps, insurance claim procedure.
Mediclaim Process Flow Chart With Icons Ppt Powerpoint Presentation Outline Templates
This is a mediclaim process flow chart with icons ppt powerpoint presentation outline templates. This is a five stage process. The stages in this process are insurance claim process, insurance claim steps, insurance claim procedure.

Data Comparison And Analysis Chart Ppt Powerpoint Presentation File Background Images
This is a data comparison and analysis chart ppt powerpoint presentation file background images. This is a four stage process. The stages in this process are data presentation, content presentation, information presentation.

Cost Reduction Analysis Bar Chart Ppt Powerpoint Presentation File Graphics Design
This is a cost reduction analysis bar chart ppt powerpoint presentation file graphics design. This is a five stage process. The stages in this process are data analysis, data science, information science.

Improve Sales Performance And Productivity Ppt PowerPoint Presentation Diagram Graph Charts
This is a improve sales performance and productivity ppt powerpoint presentation diagram graph charts. This is a four stage process. The stages in this process are marketing effort, branding initiative, marketing initiatives.

Computer Screen With Pie Chart For Data Analysis Ppt PowerPoint Presentation Show Picture
This is a computer screen with pie chart for data analysis ppt powerpoint presentation show picture. This is a six stage process. The stages in this process are computer icon, desktop icon, laptop screen icon.

Business Performance Evaluation And Feedback Flow Chart Ppt Powerpoint Presentation Model Example Topics
This is a business performance evaluation and feedback flow chart ppt powerpoint presentation model example topics. This is a three stage process. The stages in this process are performance management, structure conduct performance, performance review and analysis.
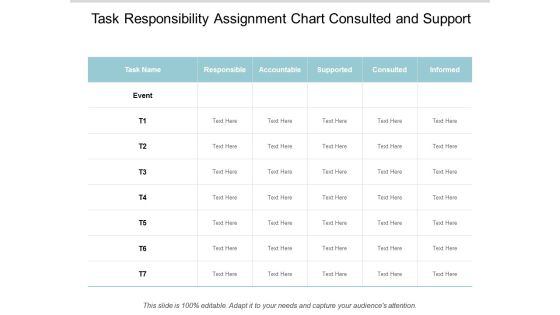
Task Responsibility Assignment Chart Consulted And Support Ppt Powerpoint Presentation Styles Background
This is a task responsibility assignment chart consulted and support ppt powerpoint presentation styles background. This is a seven stage process. The stages in this process are authority matrix, responsibility matrix, leadership matrix.

Arrow Puzzle 3d Column Chart With Icons Ppt Powerpoint Presentation Icon Deck
This is a arrow puzzle 3d column chart with icons ppt powerpoint presentation icon deck. This is a five stage process. The stages in this process are strategy, problem solution, arrow puzzle.

Pie Chart For Data Presentation Vector Ppt Powerpoint Presentation Summary Display
This is a pie chart for data presentation vector ppt powerpoint presentation summary display. This is a three stage process. The stages in this process are data visualization icon, data management icon.

Pie Of Pie Chart Finance Ppt Powerpoint Presentation File Design Templates
This is a pie of pie chart finance ppt powerpoint presentation file design templates. This is a four stage process. The stages in this process are finance, marketing, management, investment, analysis.

Employee Time Management Evaluation Chart Ppt PowerPoint Presentation File Graphic Images
This is a employee time management evaluation chart ppt powerpoint presentation file graphic images. This is a two stage process. The stages in this process are compare, business, management, marketing.

Bar Chart With Growth Arrow For Business Expansion Ppt Powerpoint Presentation File Vector
This is a bar chart with growth arrow for business expansion ppt powerpoint presentation file vector. This is a two stage process. The stages in this process are expanding, business development, business expansion.

Bar Chart With Magnifying Glass For Financial Analysis Ppt Powerpoint Presentation Infographics Designs Download
This is a bar chart with magnifying glass for financial analysis ppt powerpoint presentation infographics designs download. This is a three stage process. The stages in this process are business metrics, business kpi, business dashboard.

Business Analysis Data Charts And Reports Ppt Powerpoint Presentation Ideas Portrait
This is a business analysis data charts and reports ppt powerpoint presentation ideas portrait. This is a three stage process. The stages in this process are business metrics, business kpi, business dashboard.

Computer Screen With Business Data Charts Ppt Powerpoint Presentation Show Vector
This is a computer screen with business data charts ppt powerpoint presentation show vector. This is a four stage process. The stages in this process are business metrics, business kpi, business dashboard.

Data Statistics Charts And Key Performance Indicators Ppt Powerpoint Presentation Layouts Guide
This is a data statistics charts and key performance indicators ppt powerpoint presentation layouts guide. This is a four stage process. The stages in this process are business metrics, business kpi, business dashboard.

Financial Charts And Graphs For Statistical Analysis Ppt Powerpoint Presentation Show Layout
This is a financial charts and graphs for statistical analysis ppt powerpoint presentation show layout. This is a four stage process. The stages in this process are business metrics, business kpi, business dashboard.
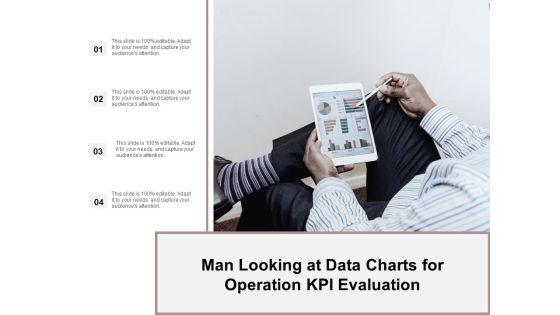
Man Looking At Data Charts For Operation Kpi Evaluation Ppt Powerpoint Presentation Ideas Demonstration
This is a man looking at data charts for operation kpi evaluation ppt powerpoint presentation ideas demonstration. This is a four stage process. The stages in this process are business metrics, business kpi, business dashboard.

Contract Administration And Management Flow Chart Ppt Powerpoint Presentation File Backgrounds
This is a contract administration and management flow chart ppt powerpoint presentation file backgrounds. This is a four stage process. The stages in this process are contract structure, contract framework, contract model.
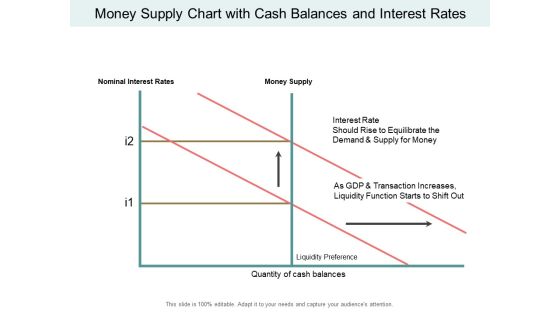
Money Supply Chart With Cash Balances And Interest Rates Ppt PowerPoint Presentation Inspiration Background Images
This is a money supply chart with cash balances and interest rates ppt powerpoint presentation inspiration background images. This is a two stage process. The stages in this process are liquidity, cash assets, solvency.

Thank You Consumer Service Process Flow Chart Ppt Powerpoint Presentation Gallery Outfit
This is a thank you consumer service process flow chart ppt powerpoint presentation gallery outfit. This is a one stage process. The stages in this process are thank you.

Pie Chart To Survey Business Outcomes Ppt Powerpoint Presentation Infographic Template Gridlines
This is a pie chart to survey business outcomes ppt powerpoint presentation infographic template gridlines. This is a seven stage process. The stages in this process are business outcomes, business results, business output.

Donut Chart Finance Marketing Ppt Powerpoint Presentation Infographics Skills Ppt Powerpoint Presentation File Skills
This is a donut chart finance marketing ppt powerpoint presentation infographics skills ppt powerpoint presentation file skills. This is a four stage process. The stages in this process are finance, marketing, management, investment, analysis.

Product Backlog Process Flow Chart Ppt PowerPoint Presentation Model Design Templates
This is a product backlog process flow chart ppt powerpoint presentation model design templates. This is a two stage process. The stages in this process are backlog, uncompleted work, pending work.
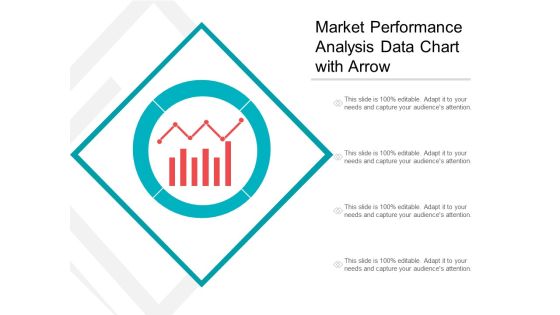
Market Performance Analysis Data Chart With Arrow Ppt PowerPoint Presentation Inspiration Graphics
This is a market performance analysis data chart with arrow ppt powerpoint presentation inspiration graphics. This is a four stage process. The stages in this process are marketing analytics, marketing performance, marketing discovery.
Marketing Campaign Development Process Ppt PowerPoint Presentation Diagram Graph Charts Cpb
This is a marketing campaign development process ppt powerpoint presentation diagram graph charts cpb. This is a four stage process. The stages in this process are marketing campaign development process.
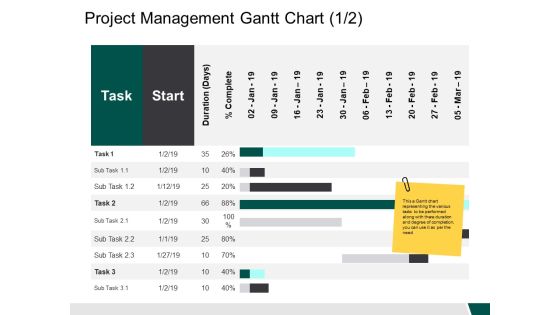
Project Management Gantt Chart Start Ppt PowerPoint Presentation Outline Example Introduction
This is a project management gantt chart start ppt powerpoint presentation outline example introduction. This is a two stage process. The stages in this process are business, management, strategy, analysis, marketing.

Project Management Gantt Chart Activity Ppt PowerPoint Presentation Model Background Designs
This is a project management gantt chart activity ppt powerpoint presentation model background designs. This is a three stage process. The stages in this process are marketing, business, management, compare.
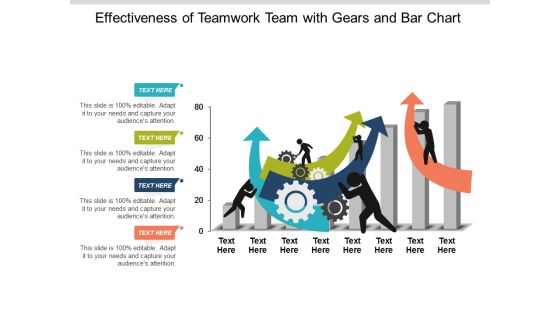
Effectiveness Of Teamwork Team With Gears And Bar Chart Ppt Powerpoint Presentation Ideas Information
This is a effectiveness of teamwork team with gears and bar chart ppt powerpoint presentation ideas information. This is a four stage process. The stages in this process are team performance, member performance, group performance.
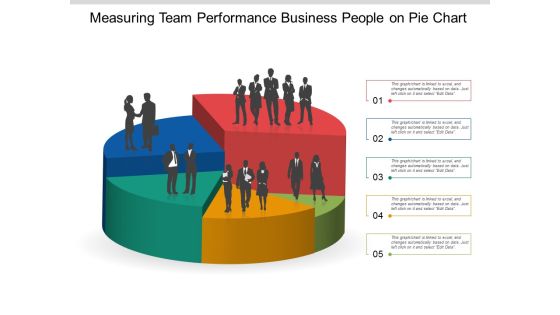
Measuring Team Performance Business People On Pie Chart Ppt Powerpoint Presentation Gallery Smartart
This is a measuring team performance business people on pie chart ppt powerpoint presentation gallery smartart. This is a five stage process. The stages in this process are team performance, member performance, group performance.
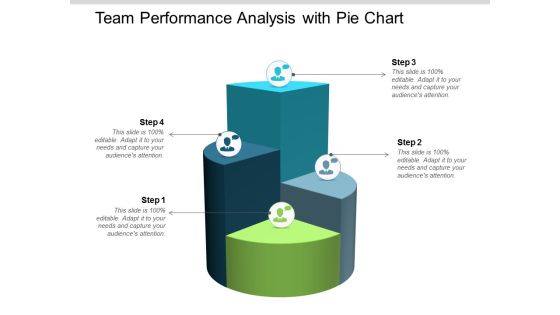
Team Performance Analysis With Pie Chart Ppt Powerpoint Presentation Infographic Template Slideshow
This is a team performance analysis with pie chart ppt powerpoint presentation infographic template slideshow. This is a four stage process. The stages in this process are team performance, member performance, group performance.
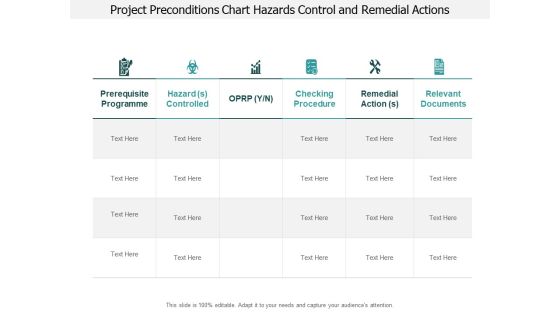
Project Preconditions Chart Hazards Control And Remedial Actions Ppt PowerPoint Presentation Pictures Show
This is a project preconditions chart hazards control and remedial actions ppt powerpoint presentation pictures show. This is a six stage process. The stages in this process are need, requirement, prerequisite.
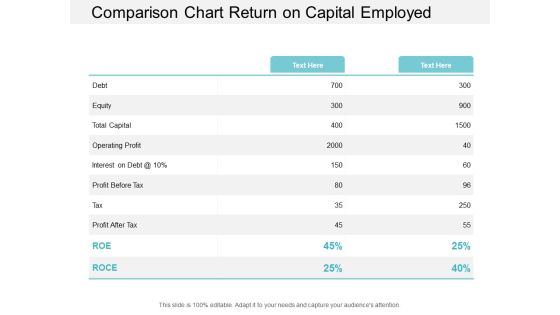
Comparison Chart Return On Capital Employed Ppt PowerPoint Presentation Portfolio Templates
This is a comparison chart return on capital employed ppt powerpoint presentation portfolio templates. This is a two stage process. The stages in this process are accounting ratio, roce, return on capital employed.
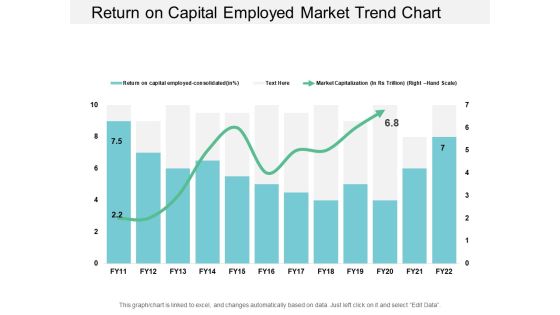
Return On Capital Employed Market Trend Chart Ppt PowerPoint Presentation Styles Examples
This is a return on capital employed market trend chart ppt powerpoint presentation styles examples. This is a two stage process. The stages in this process are accounting ratio, roce, return on capital employed.

Return On Capital Employed Product Performance Chart Ppt PowerPoint Presentation Portfolio Visuals
This is a return on capital employed product performance chart ppt powerpoint presentation portfolio visuals. This is a three stage process. The stages in this process are accounting ratio, roce, return on capital employed.
Risk Assessment Chart Report Vector Icon Ppt PowerPoint Presentation Ideas Deck
This is a risk assessment chart report vector icon ppt powerpoint presentation ideas deck. This is a four stage process. The stages in this process are risk management, governance icon, compliance icon.

Gantt Chart For Project Management And Process Mapping Ppt PowerPoint Presentation Model Styles
This is a gantt chart for project management and process mapping ppt powerpoint presentation model styles. This is a four stage process. The stages in this process are swim lane diagram, flowchart, management.

Project Management Swim Lane Flow Chart Ppt PowerPoint Presentation Pictures Brochure
This is a project management swim lane flow chart ppt powerpoint presentation pictures brochure. This is a four stage process. The stages in this process are swim lane diagram, flowchart, management.
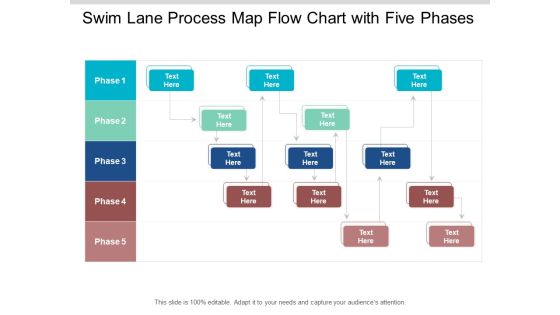
Swim Lane Process Map Flow Chart With Five Phases Ppt PowerPoint Presentation Layouts Example
This is a swim lane process map flow chart with five phases ppt powerpoint presentation layouts example. This is a five stage process. The stages in this process are swim lane diagram, flowchart, management.

Donut Pie Chart Marketing Ppt Powerpoint Presentation Infographic Template Graphics Template
This is a donut pie chart marketing ppt powerpoint presentation infographic template graphics template. This is a six stage process. The stages in this process are finance, marketing, management, investment, analysis.
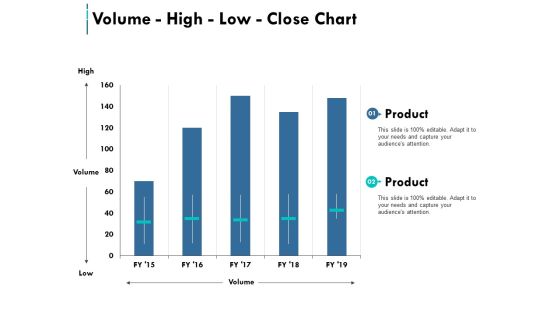
Volume High Low Close Chart Ppt PowerPoint Presentation Pictures Graphics Example
This is a volume high low close chart ppt powerpoint presentation pictures graphics example. This is a two stage process. The stages in this process are marketing, business, management.
Percentage Value Comparison Pie Chart Icon Ppt PowerPoint Presentation Model Clipart Images
This is a percentage value comparison pie chart icon ppt powerpoint presentation model clipart images. This is a three stage process. The stages in this process are percentage icon, dividend icon, portion icon.

Timeline For Application Development Design Implement And Release Ppt PowerPoint Presentation Diagram Graph Charts
This is a timeline for application development design implement and release ppt powerpoint presentation diagram graph charts. This is a five stage process. The stages in this process are overlapping timeline, overlapping roadmap, overlapping linear roadmap.

Thank You Customer Service Process Flow Chart Ppt PowerPoint Presentation Slides Ideas
This is a thank you customer service process flow chart ppt powerpoint presentation slides ideas. This is a one stage process. The stages in this process are thank you, greeting, word.

Customer Service Process Flow Chart Ppt PowerPoint Presentation Complete Deck With Slides
This is a customer service process flow chart ppt powerpoint presentation complete deck with slides. This is a one stage process. The stages in this process are business, management, marketing.

Financial Success Arrow On Bar Chart Ppt PowerPoint Presentation Ideas Display
This is a financial success arrow on bar chart ppt powerpoint presentation ideas display. This is a four stage process. The stages in this process are rising arrow, growing arrow, increasing arrow.
Financial Charts Data Analysis Vector Icon Ppt PowerPoint Presentation Visual Aids Summary Cpb
This is a financial charts data analysis vector icon ppt powerpoint presentation visual aids summary cpb. This is a three stage process. The stages in this process are data analysis, analytics architecture, analytics framework.
Workload Management Chart With Employee Name And Activity Ppt PowerPoint Presentation Icon
This is a workload management chart with employee name and activity ppt powerpoint presentation icon. This is a eight stage process. The stages in this process are activity tracker, business, marketing.

Cpm Chart For Project Management Ppt PowerPoint Presentation Portfolio Background Image
This is a cpm chart for project management ppt powerpoint presentation portfolio background image. This is a eleven stage process. The stages in this process are critical path method, critical path analysis, cpm.
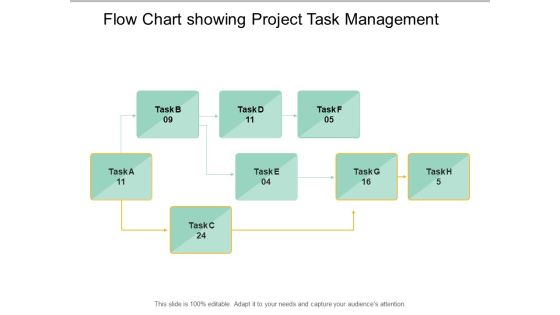
Flow Chart Showing Project Task Management Ppt PowerPoint Presentation Styles Smartart
This is a flow chart showing project task management ppt powerpoint presentation styles smartart. This is a eight stage process. The stages in this process are critical path method, critical path analysis, cpm.
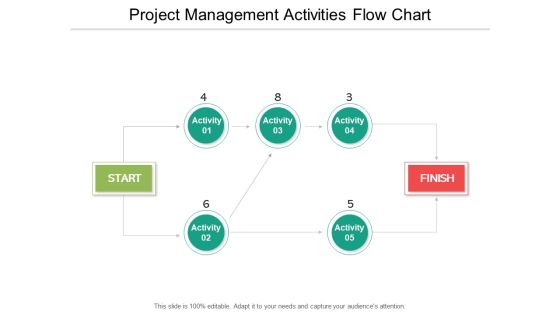
Project Management Activities Flow Chart Ppt PowerPoint Presentation File Example File
This is a project management activities flow chart ppt powerpoint presentation file example file. This is a seven stage process. The stages in this process are critical path method, critical path analysis, cpm.
Product Features Comparison Chart With Icons Ppt Powerpoint Presentation Portfolio Diagrams
This is a product features comparison chart with icons ppt powerpoint presentation portfolio diagrams. This is a four stage process. The stages in this process are product differentiation, product comparison, brand differentiation.

Two Products Features And Performance Comparison Chart Ppt Powerpoint Presentation Ideas Layout Ideas
This is a two products features and performance comparison chart ppt powerpoint presentation ideas layout ideas. This is a two stage process. The stages in this process are product differentiation, product comparison, brand differentiation.
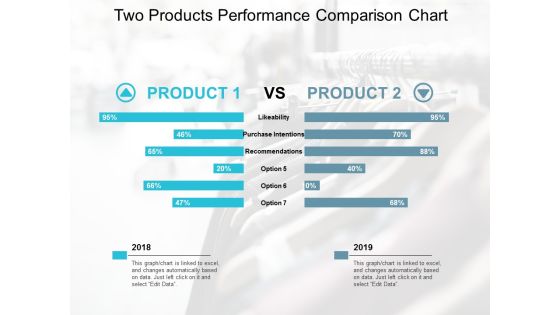
Two Products Performance Comparison Chart Ppt Powerpoint Presentation Outline Design Inspiration
This is a two products performance comparison chart ppt powerpoint presentation outline design inspiration. The topics discussed in this diagram are product differentiation, product comparison, brand differentiation. This is a completely editable PowerPoint presentation, and is available for immediate download.

Bar Chart Showing Consumer Adoption Patterns Ppt Powerpoint Presentation Outline Professional
This is a bar chart showing consumer adoption patterns ppt powerpoint presentation outline professional. The topics discussed in this diagram are customer service, customer success, customer adoption. This is a completely editable PowerPoint presentation, and is available for immediate download.
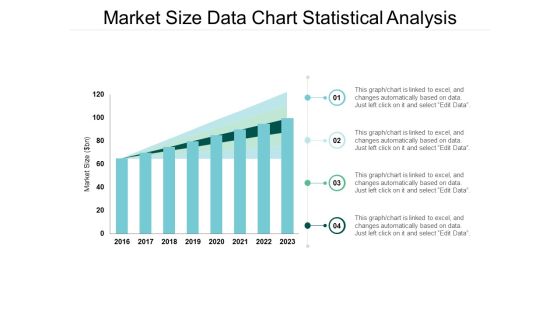
Market Size Data Chart Statistical Analysis Ppt Powerpoint Presentation Model Format
This is a market size data chart statistical analysis ppt powerpoint presentation model format. The topics discussed in this diagram are market growth, market opportunity, market profitability. This is a completely editable PowerPoint presentation, and is available for immediate download.
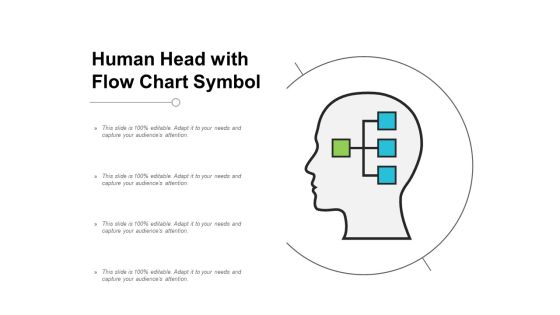
Human Head With Flow Chart Symbol Ppt Powerpoint Presentation Ideas Design Templates
This is a human head with flow chart symbol ppt powerpoint presentation ideas design templates. This is a one stage process. The stages in this process are brainstorming, thinking man, innovative man.
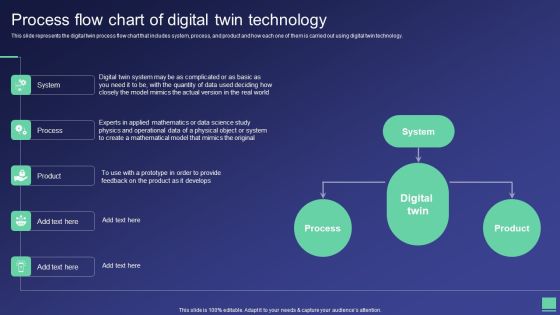
Digital Twin Tech IT Process Flow Chart Of Digital Twin Technology Structure PDF
This slide represents the digital twin process flow chart that includes system, process, and product and how each one of them is carried out using digital twin technology. Presenting this PowerPoint presentation, titled Digital Twin Tech IT Process Flow Chart Of Digital Twin Technology Structure PDF, with topics curated by our researchers after extensive research. This editable presentation is available for immediate download and provides attractive features when used. Download now and captivate your audience. Presenting this Digital Twin Tech IT Process Flow Chart Of Digital Twin Technology Structure PDF. Our researchers have carefully researched and created these slides with all aspects taken into consideration. This is a completely customizable Digital Twin Tech IT Process Flow Chart Of Digital Twin Technology Structure PDF that is available for immediate downloading. Download now and make an impact on your audience. Highlight the attractive features available with our PPTs.

Targeted Marketing Strategic Plan For Audience Engagement Steps To Collect Data For Personalized Email Marketing Designs PDF
Whether you have daily or monthly meetings, a brilliant presentation is necessary. Targeted Marketing Strategic Plan For Audience Engagement Steps To Collect Data For Personalized Email Marketing Designs PDF can be your best option for delivering a presentation. Represent everything in detail using Targeted Marketing Strategic Plan For Audience Engagement Steps To Collect Data For Personalized Email Marketing Designs PDF and make yourself stand out in meetings. The template is versatile and follows a structure that will cater to your requirements. All the templates prepared by Slidegeeks are easy to download and edit. Our research experts have taken care of the corporate themes as well. So, give it a try and see the results.

Registrants And Attendees KPIS To Track Success Of Event Stakeholder Engagement Plan For Launch Event Icons PDF
This slide provides an overview of attendee related key metrics. The indicators covered are number of total registrants, attendee retention, turnout percentage, pageviews on microsite and device usage. Whether you have daily or monthly meetings, a brilliant presentation is necessary. Registrants And Attendees KPIS To Track Success Of Event Stakeholder Engagement Plan For Launch Event Icons PDF can be your best option for delivering a presentation. Represent everything in detail using Registrants And Attendees KPIS To Track Success Of Event Stakeholder Engagement Plan For Launch Event Icons PDF and make yourself stand out in meetings. The template is versatile and follows a structure that will cater to your requirements. All the templates prepared by Slidegeeks are easy to download and edit. Our research experts have taken care of the corporate themes as well. So, give it a try and see the results.
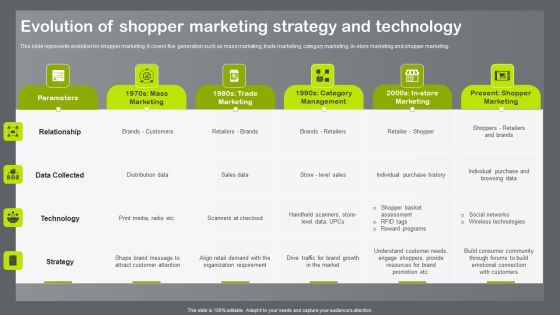
Shopper And Client Marketing Plan To Boost Sales Evolution Of Shopper Marketing Strategy And Technology Background PDF
This slide represents evolution for shopper marketing. It covers five generation such as mass marketing, trade marketing, category marketing, in-store marketing and shopper marketing. Whether you have daily or monthly meetings, a brilliant presentation is necessary. Shopper And Client Marketing Plan To Boost Sales Evolution Of Shopper Marketing Strategy And Technology Background PDF can be your best option for delivering a presentation. Represent everything in detail using Shopper And Client Marketing Plan To Boost Sales Evolution Of Shopper Marketing Strategy And Technology Background PDF and make yourself stand out in meetings. The template is versatile and follows a structure that will cater to your requirements. All the templates prepared by Slidegeeks are easy to download and edit. Our research experts have taken care of the corporate themes as well. So, give it a try and see the results.

Tech Support Process Flow Chart Customer Support Workflow To Improve Communication Information PDF
This slide covers technical support workflow to improve communication. It involves tickets submitted by customer, case assigned and created, alerts sent to support team and request closed. Presenting six to dispense important information. This template comprises six stages. It also presents valuable insights into the topics including Tickets Reviewed, Priority Basis, Support Team, Resolves Issues. This is a completely customizable PowerPoint theme that can be put to use immediately. So, download it and address the topic impactfully.

Project QA With Quality Management Plan Introduction PDF
The slide showcases the steps of a quality management plan which provides a consistent foundation for the program manager and team members in developing the plan to ensures that best product is being developed and delivered to your customers. It covers plan development of quality management plan, execute the quality management plan, perform quality checks and take corrective actions. Persuade your audience using this Project QA With Quality Management Plan Introduction PDF. This PPT design covers four stages, thus making it a great tool to use. It also caters to a variety of topics including Plan Development Of QMP, Perform Quality Checks, Take Corrective Actions. Download this PPT design now to present a convincing pitch that not only emphasizes the topic but also showcases your presentation skills.
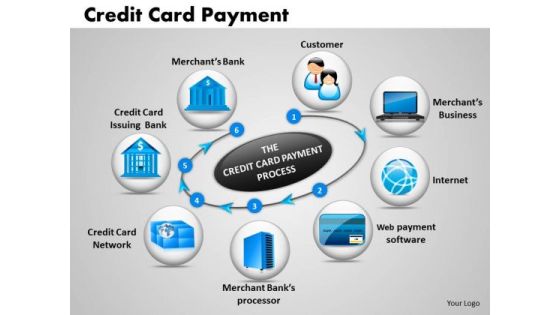
Business Circle Charts PowerPoint Templates Business Credit Card Payment Ppt Slides
Business Circle Charts PowerPoint Templates Business Credit Card Payment PPT Slides-This PowerPoint diagram shows Circles representing related points in an idea. You can also use it as credit card payment slide-Business Circle Charts PowerPoint Templates Business Credit Card Payment PPT Slides-This template can be used for presentations relating to Account, Bank, Business, Buy, Buying, Cards, Cash, Chips, Close-Up, Commerce, Credit, Credits, Date, Ecommerce, Expiration, Expire, Expired, Finance, Financial, Gold, Limit, Macro, Master, Money, Now, Online, Order, Paid, Pay, Paying, Payment
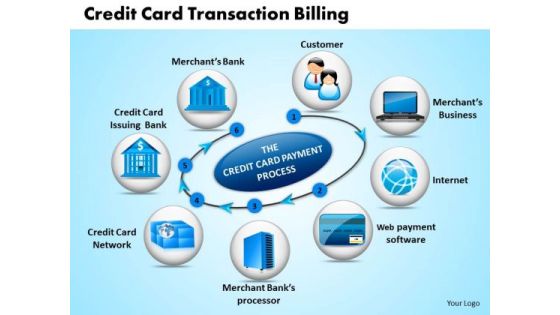
Business Circle Charts PowerPoint Templates Business Credit Card Transaction Billing Ppt Slides
Business Circle Charts PowerPoint Templates Business credit card transaction billing PPT Slides-This PowerPoint diagram shows Circles representing related points in an idea. You can also use it as credit card transaction slide-Business Circle Charts PowerPoint Templates Business credit card transaction billing PPT Slides-This template can be used for presentations relating to Account, Bank, Business, Buy, Buying, Cards, Cash, Chips, Close-Up, Commerce, Credit, Credits, Date, Ecommerce, Expiration, Expire, Expired, Finance, Financial, Gold, Limit, Macro, Master, Money, Now, Online, Order, Paid, Pay, Paying, Payment

Business Circle Charts PowerPoint Templates Business Periodic Table Of Elements Ppt Slides
Business Circle Charts PowerPoint Templates Business periodic table of elements PPT Slides-Use this graphic to represent a continuing sequence of stages, tasks, or events in a circular flow and emphasize the connection between all components. -Business Circle Charts PowerPoint Templates Business periodic table of elements PPT Slides-This template can be used for presentations relating to Actinoids, Atom, Atomic, Chemistry, Electrons, Element, Helium, Hydrogen, Lanthanoids, Liquid, Molecule, Noble, Periodic, Physics, Plutonium, Quantum, Radium, Science, Scientific, Solid, Symbol, Table
Business Chart PowerPoint Templates Business Creative Labels Or Text Boxes Ppt Slides
Business Chart PowerPoint Templates Business creative labels or text boxes PPT Slides-This PowerPoint text boxes diagram template is designed to help you place your text in a professional layout. Thus an excellent graphic to attract the attention of and understanding by your audience.-Business Chart PowerPoint Templates Business creative labels or text boxes PPT Slides-This ppt can be used for concepts relating to- textboxes PowerPoint, text boxes presentation and PowerPoint text.
Business Chart PowerPoint Templates Business Peeled Back Label Stickers Ppt Slides
Business Chart PowerPoint Templates Business peeled back label stickers PPt Slides-This PowerPoint text boxes diagram template is designed to help you place your text in a professional layout. Thus an excellent graphic to attract the attention of and understanding by your audience. Business Chart PowerPoint Templates Business peeled back label stickers PPt Slides-This ppt can be used for concepts relating to- textboxes PowerPoint, text boxes presentation and PowerPoint text.

Ppt Linear Flow Process Charts 3 Power Point Stage Style1 PowerPoint Templates
PPT linear flow process charts 3 power point stage style1 PowerPoint Templates-You can show various processes with these linear designed puzzle pieces. The separate pieces are in linear order. Arrow in the end can declare a process as concluded.-PPT linear flow process charts 3 power point stage style1 PowerPoint Templates-Amusement, Arrow, Board, Cardboard, Children, Deficient, Direction, Diversion, Entertainment, Game, Illustration, Image, Jigsaw, Logo, Lots, Many, Paper, Perspective, Pieces, Play, Puzzle, Vector

Market Development Matrix Chart Ppt PowerPoint Presentation Styles Example Introduction Cpb
Presenting this set of slides with name market development matrix chart ppt powerpoint presentation styles example introduction cpb. This is an editable Powerpoint five stages graphic that deals with topics like market development matrix chart to help convey your message better graphically. This product is a premium product available for immediate download and is 100 percent editable in Powerpoint. Download this now and use it in your presentations to impress your audience.

Cash Management Process Flow Chart Ppt PowerPoint Presentation Show Icons Cpb
Presenting this set of slides with name cash management process flow chart ppt powerpoint presentation show icons cpb. This is an editable Powerpoint three stages graphic that deals with topics like cash management process flow chart to help convey your message better graphically. This product is a premium product available for immediate download and is 100 percent editable in Powerpoint. Download this now and use it in your presentations to impress your audience.

Lead Generation Process Flow Chart Ppt PowerPoint Presentation Gallery Styles Cpb
Presenting this set of slides with name lead generation process flow chart ppt powerpoint presentation gallery styles cpb. This is an editable Powerpoint three stages graphic that deals with topics like lead generation process flow chart to help convey your message better graphically. This product is a premium product available for immediate download and is 100 percent editable in Powerpoint. Download this now and use it in your presentations to impress your audience.
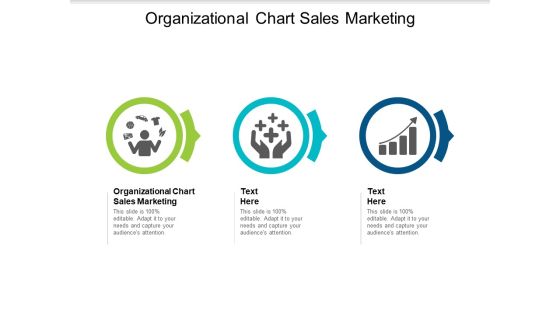
Organizational Chart Sales Marketing Ppt PowerPoint Presentation Infographic Template Microsoft Cpb
Presenting this set of slides with name organizational chart sales marketing ppt powerpoint presentation infographic template microsoft cpb. This is an editable Powerpoint three stages graphic that deals with topics like organizational chart sales marketing to help convey your message better graphically. This product is a premium product available for immediate download and is 100 percent editable in Powerpoint. Download this now and use it in your presentations to impress your audience.

Budget Management Process Flow Chart Ppt PowerPoint Presentation Infographic Template Topics Cpb
Presenting this set of slides with name budget management process flow chart ppt powerpoint presentation infographic template topics cpb. This is an editable Powerpoint five stages graphic that deals with topics like budget management process flow chart to help convey your message better graphically. This product is a premium product available for immediate download and is 100 percent editable in Powerpoint. Download this now and use it in your presentations to impress your audience.
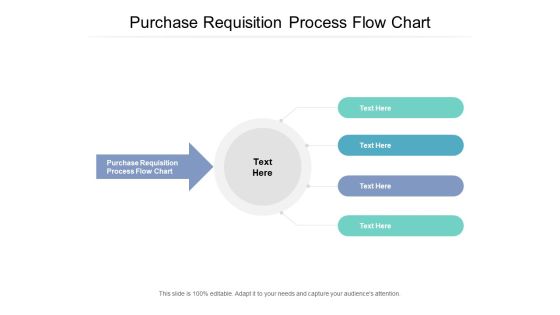
Purchase Requisition Process Flow Chart Ppt PowerPoint Presentation Layouts Design Inspiration Cpb
Presenting this set of slides with name purchase requisition process flow chart ppt powerpoint presentation layouts design inspiration cpb. This is an editable Powerpoint four stages graphic that deals with topics like purchase requisition process flow chart to help convey your message better graphically. This product is a premium product available for immediate download and is 100 percent editable in Powerpoint. Download this now and use it in your presentations to impress your audience.
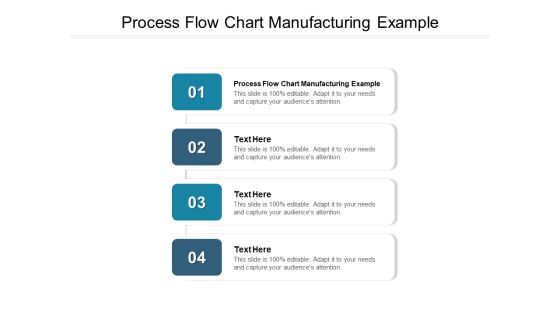
Process Flow Chart Manufacturing Example Ppt PowerPoint Presentation Model Design Ideas Cpb
Presenting this set of slides with name process flow chart manufacturing example ppt powerpoint presentation model design ideas cpb. This is an editable Powerpoint four stages graphic that deals with topics like process flow chart manufacturing example to help convey your message better graphically. This product is a premium product available for immediate download and is 100 percent editable in Powerpoint. Download this now and use it in your presentations to impress your audience.
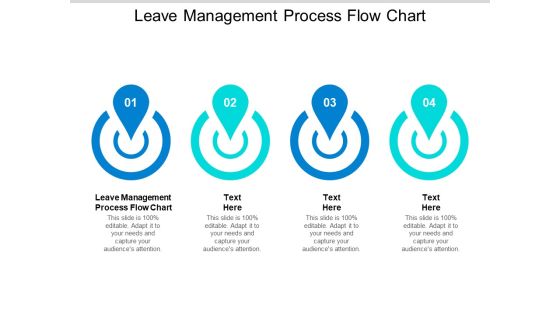
Leave Management Process Flow Chart Ppt PowerPoint Presentation Layouts Examples Cpb
Presenting this set of slides with name leave management process flow chart ppt powerpoint presentation layouts examples cpb. This is an editable Powerpoint four stages graphic that deals with topics like leave management process flow chart to help convey your message better graphically. This product is a premium product available for immediate download and is 100 percent editable in Powerpoint. Download this now and use it in your presentations to impress your audience.
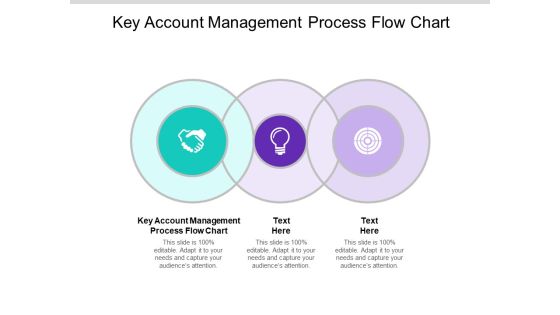
Key Account Management Process Flow Chart Ppt PowerPoint Presentation File Infographic Template Cpb
Presenting this set of slides with name key account management process flow chart ppt powerpoint presentation file infographic template cpb. This is an editable Powerpoint three stages graphic that deals with topics like key account management process flow chart to help convey your message better graphically. This product is a premium product available for immediate download and is 100 percent editable in Powerpoint. Download this now and use it in your presentations to impress your audience.
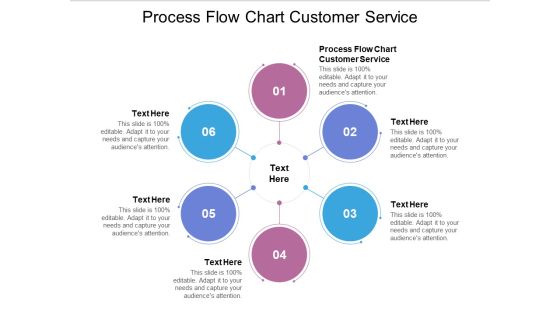
Process Flow Chart Customer Service Ppt PowerPoint Presentation Summary Elements Cpb
Presenting this set of slides with name process flow chart customer service ppt powerpoint presentation summary elements cpb. This is an editable Powerpoint six stages graphic that deals with topics like process flow chart customer service to help convey your message better graphically. This product is a premium product available for immediate download and is 100 percent editable in Powerpoint. Download this now and use it in your presentations to impress your audience.

Compensation Benefits Process Flow Chart Ppt PowerPoint Presentation Infographics Demonstration Cpb Pdf
Presenting this set of slides with name compensation benefits process flow chart ppt powerpoint presentation infographics demonstration cpb pdf. This is an editable Powerpoint three stages graphic that deals with topics like compensation benefits process flow chart to help convey your message better graphically. This product is a premium product available for immediate download and is 100 percent editable in Powerpoint. Download this now and use it in your presentations to impress your audience.

Real Time Forex Chart Ppt PowerPoint Presentation Show Graphics Tutorials Cpb Pdf
Presenting this set of slides with name real time forex chart ppt powerpoint presentation show graphics tutorials cpb pdf. This is an editable Powerpoint five stages graphic that deals with topics like real time forex chart to help convey your message better graphically. This product is a premium product available for immediate download and is 100 percent editable in Powerpoint. Download this now and use it in your presentations to impress your audience.
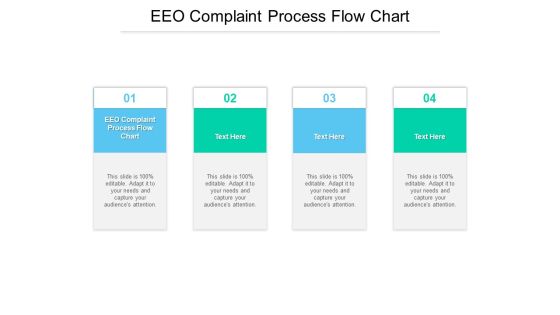
EEO Complaint Process Flow Chart Ppt PowerPoint Presentation Outline Cpb Pdf
Presenting this set of slides with name eeo complaint process flow chart ppt powerpoint presentation outline cpb pdf. This is an editable Powerpoint four stages graphic that deals with topics like eeo complaint process flow chart to help convey your message better graphically. This product is a premium product available for immediate download and is 100 percent editable in Powerpoint. Download this now and use it in your presentations to impress your audience.

Finance Business Process Flow Chart Ppt PowerPoint Presentation Background Images Cpb Pdf
Presenting this set of slides with name finance business process flow chart ppt powerpoint presentation background images cpb pdf. This is an editable Powerpoint three stages graphic that deals with topics like finance business process flow chart to help convey your message better graphically. This product is a premium product available for immediate download and is 100 percent editable in Powerpoint. Download this now and use it in your presentations to impress your audience.
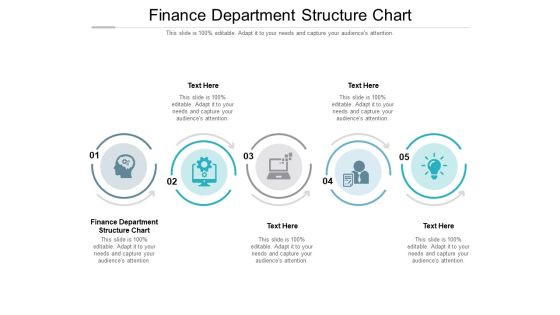
Finance Department Structure Chart Ppt PowerPoint Presentation Gallery Example Cpb Pdf
Presenting this set of slides with name finance department structure chart ppt powerpoint presentation gallery example cpb pdf. This is an editable Powerpoint five stages graphic that deals with topics like finance department structure chart to help convey your message better graphically. This product is a premium product available for immediate download and is 100 percent editable in Powerpoint. Download this now and use it in your presentations to impress your audience.
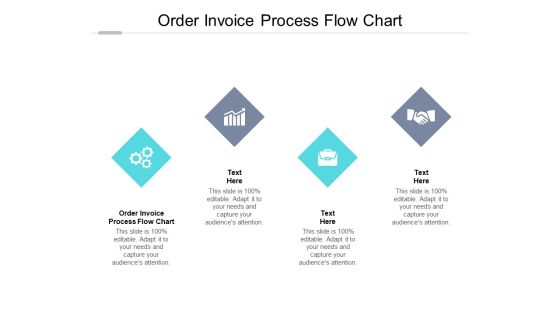
Order Invoice Process Flow Chart Ppt PowerPoint Presentation Outline Tips Cpb Pdf
Presenting this set of slides with name order invoice process flow chart ppt powerpoint presentation outline tips cpb pdf. This is an editable Powerpoint four stages graphic that deals with topics like order invoice process flow chart to help convey your message better graphically. This product is a premium product available for immediate download and is 100 percent editable in Powerpoint. Download this now and use it in your presentations to impress your audience.
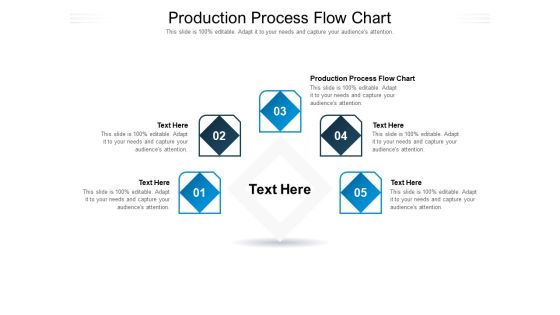
Production Process Flow Chart Ppt PowerPoint Presentation File Tips Cpb Pdf
Presenting this set of slides with name production process flow chart ppt powerpoint presentation file tips cpb pdf. This is an editable Powerpoint five stages graphic that deals with topics like production process flow chart to help convey your message better graphically. This product is a premium product available for immediate download and is 100 percent editable in Powerpoint. Download this now and use it in your presentations to impress your audience.

Information Security Organization Chart Ppt PowerPoint Presentation Layouts Design Templates Cpb Pdf
Presenting this set of slides with name information security organization chart ppt powerpoint presentation layouts design templates cpb pdf. This is an editable Powerpoint four stages graphic that deals with topics like information security organization chart to help convey your message better graphically. This product is a premium product available for immediate download and is 100 percent editable in Powerpoint. Download this now and use it in your presentations to impress your audience.

Retail Supply Chain Flow Chart Ppt PowerPoint Presentation Slides Pictures Cpb Pdf
Presenting this set of slides with name retail supply chain flow chart ppt powerpoint presentation slides pictures cpb pdf. This is an editable Powerpoint four stages graphic that deals with topics like retail supply chain flow chart to help convey your message better graphically. This product is a premium product available for immediate download and is 100 percent editable in Powerpoint. Download this now and use it in your presentations to impress your audience.
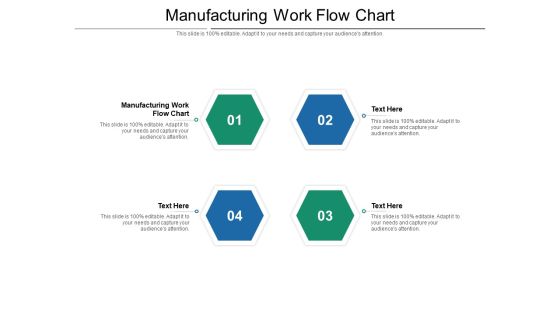
Manufacturing Work Flow Chart Ppt PowerPoint Presentation Infographic Template Example 2015 Cpb Pdf
Presenting this set of slides with name manufacturing work flow chart ppt powerpoint presentation infographic template example 2015 cpb pdf. This is an editable Powerpoint four stages graphic that deals with topics like manufacturing work flow chart to help convey your message better graphically. This product is a premium product available for immediate download and is 100 percent editable in Powerpoint. Download this now and use it in your presentations to impress your audience.

Client Onboarding Process Flow Chart Ppt PowerPoint Presentation Infographic Template Elements Cpb Pdf
Presenting this set of slides with name client onboarding process flow chart ppt powerpoint presentation infographic template elements cpb pdf. This is an editable Powerpoint three stages graphic that deals with topics like client onboarding process flow chart to help convey your message better graphically. This product is a premium product available for immediate download and is 100 percent editable in Powerpoint. Download this now and use it in your presentations to impress your audience.

Bank Operations Process Flow Chart Ppt PowerPoint Presentation Portfolio Maker Cpb Pdf
Presenting this set of slides with name bank operations process flow chart ppt powerpoint presentation portfolio maker cpb pdf. This is an editable Powerpoint five stages graphic that deals with topics like bank operations process flow chart to help convey your message better graphically. This product is a premium product available for immediate download and is 100 percent editable in Powerpoint. Download this now and use it in your presentations to impress your audience.
Types Project Management Charts Ppt PowerPoint Presentation Icon Professional Cpb Pdf
Presenting this set of slides with name types project management charts ppt powerpoint presentation icon professional cpb pdf. This is an editable Powerpoint seven stages graphic that deals with topics like types project management charts to help convey your message better graphically. This product is a premium product available for immediate download and is 100 percent editable in Powerpoint. Download this now and use it in your presentations to impress your audience.
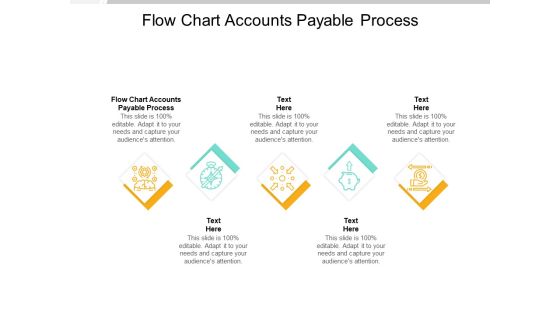
Flow Chart Accounts Payable Process Ppt PowerPoint Presentation File Example File Cpb Pdf
Presenting this set of slides with name flow chart accounts payable process ppt powerpoint presentation file example file cpb pdf. This is an editable Powerpoint five stages graphic that deals with topics like flow chart accounts payable process to help convey your message better graphically. This product is a premium product available for immediate download and is 100 percent editable in Powerpoint. Download this now and use it in your presentations to impress your audience.

Banking Client Onboarding Process Flow Chart Ppt PowerPoint Presentation Model Clipart Cpb Pdf
Presenting this set of slides with name banking client onboarding process flow chart ppt powerpoint presentation model clipart cpb pdf. This is an editable Powerpoint five stages graphic that deals with topics like banking client onboarding process flow chart to help convey your message better graphically. This product is a premium product available for immediate download and is 100 percent editable in Powerpoint. Download this now and use it in your presentations to impress your audience.
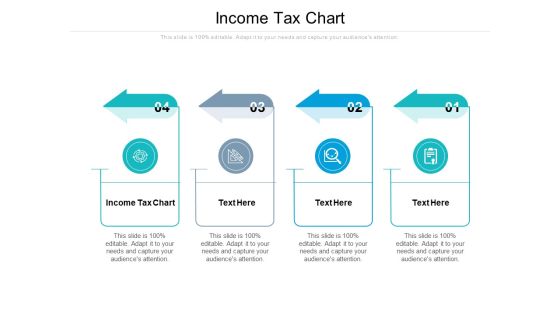
Income Tax Chart Ppt PowerPoint Presentation Slides Design Ideas Cpb Pdf
Presenting this set of slides with name income tax chart ppt powerpoint presentation slides design ideas cpb pdf. This is an editable Powerpoint four stages graphic that deals with topics like income tax chart to help convey your message better graphically. This product is a premium product available for immediate download and is 100 percent editable in Powerpoint. Download this now and use it in your presentations to impress your audience.


 Continue with Email
 Sign up for an account
 Home
Home


