Schedule

Business Charts PowerPoint Templates An Illustration Of Angry Emotion Sales
Business Charts PowerPoint templates an illustration of angry emotion Sales-This PowerPoint Diagram Illustrates all the Angry Emoticons which will help you to express exasperation, irritability, antagonism etc. .You can change color, size and orientation of any icon to your liking.
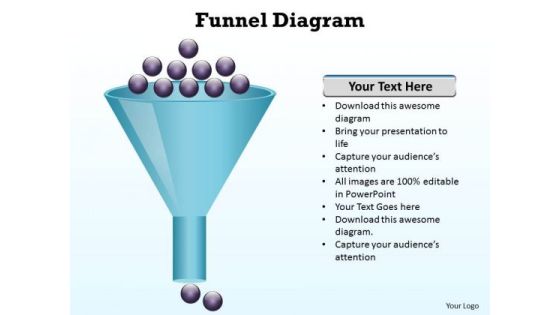
Business Charts PowerPoint Templates Funnel Diagram Editable Sales
Business Charts PowerPoint templates funnel diagram editable Sales-This Funnel based PowerPoint Diagram signifies adulteration, contamination, corruption, defilement, dirt, filth, foreign matter, grime, pestilence, poisoning, pollutant, pollution, scum, stain, taint, uncleanness.

Stock Photo 3d Chart With Six Stages PowerPoint Slide
Use this image slide to provide information about a process or task to the relevant audience. This image presents 3d chart with six stages. This diagram is designed to attract the attention of your audience.

Business Framework Organization Chart In PowerPoint PowerPoint Presentation
This image slide has been designed with business man icons to display organization chart. Use this image slide, in your presentations to depict business management designations. This image slide will enhance the quality of your presentations.
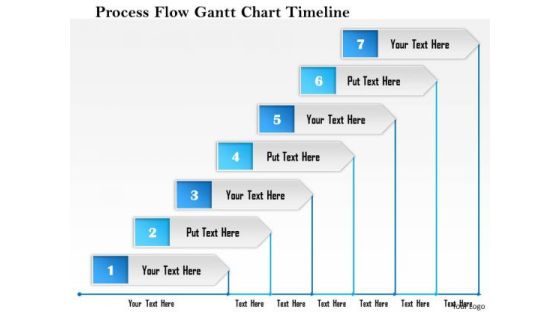
Business Framework Process Flow Gantt Chart Timeline PowerPoint Presentation
This Power point template slide has been designed with graphic of Gantt chart. This PPT slide contains the concept of process flow. Use this PPT slide for your business process related topics.
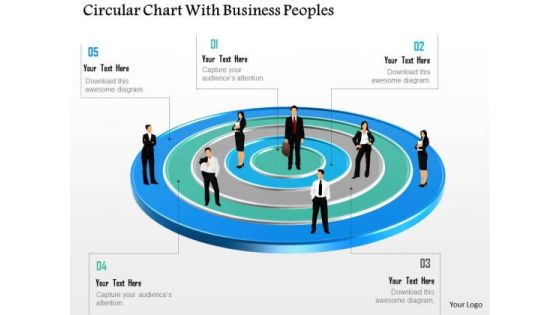
Business Diagram Circular Chart With Business Peoples Presentation Template
This business diagram has been designed with graphic of business people on circular chart. This diagram is designed to depict team meeting on financial matter. This diagram offers a way for your audience to visually conceptualize the process.
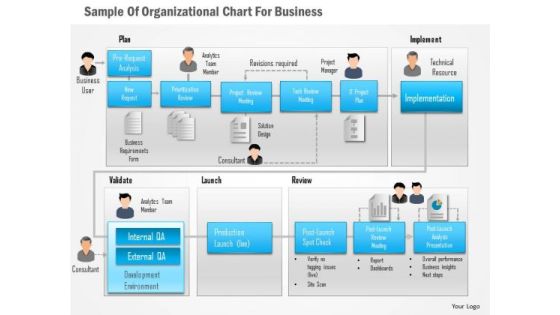
Business Diagram Sample Of Organizational Chart For Business Presentation Template
Graphic of organizational chart has been used to design this business diagram. This diagram slide reflects the hierarchy of an organization. Display your topic in a visual manner with this unique diagram.

Business Diagram Circle Chart For Percentage Ratio Presentation Template
Four staged circular chart has been used to craft this PPT diagram. This PPT contains the concept of result analysis. Use this PPT in your business and sales presentation and display any kind of result analysis in a graphical way.

Business Diagram Paper Clips Circular Chart Presentation Template
This power point template has been designed with graphic of circular chart made with paper clips. These business icons are used to display the concept of business result analysis and meeting. Use this diagram for business and marketing presentations.
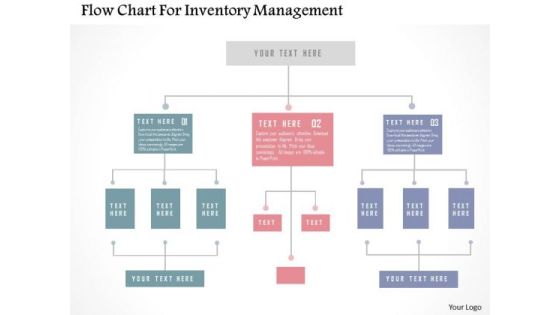
Business Diagram Flow Chart For Inventory Management PowerPoint Templates
Our above business slide contains graphics of flow chart. This flowchart may be used to display inventory management. This slide is an excellent backdrop for you to enlighten your audience on the process.
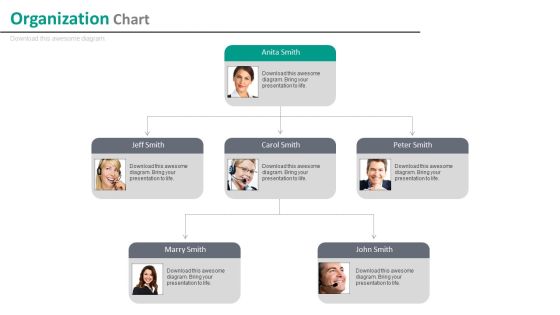
Company Employees Organizational Chart With Profiles Powerpoint Slides
Our compelling template consists with diagram of employee?s organizational chart with profiles. This slide has been professionally designed to display organizational structure and team hierarchy. This template offers an excellent background to build impressive presentation.
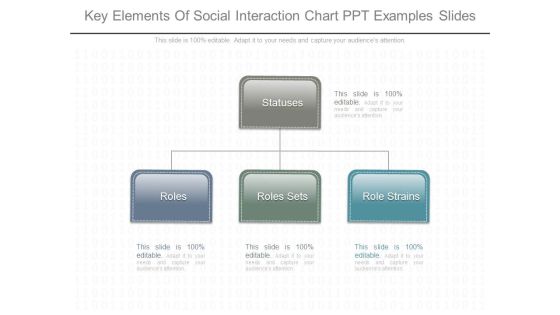
Key Elements Of Social Interaction Chart Ppt Examples Slides
This is a key elements of social interaction chart ppt examples slides. This is a three stage process. The stages in this process are statuses, roles, roles sets, role strains.
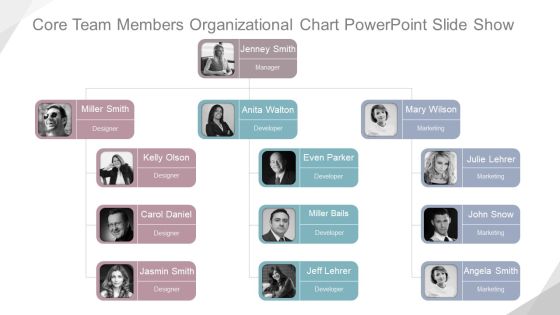
Core Team Members Organizational Chart Ppt PowerPoint Presentation Background Designs
This is a core team members organizational chart ppt powerpoint presentation background designs. This is a five stage process. The stages in this process are manager, designer, developer, marketing.
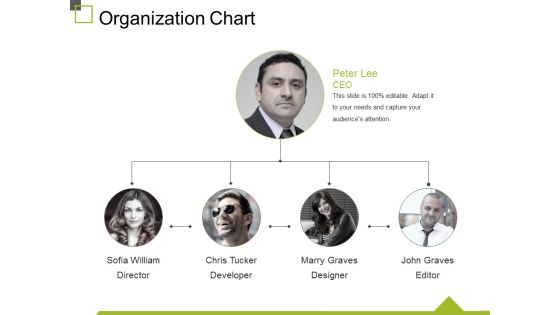
Organization Chart Ppt PowerPoint Presentation File Slide Download
This is a organization chart ppt powerpoint presentation file slide download. This is a four stage process. The stages in this process are sofia william, chris tucker, marry graves, john graves, business.

Risk Mitigation Chart Ppt PowerPoint Presentation Infographic Template Layouts
This is a risk mitigation chart ppt powerpoint presentation infographic template layouts. This is a three stage process. The stages in this process are scope creep, insufficient testing, insufficient resources, risks.

Risk Mitigation Chart Ppt PowerPoint Presentation Infographic Template Elements
This is a risk mitigation chart ppt powerpoint presentation infographic template elements. This is a three stage process. The stages in this process are scope creep, insufficient testing, insufficient resources, risks.
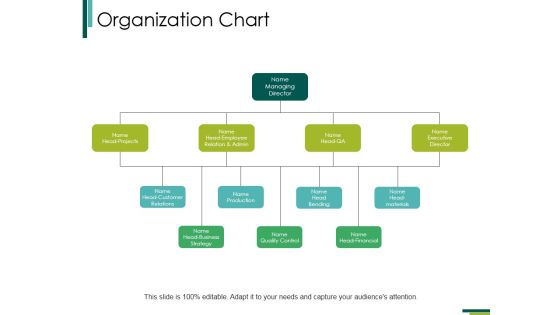
Organization Chart Ppt PowerPoint Presentation Infographic Template Files
This is a organization chart ppt powerpoint presentation infographic template files. This is a four stage process. The stages in this process are managing director, head projects, head business strategy, quality control.

Organization Chart Ppt PowerPoint Presentation Gallery Graphics Pictures
This is a organization chart ppt powerpoint presentation gallery graphics pictures. This is a four stage process. The stages in this process are head customer relations name, production name, head bending name, head employee relation and admin, name head projects.
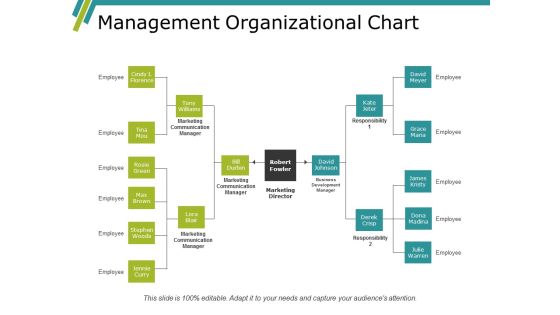
Management Organizational Chart Ppt PowerPoint Presentation Visual Aids Portfolio
This is a management organizational chart ppt powerpoint presentation visual aids portfolio. This is a three stage process. The stages in this process are rosie green, max brown, stephen woods, jennie curry, lora blair.
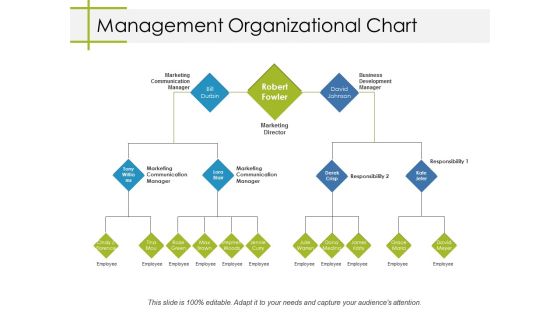
Management Organizational Chart Ppt PowerPoint Presentation Layouts Topics
This is a management organizational chart ppt powerpoint presentation layouts topics. This is a three stage process. The stages in this process are bill durbin, robert fowler, david johnson, tony williams, lora blair.
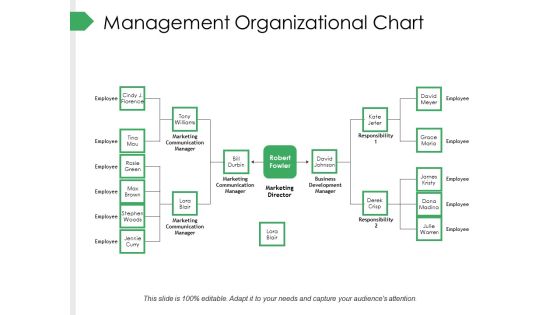
Management Organizational Chart Ppt PowerPoint Presentation Summary Gallery
This is a management organizational chart ppt powerpoint presentation summary gallery. This is a two stage process. The stages in this process are employee, marketing communication manager, marketing director, business development manager, responsibility, tony williams.

Project Organization Chart Ppt PowerPoint Presentation Summary Elements
This is a project organization chart ppt powerpoint presentation summary elements. This is a three stage process. The stages in this process are project governance, governance structure, project structure.
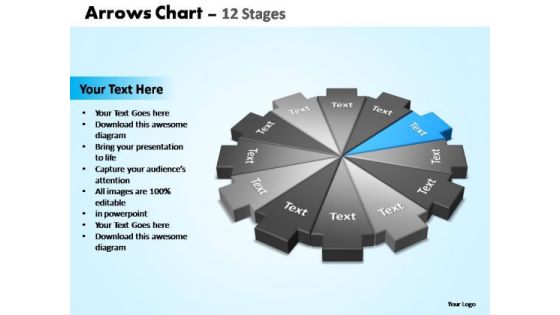
PowerPoint Template Leadership Arrows Chart Ppt Design Slides
PowerPoint_Template_Leadership_Arrows_Chart_PPT_Design_Slides-Explore the various directions and layers existing in your in your plans and processes. Unravel the desired and essential elements of your overall strategy. Explain the relevance of the different layers and stages and directions in getting down to your core competence, ability and desired result.-These amazing PowerPoint pre-designed slides and PowerPoint templates have been carefully created by our team of experts to help you impress your audience. Our stunning collection of Powerpoint slides are 100% editable and can easily fit in any PowerPoint presentations. By using these animations and graphics in PowerPoint and you can easily make professional presentations. Any text can be entered at any point in the PowerPoint template or slide. Just DOWNLOAD our awesome PowerPoint templates and you are ready to go.
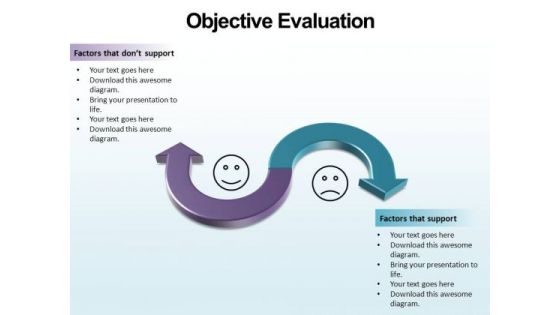
PowerPoint Presentation Chart Objective Evaluation Ppt Slide Designs
PowerPoint_Presentation_Chart_Objective_Evaluation_PPT_Slide_Designs Business PowerPoints-Explore the various directions and layers existing in your in your plans and processes. Unravel the desired and essential elements of your overall strategy. Explain the relevance of the different layers and stages and directions in getting down to your core competence, ability and desired result.-These amazing PowerPoint pre-designed slides and PowerPoint templates have been carefully created by our team of experts to help you impress your audience. Our stunning collection of Powerpoint slides are 100% editable and can easily fit in any PowerPoint presentations. By using these animations and graphics in PowerPoint and you can easily make professional presentations. Any text can be entered at any point in the PowerPoint template or slide. Just DOWNLOAD our awesome PowerPoint templates and you are ready to go.

Finance Chart Business PowerPoint Templates And PowerPoint Backgrounds 0611
Microsoft PowerPoint Template and Background with chart

3d Venn Diagram Stages Ppt Business Plan PowerPoint Templates
We present our 3d venn diagram stages ppt business plan PowerPoint templates.Use our Business PowerPoint Templates because Our PowerPoint Templates and Slides are effectively colour coded to prioritise your plans They automatically highlight the sequence of events you desire. Download our Triangles PowerPoint Templates because They will Put your wonderful verbal artistry on display. Our PowerPoint Templates and Slides will provide you the necessary glam and glitter. Download and present our Shapes PowerPoint Templates because Our PowerPoint Templates and Slides will Embellish your thoughts. They will help you illustrate the brilliance of your ideas. Use our Process and Flows PowerPoint Templates because Our PowerPoint Templates and Slides will let you Hit the right notes. Watch your audience start singing to your tune. Download and present our Leadership PowerPoint Templates because You are well armed with penetrative ideas. Our PowerPoint Templates and Slides will provide the gunpowder you need.Use these PowerPoint slides for presentations relating to pyramidal, pyramid, isolated, tower, model, conical, step, layout, blank, plan, hierarchy, symbol, template, diagram, layered, cone, scheme, graphic, data, process, element, drawing, level, shape, abstract, graph, illustration, icon, geometric, chart, design, growth, progress, information, background, image, structure, infographics, parts, prism, triangular. The prominent colors used in the PowerPoint template are Green, Gray, Black.
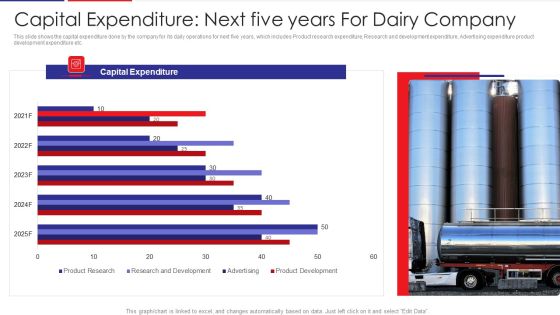
Examination Of Buyer Mindset Towards Dairy Products Capital Expenditure Next Five Years For Guidelines PDF
This slide shows the capital expenditure done by the company for its daily operations for next five years, which includes Product research expenditure, Research and development expenditure, Advertising expenditure product development expenditure etc. Deliver and pitch your topic in the best possible manner with this examination of buyer mindset towards dairy products capital expenditure next five years for guidelines pdf. Use them to share invaluable insights on product research, research and development, advertising, product development and impress your audience. This template can be altered and modified as per your expectations. So, grab it now.

Capital Expenditure Next Five Years For Dairy Company Download PDF
This slide shows the capital expenditure done by the company for its daily operations for next five years, which includes Product research expenditure, Research and development expenditure, Advertising expenditure product development expenditure etc. Deliver an awe inspiring pitch with this creative capital expenditure next five years for dairy company download pdf bundle. Topics like capital expenditure next five years for dairy company can be discussed with this completely editable template. It is available for immediate download depending on the needs and requirements of the user.

Factor Influencing User Experience Dairy Industry Capital Expenditure Next Five Years Designs PDF
This slide shows the capital expenditure done by the company for its daily operations for next five years, which includes Product research expenditure, Research and development expenditure, Advertising expenditure product development expenditure etc. Deliver an awe inspiring pitch with this creative factor influencing user experience dairy industry capital expenditure next five years designs pdf bundle. Topics like capital expenditure next five years for dairy company can be discussed with this completely editable template. It is available for immediate download depending on the needs and requirements of the user.

Dashboard For Real Time Telemarketing Process Management Themes PDF
The following slide highlights the dashboard for real time telesales process management illustrating real time data, employee data, performance, daily data, average handled call vs average answered call, employee ranking, AHT, AvgACW, ASA and hold percentage Showcasing this set of slides titled dashboard for real time telemarketing process management themes pdf The topics addressed in these templates are dashboard for real time telemarketing process management All the content presented in this PPT design is completely editable. Download it and make adjustments in color, background, font etc. as per your unique business setting.
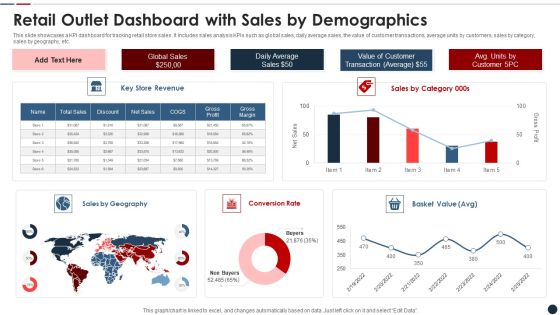
Retail Outlet Dashboard With Sales By Demographics Slides PDF
This slide showcases a KPI dashboard for tracking retail store sales. It includes sales analysis KPIs such as global sales, daily average sales, the value of customer transactions, average units by customers, sales by category, sales by geography, etc. Showcasing this set of slides titled retail outlet dashboard with sales by demographics slides pdf The topics addressed in these templates are Retail outlet dashboard with sales by demographics All the content presented in this PPT design is completely editable. Download it and make adjustments in color, background, font etc. as per your unique business setting.
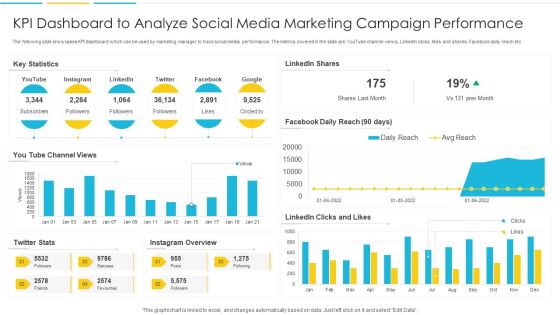
KPI Dashboard To Analyze Social Media Marketing Campaign Performance Rules PDF
The following slide showcases KPI dashboard which can be used by marketing manager to track social media performance. The metrics covered in the slide are YouTube channel views, LinkedIn clicks, likes and shares, Facebook daily reach etc. Pitch your topic with ease and precision using this KPI Dashboard To Analyze Social Media Marketing Campaign Performance Rules PDF. This layout presents information on Dashboard, Marketing, Analyze. It is also available for immediate download and adjustment. So, changes can be made in the color, design, graphics or any other component to create a unique layout.

Marketing KPI Dashboard With Lead To Conversion Structure PDF
The following slide showcases KPI dashboard which can be used to monitor the performance of marketing campaign. The key metrics mentioned in the slide are average daily impressions, cost per click, leads to conversion rate, cost per conversion etc. Showcasing this set of slides titled Marketing KPI Dashboard With Lead To Conversion Structure PDF. The topics addressed in these templates are Impressions, Optimization, Cost. All the content presented in this PPT design is completely editable. Download it and make adjustments in color, background, font etc. as per your unique business setting.
Patient Healthcare Online Transformation Dashboard Ppt PowerPoint Presentation Icon Example File PDF
This slide displays the dashboard depicting the results of patients after the digital transformation. It includes the daily activity of the patients on the app, appointments, water balance, etc. Pitch your topic with ease and precision using this Patient Healthcare Online Transformation Dashboard Ppt PowerPoint Presentation Icon Example File PDF. This layout presents information on General Health, Water Balance, Transformation Dashboard. It is also available for immediate download and adjustment. So, changes can be made in the color, design, graphics or any other component to create a unique layout.
Techniques To Implement Cloud Infrastructure Tracking Cloud Usage And Logs Download PDF
Mentioned slide provide key statistics for monitoring daily wise usage of cloud applications and query firring. Below statistics includes application usage per day, queries by project and queries rolling 15 days trend. Deliver an awe inspiring pitch with this creative Techniques To Implement Cloud Infrastructure Tracking Cloud Usage And Logs Download PDF bundle. Topics like Queries Rolling, Queries By Project, Application Usage can be discussed with this completely editable template. It is available for immediate download depending on the needs and requirements of the user.
Metaverse Technology IT Dashboard For Tracking Metaverse Environment Ppt Outline Elements PDF
This slide represents the dashboard for tracking the metaverse environment. It covers the details of daily revenue, the total number of users, the number of new users, and total sales. Deliver and pitch your topic in the best possible manner with this Metaverse Technology IT Dashboard For Tracking Metaverse Environment Ppt Outline Elements PDF. Use them to share invaluable insights on Digital Spot, Satisfaction Rate, All Metaverses, Transaction Details and impress your audience. This template can be altered and modified as per your expectations. So, grab it now.

Freelance Content Marketing Performance Metrics Dashboard Elements PDF
The following slide highlights the freelance content marketing performance metrics dashboard. It depicts content visitor and number of leads for last 24 hours, cost per click, number of content visitor, daily content visitor, lead generation source, top converting landing pages, top converting marketing channels and return on investment. Showcasing this set of slides titled Freelance Content Marketing Performance Metrics Dashboard Elements PDF. The topics addressed in these templates are Lead Generation Source, Return On Investment, Converting Marketing Channels. All the content presented in this PPT design is completely editable. Download it and make adjustments in color, background, font etc. as per your unique business setting.
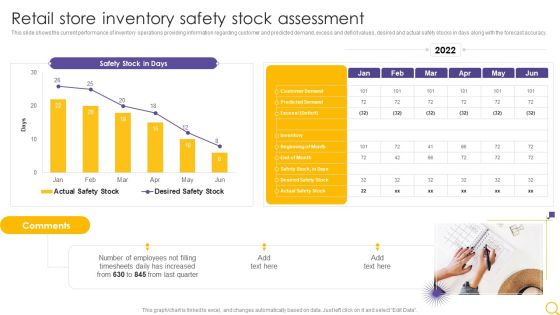
Retail Outlet Operational Efficiency Analytics Retail Store Inventory Safety Stock Assessment Template PDF
This slide shows the current performance of inventory operations providing information regarding customer and predicted demand, excess and deficit values, desired and actual safety stocks in days along with the forecast accuracy. Deliver an awe inspiring pitch with this creative Retail Outlet Operational Efficiency Analytics Retail Store Inventory Safety Stock Assessment Template PDF bundle. Topics like Safety Stock Days, Employees, Timesheets Daily can be discussed with this completely editable template. It is available for immediate download depending on the needs and requirements of the user.
Youtube Video Marketing Analytics Dashboard Ppt Icon Portrait PDF
This slide covers dashboard illustrating performance of ad campaigns on YouTube. It includes elements such as total gained subscribers, likes, dislikes, daily active users, views, campaign performance, traffic sources by views, etc. Pitch your topic with ease and precision using this Youtube Video Marketing Analytics Dashboard Ppt Icon Portrait PDF. This layout presents information on Average Vies, Per Week, Campaigns, Traffic Sources. It is also available for immediate download and adjustment. So, changes can be made in the color, design, graphics or any other component to create a unique layout.

Consumer Journey Mapping Techniques Dashboard For Tracking Social Media Platforms Introduction PDF
This slide covers the KPI dashboard for analyzing social media channels. It includes metrics such as social media followers, Facebook daily reach, Facebook engaged users and page impressions, etc. Pitch your topic with ease and precision using this Consumer Journey Mapping Techniques Dashboard For Tracking Social Media Platforms Introduction PDF. This layout presents information on Linkedin Key Metrics, Social Media Followers, Awareness. It is also available for immediate download and adjustment. So, changes can be made in the color, design, graphics or any other component to create a unique layout.

Call Center Communication Kpis Performance Dashboard With First Call Resolution Rate Graphics PDF
This slide showcases dashboard that can help organization to analyze the performance of call center agents communication KPIs and take necessary actions in case of high abandonment rate. Its key components are average response time, first call resolution and top performing call agents. Showcasing this set of slides titled Call Center Communication Kpis Performance Dashboard With First Call Resolution Rate Graphics PDF. The topics addressed in these templates are Overall Average, Response Time, First Call Resolution, Daily Abandonment Rate. All the content presented in this PPT design is completely editable. Download it and make adjustments in color, background, font etc. as per your unique business setting.
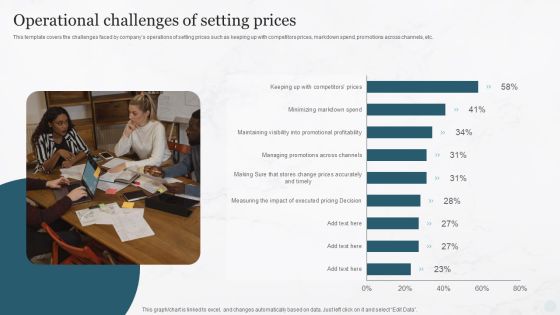
Operational Challenges Of Setting Prices Pricing Strategies For New Product In Market Guidelines PDF
Whether you have daily or monthly meetings, a brilliant presentation is necessary. Operational Challenges Of Setting Prices Pricing Strategies For New Product In Market Guidelines PDF can be your best option for delivering a presentation. Represent everything in detail using Operational Challenges Of Setting Prices Pricing Strategies For New Product In Market Guidelines PDF and make yourself stand out in meetings. The template is versatile and follows a structure that will cater to your requirements. All the templates prepared by Slidegeeks are easy to download and edit. Our research experts have taken care of the corporate themes as well. So, give it a try and see the results.
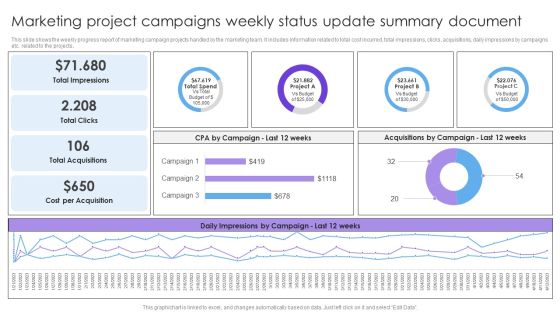
Marketing Project Campaigns Weekly Status Update Summary Document Formats PDF
This slide shows the weekly progress report of marketing campaign projects handled by the marketing team. It includes information related to total cost incurred, total impressions, clicks, acquisitions, daily impressions by campaigns etc. related to the projects. Pitch your topic with ease and precision using this Marketing Project Campaigns Weekly Status Update Summary Document Formats PDF. This layout presents information on Total Impressions, Total Clicks, Total Acquisitions. It is also available for immediate download and adjustment. So, changes can be made in the color, design, graphics or any other component to create a unique layout.
Non Fungible Token Methodology IT NFT Transaction Analysis And Tracking Dashboard Brochure PDF
This slide demonstrates the dashboard for tracking NFT transactions and analysis based on daily sales, ETH volume collections, and so on. Create an editable Non Fungible Token Methodology IT NFT Transaction Analysis And Tracking Dashboard Brochure PDF that communicates your idea and engages your audience. Whether youre presenting a business or an educational presentation, pre-designed presentation templates help save time. Non Fungible Token Methodology IT NFT Transaction Analysis And Tracking Dashboard Brochure PDF is highly customizable and very easy to edit, covering many different styles from creative to business presentations. Slidegeeks has creative team members who have crafted amazing templates. So, go and get them without any delay.
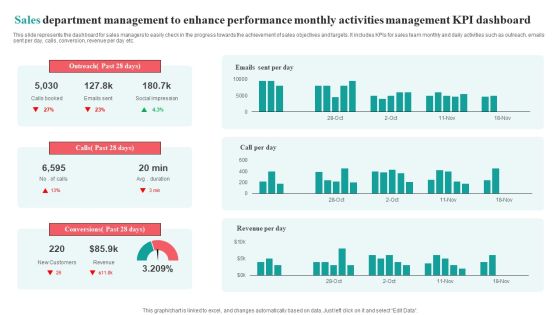
Sales Department Management To Enhance Performance Monthly Activities Management KPI Dashboard Brochure PDF
This slide represents the dashboard for sales managers to easily check in the progress towards the achievement of sales objectives and targets. It includes KPIs for sales team monthly and daily activities such as outreach, emails sent per day, calls, conversion, revenue per day etc.Pitch your topic with ease and precision using this Sales Department Management To Enhance Performance Monthly Activities Management KPI Dashboard Brochure PDF. This layout presents information on Social Impression, Conversions Past, Outreach Past. It is also available for immediate download and adjustment. So, changes can be made in the color, design, graphics or any other component to create a unique layout.
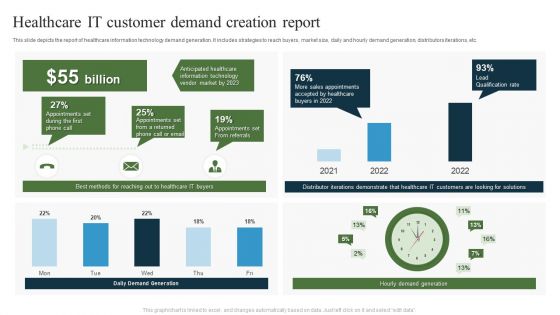
Healthcare IT Customer Demand Creation Report Ppt Gallery Graphics Download PDF
This slide depicts the report of healthcare information technology demand generation. It includes strategies to reach buyers, market size, daily and hourly demand generation, distributors iterations, etc. Showcasing this set of slides titled Healthcare IT Customer Demand Creation Report Ppt Gallery Graphics Download PDF. The topics addressed in these templates are Distributor Iterations Demonstrate, Healthcare IT Customers, Anticipated Healthcare. All the content presented in this PPT design is completely editable. Download it and make adjustments in color, background, font etc. as per your unique business setting.

KPI Dashboard For ESO System Ppt PowerPoint Presentation File Template PDF
This slide covers kpi dashboard for enterprise security operations. It involves details such as active alerts, active automated investigation, devices with major issues and report of daily devices. Pitch your topic with ease and precision using this KPI Dashboard For ESO System Ppt PowerPoint Presentation File Template PDF. This layout presents information on Security Health, Misconfigured, Service Operating Normally. It is also available for immediate download and adjustment. So, changes can be made in the color, design, graphics or any other component to create a unique layout.

Quarterly Analysis Dashboard Of Managing Promotional Activities Ideas PDF
The following slide presents the kpis of marketing operations to assess the performance. It includes quarterly values of elements such as budgeted vs actual total expenditure, impressions, cost per acquisition, clicks etc. Showcasing this set of slides titled Quarterly Analysis Dashboard Of Managing Promotional Activities Ideas PDF. The topics addressed in these templates are Campaign Wise, Daily Impression, Total Impression, Total Clicks. All the content presented in this PPT design is completely editable. Download it and make adjustments in color, background, font etc. as per your unique business setting.
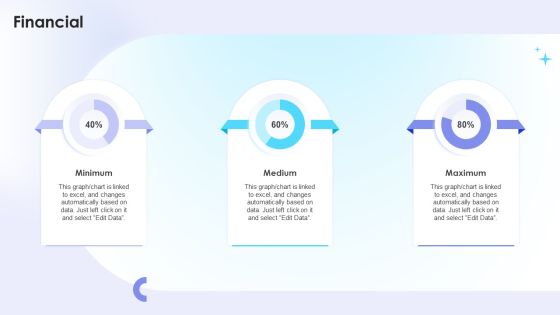
Dual Branding Campaign To Boost Sales Of Product Or Services Financial Structure PDF
Whether you have daily or monthly meetings, a brilliant presentation is necessary. Dual Branding Campaign To Boost Sales Of Product Or Services Financial Structure PDF can be your best option for delivering a presentation. Represent everything in detail using Dual Branding Campaign To Boost Sales Of Product Or Services Financial Structure PDF and make yourself stand out in meetings. The template is versatile and follows a structure that will cater to your requirements. All the templates prepared by Slidegeeks are easy to download and edit. Our research experts have taken care of the corporate themes as well. So, give it a try and see the results.
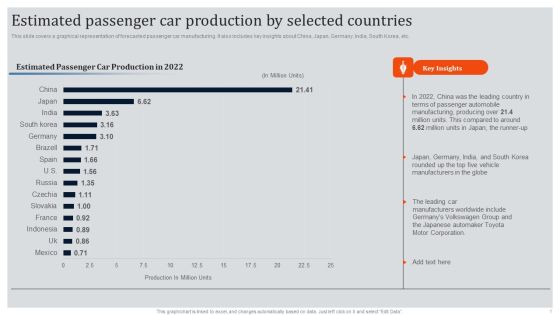
Global Automotive Industry Research And Analysis Estimated Passenger Car Production By Selected Countries Infographics PDF
Whether you have daily or monthly meetings, a brilliant presentation is necessary. Global Automotive Industry Research And Analysis Estimated Passenger Car Production By Selected Countries Infographics PDF can be your best option for delivering a presentation. Represent everything in detail using Global Automotive Industry Research And Analysis Estimated Passenger Car Production By Selected Countries Infographics PDF and make yourself stand out in meetings. The template is versatile and follows a structure that will cater to your requirements. All the templates prepared by Slidegeeks are easy to download and edit. Our research experts have taken care of the corporate themes as well. So, give it a try and see the results.
Robotic Process Automation Dashboard With Monthly Test Execution KPI Icons PDF
This slide covers RPA metrics for analyzing test execution on automated platforms. It also includes test execution metrics such as total test executed, test status, tests executed daily for different operation systems, etc. Pitch your topic with ease and precision using this Robotic Process Automation Dashboard With Monthly Test Execution KPI Icons PDF. This layout presents information on Robotic Process Automation Dashboard, Monthly Test Execution Kpi. It is also available for immediate download and adjustment. So, changes can be made in the color, design, graphics or any other component to create a unique layout.
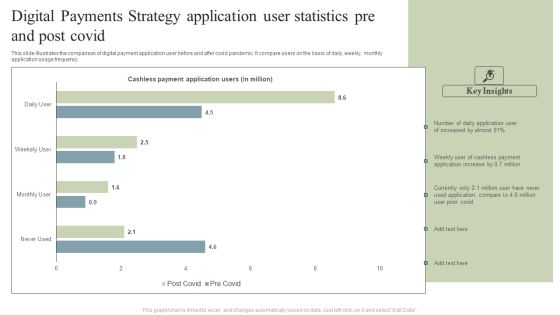
Digital Payments Strategy Application User Statistics Pre And Post Covid Pictures PDF
This slide illustrates the comparison of digital payment application user before and after covid pandemic. It compare users on the basis of daily, weekly, monthly application usage frequency. Pitch your topic with ease and precision using this Digital Payments Strategy Application User Statistics Pre And Post Covid Pictures PDF. This layout presents information on Cashless Payment, Application Users, Cashless Payment, Application Increase. It is also available for immediate download and adjustment. So, changes can be made in the color, design, graphics or any other component to create a unique layout.

Talent Administration And Succession HR Performance Management Dashboard Background PDF
Whether you have daily or monthly meetings, a brilliant presentation is necessary. Talent Administration And Succession HR Performance Management Dashboard Background PDF can be your best option for delivering a presentation. Represent everything in detail using Talent Administration And Succession HR Performance Management Dashboard Background PDF and make yourself stand out in meetings. The template is versatile and follows a structure that will cater to your requirements. All the templates prepared by Slidegeeks are easy to download and edit. Our research experts have taken care of the corporate themes as well. So, give it a try and see the results.
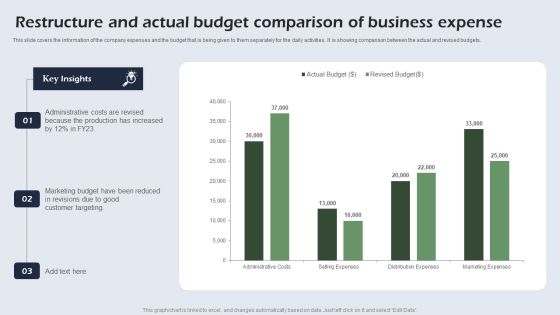
Restructure And Actual Budget Comparison Of Business Expense Portrait PDF
This slide covers the information of the company expenses and the budget that is being given to them separately for the daily activities. It is showing comparison between the actual and revised budgets. Showcasing this set of slides titled Restructure And Actual Budget Comparison Of Business Expense Portrait PDF. The topics addressed in these templates are Administrative Costs, Marketing Budget, Customer Targeting. All the content presented in this PPT design is completely editable. Download it and make adjustments in color, background, font etc. as per your unique business setting.

Cloud Computing Scalability Cost Management Dashboard In Cloud Management Platform Professional PDF
Whether You Have Daily Or Monthly Meetings, A Brilliant Presentation Is Necessary. Cloud Computing Scalability Cost Management Dashboard In Cloud Management Platform Professional Pdf Can Be Your Best Option For Delivering A Presentation. Represent Everything In Detail Using Cloud Computing Scalability Cost Management Dashboard In Cloud Management Platform Professional Pdf And Make Yourself Stand Out In Meetings. The Template Is Versatile And Follows A Structure That Will Cater To Your Requirements. All The Templates Prepared By Slidegeeks Are Easy To Download And Edit. Our Research Experts Have Taken Care Of The Corporate Themes As Well. So, Give It A Try And See The Results.

Clustered Column Online And Offline Brand Promotion Techniques Slides PDF
Whether you have daily or monthly meetings, a brilliant presentation is necessary. Clustered Column Online And Offline Brand Promotion Techniques Slides PDF can be your best option for delivering a presentation. Represent everything in detail using Clustered Column Online And Offline Brand Promotion Techniques Slides PDF and make yourself stand out in meetings. The template is versatile and follows a structure that will cater to your requirements. All the templates prepared by Slidegeeks are easy to download and edit. Our research experts have taken care of the corporate themes as well. So, give it a try and see the results.
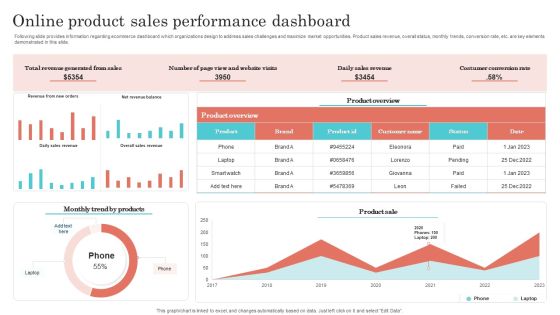
Online Product Sales Performance Dashboard Designs PDF
Following slide provides information regarding ecommerce dashboard which organizations design to address sales challenges and maximize market opportunities. Product sales revenue, overall status, monthly trends, conversion rate, etc. are key elements demonstrated in this slide. Showcasing this set of slides titled Online Product Sales Performance Dashboard Designs PDF. The topics addressed in these templates are Revenue Generated From Sales, Daily Sales Revenue, Costumer Conversion Rate. All the content presented in this PPT design is completely editable. Download it and make adjustments in color, background, font etc. as per your unique business setting.

Cloud Platform Dashboard For Tracking Project Team Activities Microsoft PDF
The following slide depicts project team task tracking cloud dashboard. It provides information about hours worked, projects worked, time spent, daily limit, product design, weekly activity, etc. Create an editable Cloud Platform Dashboard For Tracking Project Team Activities Microsoft PDF that communicates your idea and engages your audience. Whether you are presenting a business or an educational presentation, pre-designed presentation templates help save time. Cloud Platform Dashboard For Tracking Project Team Activities Microsoft PDF is highly customizable and very easy to edit, covering many different styles from creative to business presentations. Slidegeeks has creative team members who have crafted amazing templates. So, go and get them without any delay.

Storage Facility Logistics And Productivity Management Dashboard Summary PDF
This slide showcases a dashboard for monitoring and tracking warehouse operations productivity. It includes key components such as time period, revenue, costs, profit, shipments, average daily time, fleet status, profit by country, average delivery time, etc. Showcasing this set of slides titled Storage Facility Logistics And Productivity Management Dashboard Summary PDF. The topics addressed in these templates are Fleet Status, Delivery Status, Deliveries By Country. All the content presented in this PPT design is completely editable. Download it and make adjustments in color, background, font etc. as per your unique business setting.

Storage Facility Orders Productivity Management Dashboard Diagrams PDF
This slide showcases a dashboard for tracking and managing orders productivity performance at warehouse. It includes key components such as collection time, daily orders, number of workers per shift, top ordered products and least ordered products. Showcasing this set of slides titled Storage Facility Orders Productivity Management Dashboard Diagrams PDF. The topics addressed in these templates are Top Most Ordered Products, Least Ordered Products, Orders Per Day. All the content presented in this PPT design is completely editable. Download it and make adjustments in color, background, font etc. as per your unique business setting.


 Continue with Email

 Home
Home


