AI PPT Maker
Templates
PPT Bundles
Design Services
Business PPTs
Business Plan
Management
Strategy
Introduction PPT
Roadmap
Self Introduction
Timelines
Process
Marketing
Agenda
Technology
Medical
Startup Business Plan
Cyber Security
Dashboards
SWOT
Proposals
Education
Pitch Deck
Digital Marketing
KPIs
Project Management
Product Management
Artificial Intelligence
Target Market
Communication
Supply Chain
Google Slides
Research Services
 One Pagers
All Categories
-
Home
- Customer Favorites
- Schedule
Schedule

Combo Chart Ppt PowerPoint Presentation Files
This is a combo chart ppt powerpoint presentation files. This is a eight stage process. The stages in this process are business, marketing, growth, timeline, graph.

Stock Chart Ppt PowerPoint Presentation Infographics
This is a stock chart ppt powerpoint presentation infographics. This is a five stage process. The stages in this process are high, volume, low.

Radar Chart Ppt PowerPoint Presentation Template
This is a radar chart ppt powerpoint presentation template. This is a two stage process. The stages in this process are product, marketing, business, shape.

Stock Chart Ppt PowerPoint Presentation Slides
This is a stock chart ppt powerpoint presentation slides. This is a five stage process. The stages in this process are close, volume, high, low.

Line Chart Ppt PowerPoint Presentation Model
This is a line chart ppt powerpoint presentation model. This is a two stage process. The stages in this process are in percentage, product, business.
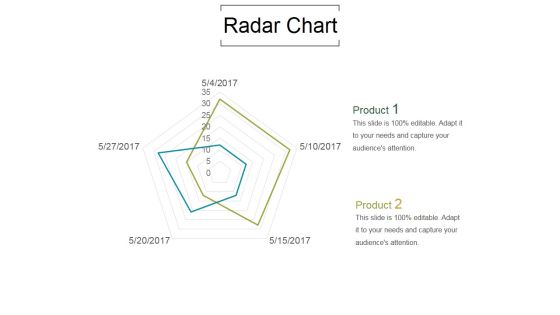
Radar Chart Ppt PowerPoint Presentation Samples
This is a radar chart ppt powerpoint presentation samples. This is a two stage process. The stages in this process are product, marketing, business.
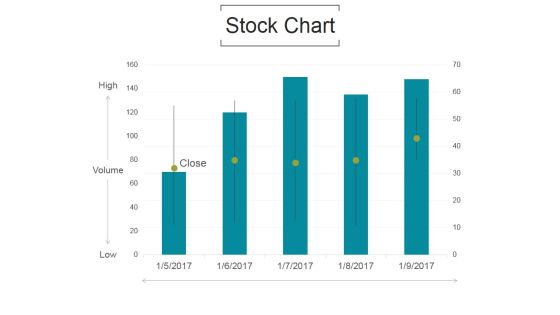
Stock Chart Ppt PowerPoint Presentation Example File
This is a stock chart ppt powerpoint presentation example file. This is a five stage process. The stages in this process are volume, high, low, close.

Area Chart Ppt PowerPoint Presentation Designs
This is a area chart ppt powerpoint presentation designs. This is a two stage process. The stages in this process are product, graph, in percentage, growth, business.
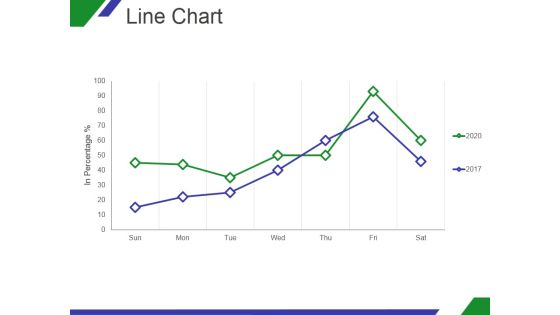
Line Chart Ppt PowerPoint Presentation Shapes
This is a line chart ppt powerpoint presentation shapes. This is a two stage process. The stages in this process are growth, in percentage, sun, mon, tue, wed.
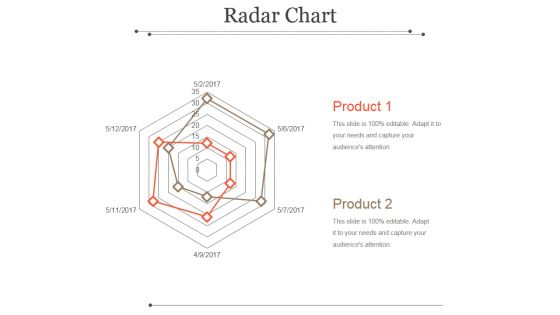
Radar Chart Ppt PowerPoint Presentation Show
This is a radar chart ppt powerpoint presentation show. This is a two stage process. The stages in this process are product, management, business, marketing.
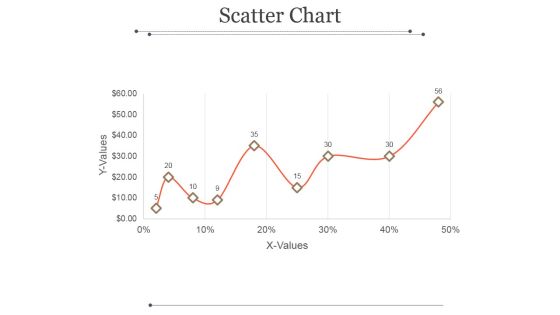
Scatter Chart Ppt PowerPoint Presentation Example
This is a scatter chart ppt powerpoint presentation example. This is a nine stage process. The stages in this process are x values, y values, business, growth, success.

Hierarchy Chart Ppt PowerPoint Presentation Show
This is a hierarchy chart ppt powerpoint presentation show. This is a three stage process. The stages in this process are business, marketing, management, step.

Pie Chart Ppt PowerPoint Presentation Example File
This is a pie chart ppt powerpoint presentation example file. This is a two stage process. The stages in this process are business, pie, management, strategy, process.

Line Chart Ppt PowerPoint Presentation Example
This is a line chart ppt powerpoint presentation example. This is a two stage process. The stages in this process are product, in percentage, business, marketing.
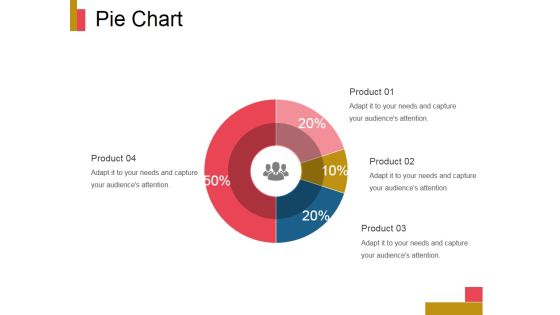
Pie Chart Ppt PowerPoint Presentation Design Ideas
This is a pie chart ppt powerpoint presentation design ideas. This is a four stage process. The stages in this process are product, finance, business, marketing, pie.
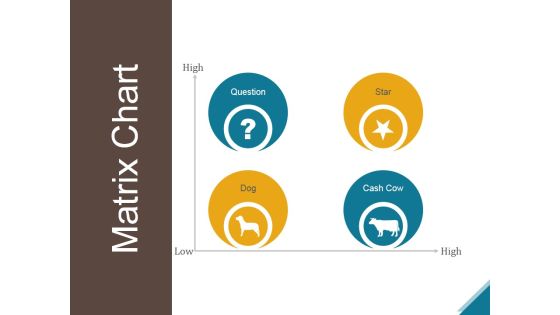
Matrix Chart Ppt PowerPoint Presentation Picture
This is a matrix chart ppt powerpoint presentation picture. This is a four stage process. The stages in this process are question, star, dog, cash cow.

Scatter Chart Ppt PowerPoint Presentation Slide Download
This is a scatter chart ppt powerpoint presentation slide download. This is a eight stage process. The stages in this process are dollars, sales in percentage, business, marketing.

Stock Chart Ppt PowerPoint Presentation Inspiration
This is a stock chart ppt powerpoint presentation inspiration. This is a five stage process. The stages in this process are high, volume, low, close.
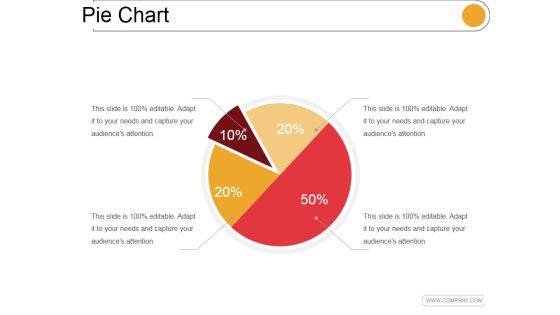
Pie Chart Ppt PowerPoint Presentation Background Image
This is a pie chart ppt powerpoint presentation background image. This is a four stage process. The stages in this process are management, business, marketing, pie.

Scatter Bubble Chart Ppt PowerPoint Presentation Slides
This is a scatter bubble chart ppt powerpoint presentation slides. This is a eight stage process. The stages in this process are in price, highest sale, business, management.

Area Chart Ppt PowerPoint Presentation Rules
This is a area chart ppt powerpoint presentation rules. This is a two stage process. The stages in this process are business, management, product, growth.
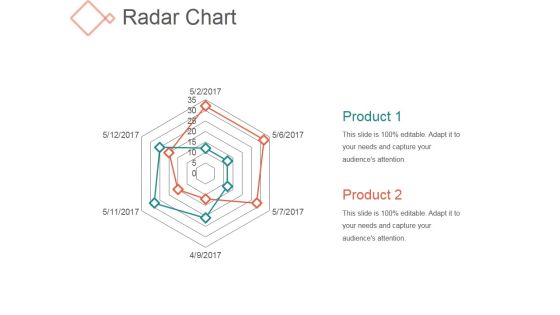
Radar Chart Ppt PowerPoint Presentation Influencers
This is a radar chart ppt powerpoint presentation influencers. This is a two stage process. The stages in this process are business, marketing, product, shapes.
Scatter Chart Ppt PowerPoint Presentation Icon
This is a scatter chart ppt powerpoint presentation icon. This is a two stage process. The stages in this process are product, growth, business, marketing.
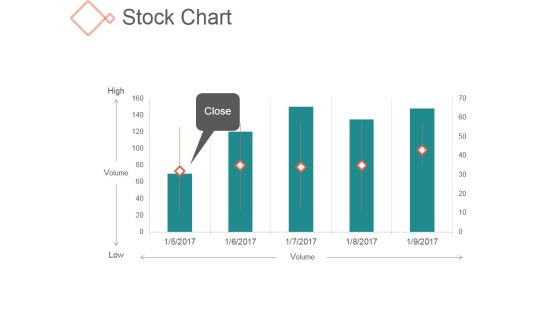
Stock Chart Ppt PowerPoint Presentation Professional
This is a stock chart ppt powerpoint presentation professional. This is a five stage process. The stages in this process are high, volume, low, close.

Area Chart Ppt PowerPoint Presentation Infographics
This is a area chart ppt powerpoint presentation infographics. This is a one stage process. The stages in this process are sales in percentage, jan, feb, mar, apr.

Line Chart Ppt PowerPoint Presentation Tips
This is a line chart ppt powerpoint presentation tips. This is a two stage process. The stages in this process are business, marketing, strategy, success, growth.
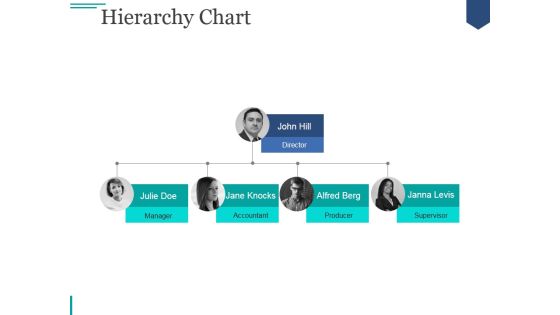
Hierarchy Chart Ppt PowerPoint Presentation Themes
This is a hierarchy chart ppt powerpoint presentation themes. This is a four stage process. The stages in this process are director, manager, accountant, producer, supervisor.
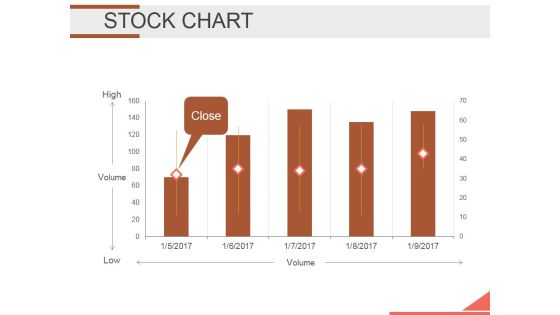
Stock Chart Ppt PowerPoint Presentation Topics
This is a stock chart ppt powerpoint presentation topics. This is a five stage process. The stages in this process are high, volume, low, volume.

Pie Chart Ppt PowerPoint Presentation Information
This is a pie chart ppt powerpoint presentation information. This is a four stage process. The stages in this process are pie, finance, business, growth, process.

Area Chart Ppt PowerPoint Presentation Summary Graphics
This is a area chart ppt powerpoint presentation summary graphics. This is a two stage process. The stages in this process are business, strategy, marketing, analysis, finance, growth.
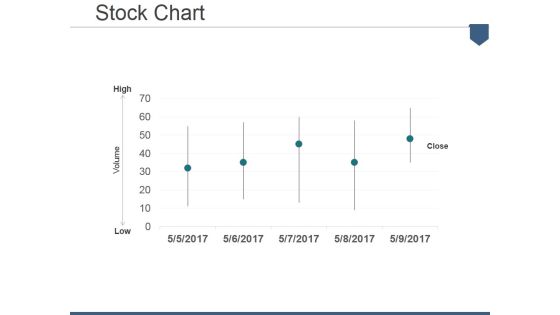
Stock Chart Ppt PowerPoint Presentation Show Layout
This is a stock chart ppt powerpoint presentation show layout. This is a five stage process. The stages in this process are low, volume, high, close.

Area Chart Ppt PowerPoint Presentation Summary Example
This is a area chart ppt powerpoint presentation summary example. This is a two stage process. The stages in this process are financial year, in percentage, product.

Radar Chart Ppt PowerPoint Presentation Show Sample
This is a radar chart ppt powerpoint presentation show sample. This is a five stage process. The stages in this process are product, business, marketing, shapes.

Area Chart Ppt PowerPoint Presentation Show Portfolio
This is a area chart ppt powerpoint presentation show portfolio. This is a two stage process. The stages in this process are business, product, finance, growth, management.
Hierarchy Chart Ppt PowerPoint Presentation Icon Skills
This is a hierarchy chart ppt powerpoint presentation icon skills. This is a four stage process. The stages in this process are director, manager, accountant, producer, supervisor.
Line Chart Ppt PowerPoint Presentation Icon Deck
This is a line chart ppt powerpoint presentation icon deck. This is a two stage process. The stages in this process are business, management, growth, product, finance.

Line Chart Ppt PowerPoint Presentation Infographics Ideas
This is a line chart ppt powerpoint presentation infographics ideas. This is a two stage process. The stages in this process are growth, graph, marketing.

Column Chart Ppt PowerPoint Presentation Inspiration Visuals
This is a column chart ppt powerpoint presentation inspiration visuals. This is a nine stage process. The stages in this process are business, marketing, product, expenditure.

Combo Chart Ppt PowerPoint Presentation Pictures Layouts
This is a combo chart ppt powerpoint presentation pictures layouts. This is a eight stage process. The stages in this process are product, growth rate, market size, years.

Pie Chart Ppt PowerPoint Presentation Professional Introduction
This is a pie chart ppt powerpoint presentation professional introduction. This is a five stage process. The stages in this process are product, finance, pie, process, business.

Radar Chart Ppt PowerPoint Presentation Model Tips
This is a radar chart ppt powerpoint presentation model tips. This is a five stage process. The stages in this process are product, business, marketing, shapes.
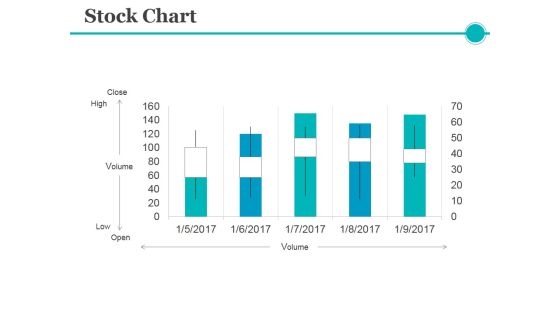
Stock Chart Ppt PowerPoint Presentation Ideas Example
This is a stock chart ppt powerpoint presentation ideas example. This is a five stage process. The stages in this process are volume, close, high, low, open.
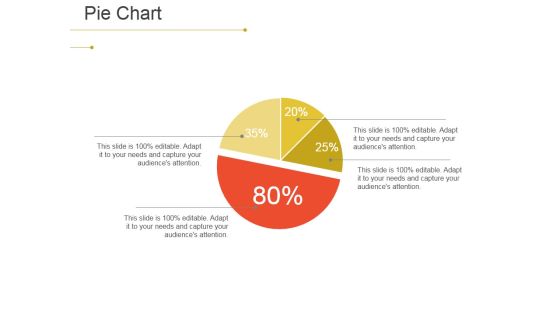
Pie Chart Ppt PowerPoint Presentation File Skills
This is a pie chart ppt powerpoint presentation file skills. This is a four stage process. The stages in this process are process, strategy, management, business, marketing.

Area Chart Ppt PowerPoint Presentation Gallery Inspiration
This is a area chart ppt powerpoint presentation gallery inspiration. This is a two stage process. The stages in this process are product, growth, success, graph, finance.

Combo Chart Ppt PowerPoint Presentation File Model
This is a combo chart ppt powerpoint presentation file model. This is a eight stage process. The stages in this process are product, year, market size, business, marketing.
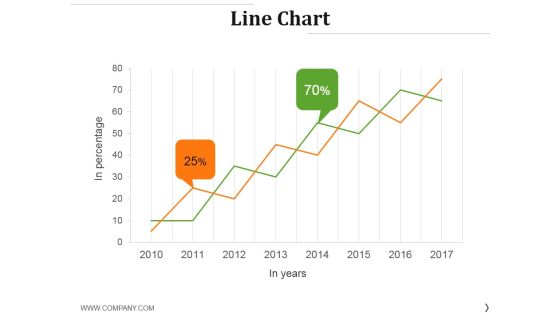
Line Chart Ppt PowerPoint Presentation Professional Template
This is a line chart ppt powerpoint presentation professional template. This is a two stage process. The stages in this process are business, finance, percentage, growth, success.

Pie Chart Ppt PowerPoint Presentation Layouts Shapes
This is a pie chart ppt powerpoint presentation layouts shapes. This is a four stage process. The stages in this process are pie, finance, percentage, business, marketing.

Area Chart Ppt PowerPoint Presentation Pictures Visuals
This is a area chart ppt powerpoint presentation pictures visuals. This is a two stage process. The stages in this process are product, business, finance, marketing.

Line Chart Ppt PowerPoint Presentation Ideas Deck
This is a line chart ppt powerpoint presentation ideas deck. This is a two stage process. The stages in this process are business, marketing, finance, growth.

Radar Chart Ppt PowerPoint Presentation Slides Graphics
This is a radar chart ppt powerpoint presentation slides graphics. This is a two stage process. The stages in this process are product, shapes, management, business, marketing.
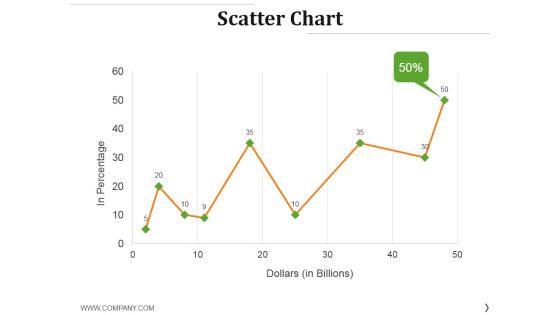
Scatter Chart Ppt PowerPoint Presentation Layouts Gridlines
This is a scatter chart ppt powerpoint presentation layouts gridlines. This is a nine stage process. The stages in this process are in percentage, dollars, growth, success, finance.

Stock Chart Ppt PowerPoint Presentation Ideas Brochure
This is a stock chart ppt powerpoint presentation ideas brochure. This is a five stage process. The stages in this process are high, volume, low, close.

Area Chart Ppt PowerPoint Presentation Professional Deck
This is a area chart ppt powerpoint presentation professional deck. This is a two stage process. The stages in this process are business, marketing, growth, finance, management.

Bar Chart Ppt PowerPoint Presentation File Skills
This is a bar chart ppt powerpoint presentation file skills. This is a nine stage process. The stages in this process are business, marketing, growth, finance, management.

Column Chart Ppt PowerPoint Presentation Portfolio Designs
This is a column chart ppt powerpoint presentation portfolio designs. This is a two stage process. The stages in this process are business, marketing, timeline, growth, compare.
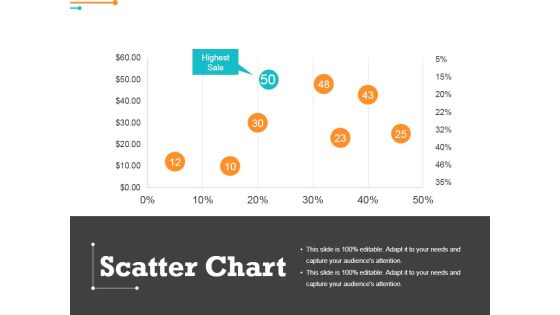
Scatter Chart Ppt PowerPoint Presentation Outline Graphics
This is a scatter chart ppt powerpoint presentation outline graphics. This is a eight stage process. The stages in this process are highest sale, percentage, finance, business.

Area Chart Ppt PowerPoint Presentation Summary Deck
This is a area chart ppt powerpoint presentation summary deck. This is a two stage process. The stages in this process are sales in percentage, financial year.
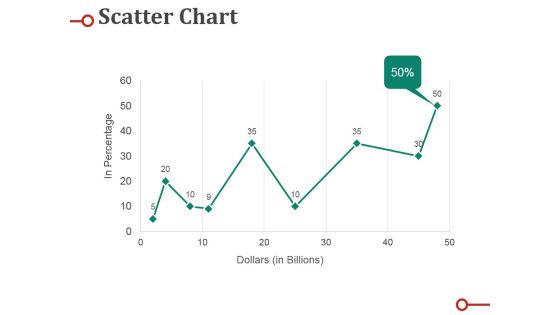
Scatter Chart Ppt PowerPoint Presentation Professional Deck
This is a scatter chart ppt powerpoint presentation professional deck. This is a nine stage process. The stages in this process are percentage, business, marketing, graph, line.
Donut Chart Ppt Powerpoint Presentation Layouts Icons
This is a donut chart ppt powerpoint presentation layouts icons. This is a six stage process. The stages in this process are finance, marketing, management, donut circle.

Area Chart Ppt PowerPoint Presentation Professional Display
This is a area chart ppt powerpoint presentation professional display. This is a two stage process. The stages in this process are business, finance, growth, strategy, marketing, analysis.

Line Chart Ppt PowerPoint Presentation Model Visuals
This is a line chart ppt powerpoint presentation model visuals. This is a two stage process. The stages in this process are business, strategy, analysis, pretention, growth strategy.
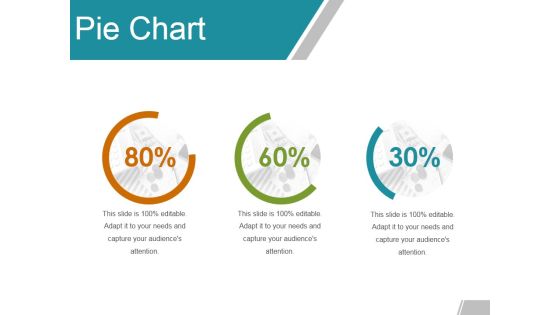
Pie Chart Ppt PowerPoint Presentation Summary Slide
This is a pie chart ppt powerpoint presentation summary slide. This is a three stage process. The stages in this process are percentage, finance, marketing, business.
Scatter Chart Ppt PowerPoint Presentation Icon Visuals
This is a scatter chart ppt powerpoint presentation icon visuals. This is a nine stage process. The stages in this process are business, growth, finance, success, marketing.

Stock Chart Ppt PowerPoint Presentation Portfolio Infographics
This is a stock chart ppt powerpoint presentation portfolio infographics. This is a five stage process. The stages in this process are high, volume, low, finance, business.

Line Chart Ppt Powerpoint Presentation Portfolio Clipart
This is a line chart ppt powerpoint presentation portfolio clipart. This is a two stage process. The stages in this process are jan, feb, mar, apr, may, jun.

Area Chart Ppt PowerPoint Presentation Slides Inspiration
This is a area chart ppt powerpoint presentation slides inspiration. This is a two stage process. The stages in this process are business, marketing, finance, growth, management.
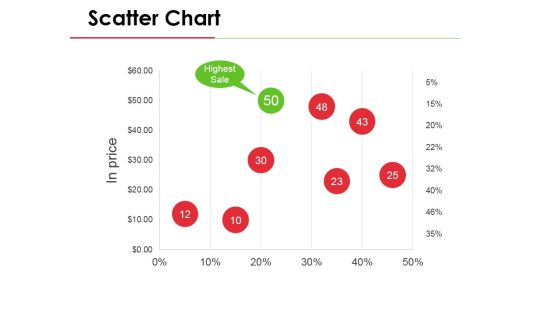
Scatter Chart Ppt PowerPoint Presentation Model Deck
This is a scatter chart ppt powerpoint presentation model deck. This is a eight stage process. The stages in this process are business, marketing, finance, management, strategy.

Line Chart Ppt PowerPoint Presentation Gallery Summary
This is a line chart ppt powerpoint presentation gallery summary. This is a two stage process. The stages in this process are finance, graph, business, management, marketing.
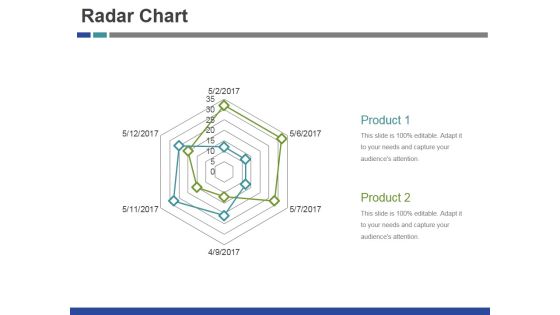
Radar Chart Ppt PowerPoint Presentation Outline Vector
This is a radar chart ppt powerpoint presentation outline vector. This is a six stage process. The stages in this process are product, business, marketing, shapes.

Scatter Chart Ppt PowerPoint Presentation Inspiration Brochure
This is a scatter chart ppt powerpoint presentation inspiration brochure. This is a two stage process. The stages in this process are product, growth, success, business.

Area Chart Ppt PowerPoint Presentation Slides Gridlines
This is a area chart ppt powerpoint presentation slides gridlines. This is a two stage process. The stages in this process are business, finance, marketing, percentage.

Column Chart Ppt PowerPoint Presentation Styles Vector
This is a column chart ppt powerpoint presentation styles vector. This is a six stage process. The stages in this process are growth, success, business, marketing, product.

Combo Chart Ppt PowerPoint Presentation Diagram Images
This is a combo chart ppt powerpoint presentation diagram images. This is a eight stage process. The stages in this process are growth, success, business, marketing, product.

Line Chart Ppt PowerPoint Presentation Pictures Maker
This is a line chart ppt powerpoint presentation pictures maker. This is a two stage process. The stages in this process are financial years, product, growth, success.

Bar Chart Ppt PowerPoint Presentation Slides Shapes
This is a bar chart ppt powerpoint presentation slides shapes. This is a seven stage process. The stages in this process are bar graph, finance, marketing, strategy, analysis.

Area Chart Ppt PowerPoint Presentation Icon Brochure
This is a area chart ppt powerpoint presentation icon brochure. This is a two stage process. The stages in this process are product, sales in percentage, growth, success.
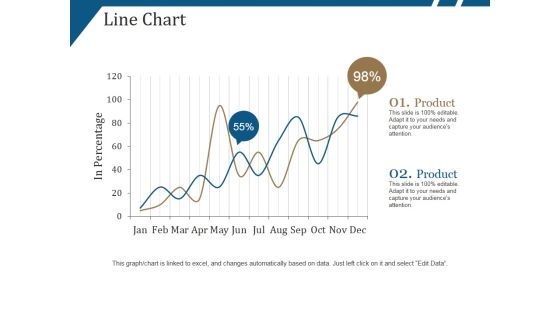
Line Chart Ppt PowerPoint Presentation Portfolio Show
This is a line chart ppt powerpoint presentation portfolio show. This is a two stage process. The stages in this process are product, in percentage, growth, success.
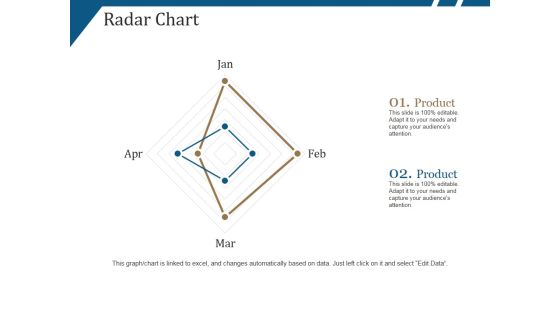
Radar Chart Ppt PowerPoint Presentation Layouts Summary
This is a radar chart ppt powerpoint presentation layouts summary. This is a four stage process. The stages in this process are product, business, marketing, shapes.

Scatter Chart Ppt PowerPoint Presentation Summary Deck
This is a scatter chart ppt powerpoint presentation summary deck. This is a nine stage process. The stages in this process are product, sales in percentage, growth, success.
Stock Chart Ppt PowerPoint Presentation Icon Microsoft
This is a stock chart ppt powerpoint presentation icon microsoft. This is a five stage process. The stages in this process are product, high, volume, low.

Area Chart Ppt PowerPoint Presentation Slides Show
This is a area chart ppt powerpoint presentation slides show. This is a two stage process. The stages in this process are business, marketing, success, graph, growth.

Line Chart Ppt PowerPoint Presentation Ideas Demonstration
This is a line chart ppt powerpoint presentation ideas demonstration. This is a eight stage process. The stages in this process are business, marketing, graph, success, growth.
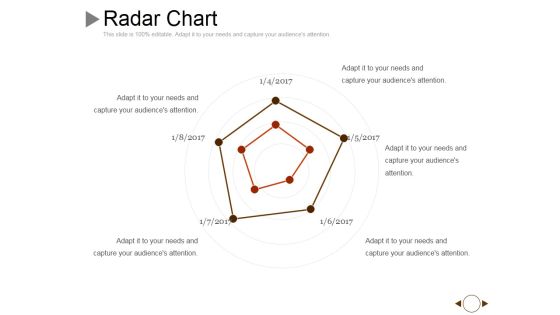
Radar Chart Ppt PowerPoint Presentation Professional Example
This is a radar chart ppt powerpoint presentation professional example. This is a five stage process. The stages in this process are business, shapes, marketing, management.

Radar Chart Ppt PowerPoint Presentation Model Picture
This is a radar chart ppt powerpoint presentation model picture. This is a six stage process. The stages in this process are product, finance marketing, business, management, analysis.
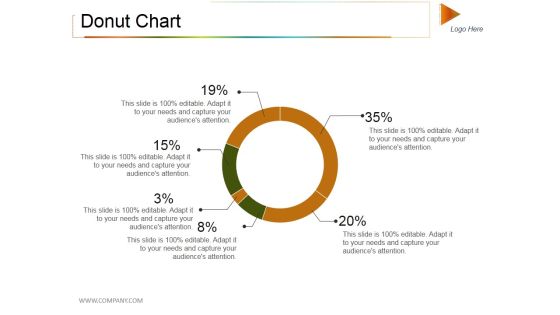
Donut Chart Ppt PowerPoint Presentation Model Rules
This is a donut chart ppt powerpoint presentation model rules. This is a six stage process. The stages in this process are donut, percentage, finance, business, marketing.

Organization Chart Ppt PowerPoint Presentation Model
This is a organization chart ppt powerpoint presentation model. This is a four stage process. The stages in this process are business, marketing, step, management.
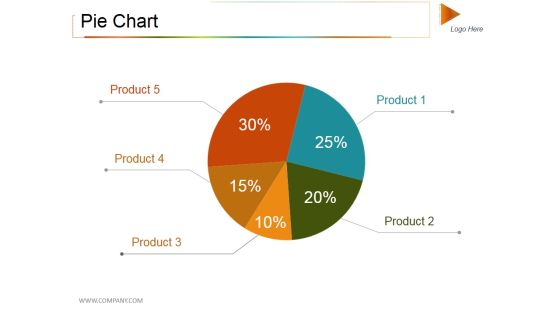
Pie Chart Ppt PowerPoint Presentation Styles Objects
This is a pie chart ppt powerpoint presentation styles objects. This is a five stage process. The stages in this process are pie, process, percentage, finance, business.

Column Chart Ppt PowerPoint Presentation Portfolio Background
This is a column chart ppt powerpoint presentation portfolio background. This is a nine stage process. The stages in this process are product, expenditure, growth, success, business.

Combo Chart Ppt PowerPoint Presentation Ideas Brochure
This is a combo chart ppt powerpoint presentation ideas brochure. This is a four stage process. The stages in this process are product, profit, growth, success, business.

Radar Chart Ppt PowerPoint Presentation Show Demonstration
This is a radar chart ppt powerpoint presentation show demonstration. This is a two stage process. The stages in this process are product, shape, business, marketing.

Area Chart Ppt PowerPoint Presentation Gallery Brochure
This is a area chart ppt powerpoint presentation gallery brochure. This is a two stage process. The stages in this process are product, growth in percentage, success, business.

Combo Chart Ppt PowerPoint Presentation Icon Rules
This is a combo chart ppt powerpoint presentation icon rules. This is a ten stage process. The stages in this process are cumulative, value, sales, graph, business.
Line Chart Ppt PowerPoint Presentation Styles Icons
This is a line chart ppt powerpoint presentation styles icons. This is a three stage process. The stages in this process are profit, dollar, product, business, marketing.

Radar Chart Ppt PowerPoint Presentation Summary Skills
This is a radar chart ppt powerpoint presentation summary skills. This is a two stage process. The stages in this process are product, shape, business, marketing.

Doughnut Chart Ppt PowerPoint Presentation Styles Backgrounds
This is a doughnut chart ppt powerpoint presentation styles backgrounds. This is a three stage process. The stages in this process are percentage, finance, business, marketing, strategy.
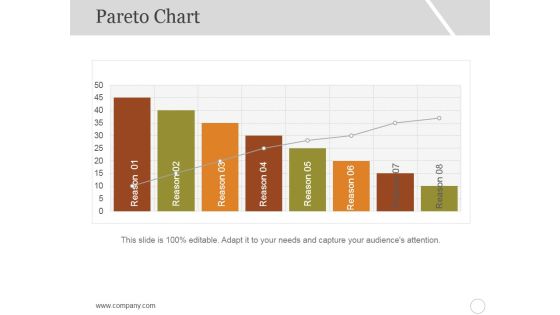
Pareto Chart Ppt PowerPoint Presentation Show Vector
This is a pareto chart ppt powerpoint presentation show vector. This is a eight stage process. The stages in this process are reason, business, marketing, graph, decline.

Column Chart Ppt PowerPoint Presentation Professional Example
This is a column chart ppt powerpoint presentation professional example. This is a eight stage process. The stages in this process are bar graph, growth, success, business, marketing.

Area Chart Ppt PowerPoint Presentation Ideas Guide
This is a area chart ppt powerpoint presentation ideas guide. This is a two stage process. The stages in this process are growth, finance, success, business, marketing.
Pie Chart Ppt PowerPoint Presentation Layouts Icons
This is a pie chart ppt powerpoint presentation layouts icons. This is a three stage process. The stages in this process are business, finance, analysis, marketing, strategy.

Stock Chart Ppt PowerPoint Presentation Gallery Files
This is a stock chart ppt powerpoint presentation gallery files. This is a five stage process. The stages in this process are high, volume, low, close.
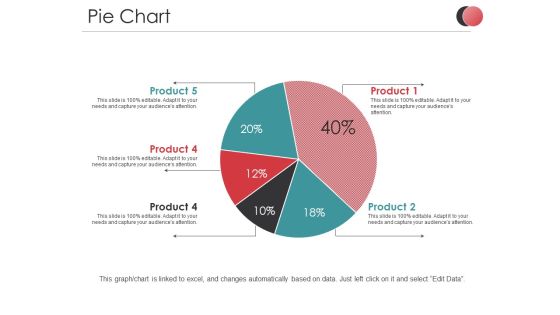
Pie Chart Ppt PowerPoint Presentation Slides Files
This is a pie chart ppt powerpoint presentation slides files. This is a five stage process. The stages in this process are product, percentage, business, marketing, process.

Column Chart Ppt PowerPoint Presentation Show Visuals
This is a column chart ppt powerpoint presentation show visuals. This is a two stage process. The stages in this process are product, year, success, step, business.
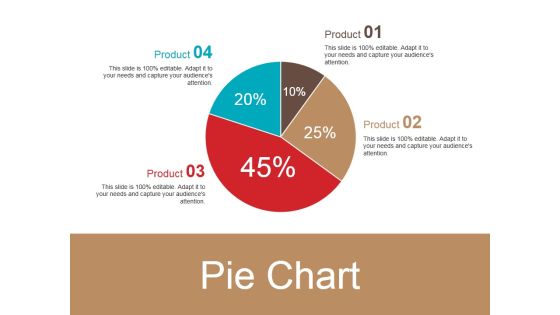
Pie Chart Ppt PowerPoint Presentation Ideas Slideshow
This is a pie chart ppt powerpoint presentation ideas slideshow. This is a four stage process. The stages in this process are pie, process, percentage, finance, business.

Radar Chart Ppt PowerPoint Presentation Layouts Elements
This is a radar chart ppt powerpoint presentation layouts elements. This is a three stage process. The stages in this process are product, shapes, business, marketing.
Scatter Chart Ppt PowerPoint Presentation Icon Mockup
This is a scatter chart ppt powerpoint presentation icon mockup. This is a nine stage process. The stages in this process are product, in percentage, dollars, percentage, finance.

Combo Chart Ppt PowerPoint Presentation Slides Diagrams
This is a combo chart ppt powerpoint presentation slides diagrams. This is a four stage process. The stages in this process are units sold, business, product, marketing, graph.

Line Chart Ppt PowerPoint Presentation Portfolio Shapes
This is a line chart ppt powerpoint presentation portfolio shapes. This is a two stage process. The stages in this process are profit, product, business, marketing, graph.
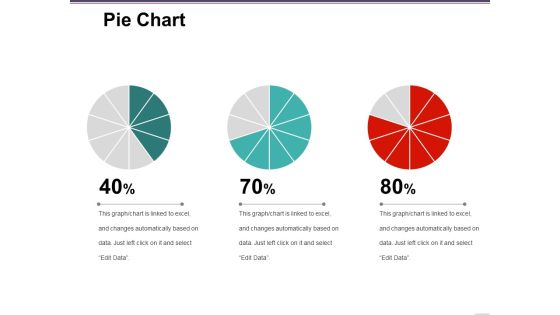
Pie Chart Ppt PowerPoint Presentation Layouts Good
This is a pie chart ppt powerpoint presentation layouts good. This is a three stage process. The stages in this process are finance, marketing, management, process, business.
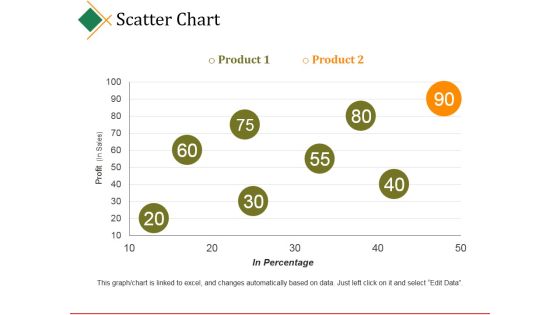
Scatter Chart Ppt PowerPoint Presentation Model
This is a scatter chart ppt powerpoint presentation model. This is a two stage process. The stages in this process are business, product, profit, in percentage, business.
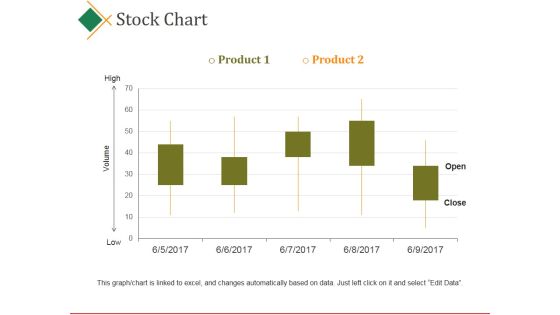
Stock Chart Ppt PowerPoint Presentation Show Information
This is a stock chart ppt powerpoint presentation show information. This is a five stage process. The stages in this process are high, volume, low, open, close .
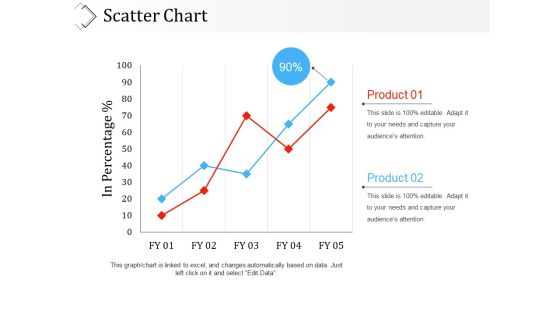
Scatter Chart Ppt PowerPoint Presentation Outline Picture
This is a scatter chart ppt powerpoint presentation outline picture. This is a two stage process. The stages in this process are in percentage, business, marketing, product, graph.

Column Chart Ppt PowerPoint Presentation Ideas Inspiration
This is a column chart ppt powerpoint presentation ideas inspiration. This is a five stage process. The stages in this process are graph, year, business, marketing, product.

Line Chart Ppt PowerPoint Presentation Pictures Ideas
This is a line chart ppt powerpoint presentation pictures ideas. This is a two stage process. The stages in this process are in millions, percentage, finance, product, growth.
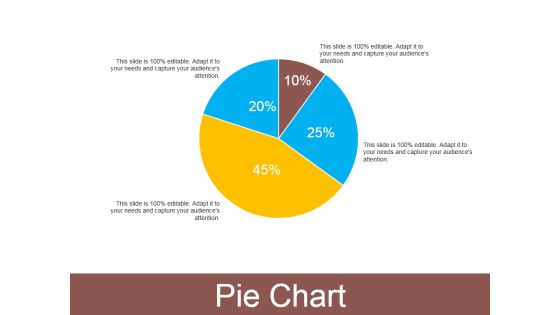
Pie Chart Ppt PowerPoint Presentation Outline Smartart
This is a pie chart ppt powerpoint presentation outline smartart. This is a four stage process. The stages in this process are pie, process, percentage, finance, business.

Scatter Chart Ppt PowerPoint Presentation Gallery Vector
This is a scatter chart ppt powerpoint presentation gallery vector. This is a nine stage process. The stages in this process are in percentage, dollars, product, percentage, finance.
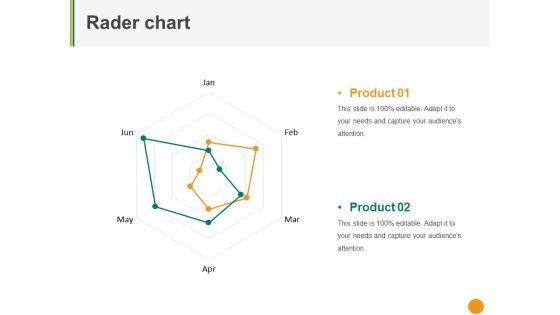
Rader Chart Ppt PowerPoint Presentation Professional Pictures
This is a rader chart ppt powerpoint presentation professional pictures. This is a two stage process. The stages in this process are product, finance, business, marketing.

Pie Chart Ppt PowerPoint Presentation Infographics Templates
This is a pie chart ppt powerpoint presentation infographics templates. This is a five stage process. The stages in this process are business, percentage, management, process.

Bar Chart Ppt PowerPoint Presentation Summary Pictures
This is a bar chart ppt powerpoint presentation summary pictures. This is a four stage process. The stages in this process are product, unit count, finance, percentage, business.

Column Chart Ppt PowerPoint Presentation Infographics Model
This is a column chart ppt powerpoint presentation infographics model. This is a two stage process. The stages in this process are bar graph, growth, product, percentage, year.

Stock Chart Ppt PowerPoint Presentation Professional Objects
This is a stock chart ppt powerpoint presentation professional objects. This is a five stage process. The stages in this process are product, high, volume, low, open, close.
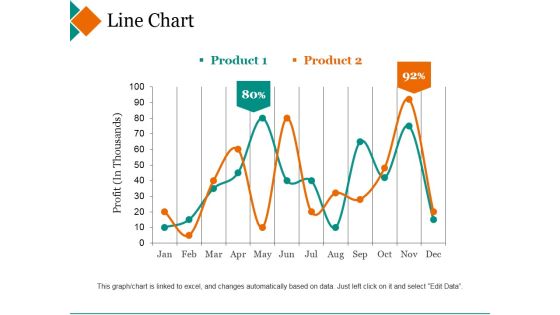
Line Chart Ppt PowerPoint Presentation Inspiration Deck
This is a line chart ppt powerpoint presentation inspiration deck. This is a two stage process. The stages in this process are product, profit, percentage, finance, line graph.
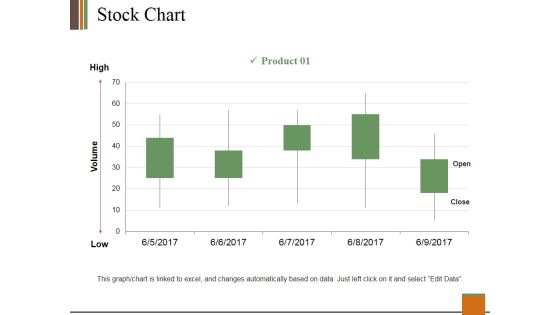
Stock Chart Ppt PowerPoint Presentation Slides Clipart
This is a stock chart ppt powerpoint presentation slides clipart. This is a one stage process. The stages in this process are product, high, volume, low, open, close.
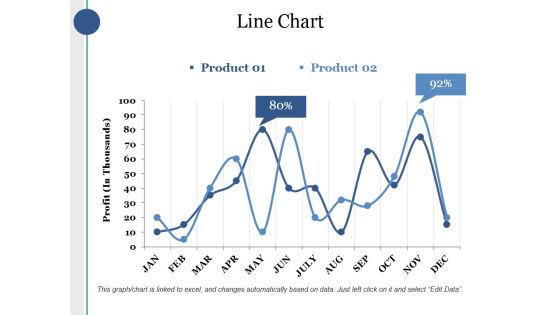
Line Chart Ppt PowerPoint Presentation Layouts Sample
This is a line chart ppt powerpoint presentation layouts sample. This is a two stage process. The stages in this process are product, profit, percentage, finance, business.
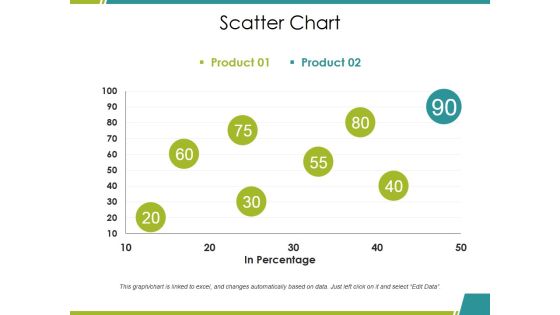
Scatter Chart Ppt PowerPoint Presentation Summary Inspiration
This is a scatter chart ppt powerpoint presentation summary inspiration. This is a two stage process. The stages in this process are product, in percentage, growth, success, business.

Pie Chart Ppt PowerPoint Presentation Inspiration Summary
This is a pie chart ppt powerpoint presentation inspiration summary. This is a five stage process. The stages in this process are product, donut, business, percentage, marketing.

Pie Chart Ppt PowerPoint Presentation Layouts Elements
This is a pie chart ppt powerpoint presentation layouts elements. This is a four stage process. The stages in this process are product, business, marketing, percentage, growth.
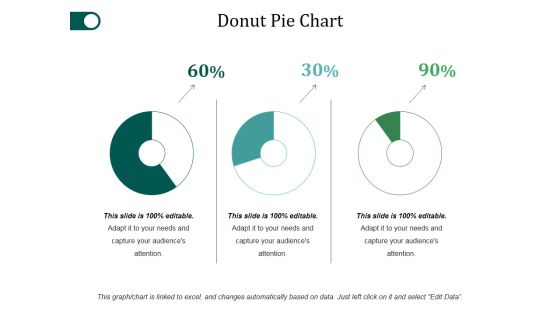
Donut Pie Chart Ppt PowerPoint Presentation Examples
This is a donut pie chart ppt powerpoint presentation examples. This is a three stage process. The stages in this process are percentage, finance, donut, business.
Stock Chart Ppt PowerPoint Presentation Inspiration Icon
This is a stock chart ppt powerpoint presentation inspiration icon. This is a two stage process. The stages in this process are high, volume, low, product, close.

Bubble Chart Ppt PowerPoint Presentation Outline Smartart
This is a bubble chart ppt powerpoint presentation outline smartart. This is a two stage process. The stages in this process are analysis, finance, business, marketing, strategy.

Scatter Chart Ppt PowerPoint Presentation File Visuals
This is a scatter chart ppt powerpoint presentation file visuals. This is a two stage process. The stages in this process are product, profit, in percentage, growth, success.
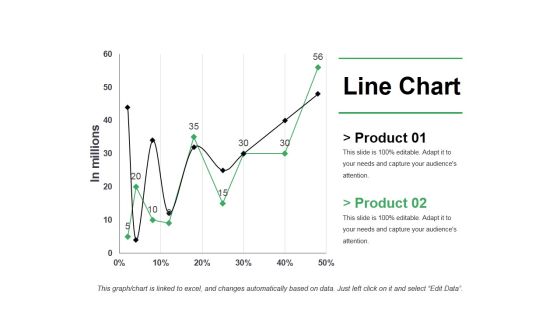
Line Chart Ppt PowerPoint Presentation Pictures Shapes
This is a line chart ppt powerpoint presentation pictures shapes. This is a two stage process. The stages in this process are business, marketing, strategy, finance, growth.

Area Chart Ppt PowerPoint Presentation Outline Objects
This is a area chart ppt powerpoint presentation outline objects. This is a two stage process. The stages in this process are product, sales in percentage, financial year.
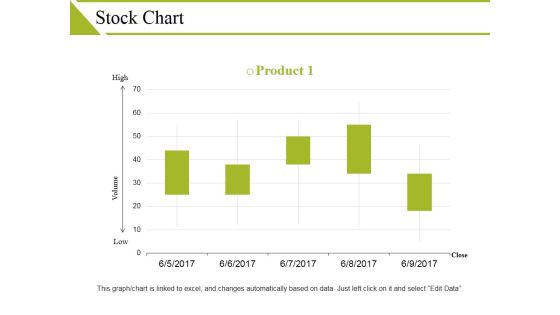
Stock Chart Ppt PowerPoint Presentation Show Guidelines
This is a stock chart ppt powerpoint presentation show guidelines. This is a one stage process. The stages in this process are high, volume, low, product, close.

Donut Chart Ppt PowerPoint Presentation Gallery Guide
This is a donut chart ppt powerpoint presentation gallery guide. This is a six stage process. The stages in this process are percentage, finance, donut, business, process.

Radar Chart Ppt PowerPoint Presentation Infographics Portfolio
This is a radar chart ppt powerpoint presentation infographics portfolio. This is a two stage process. The stages in this process are product, finance, shapes, business, marketing.
Stock Chart Ppt PowerPoint Presentation Icon Format
This is a stock chart ppt powerpoint presentation icon format. This is a two stage process. The stages in this process are product, close, high, volume, low.

Area Chart Ppt PowerPoint Presentation Show Backgrounds
This is a area chart ppt powerpoint presentation show backgrounds. This is a two stage process. The stages in this process are financial year, product, in percentage.

Area Chart Ppt PowerPoint Presentation Pictures Designs
This is a area chart ppt powerpoint presentation pictures designs. This is a two stage process. The stages in this process are product, sales in percentage, growth, success.

Line Chart Ppt PowerPoint Presentation Pictures Layout
This is a line chart ppt powerpoint presentation pictures layout. This is a two stage process. The stages in this process are product, financial years, sales in percentage.

Area Chart Ppt PowerPoint Presentation Professional Grid
This is a area chart ppt powerpoint presentation professional grid. This is a two stage process. The stages in this process are product, sales in percentage, business.

Bar Chart Ppt PowerPoint Presentation Portfolio Inspiration
This is a bar chart ppt powerpoint presentation portfolio inspiration. This is a two stage process. The stages in this process are product, in percentage, in years.

Line Chart Ppt PowerPoint Presentation Layouts Templates
This is a line chart ppt powerpoint presentation layouts templates. This is a two stage process. The stages in this process are product, in percentage, in years.

Stock Chart Ppt PowerPoint Presentation Layouts Outfit
This is a stock chart ppt powerpoint presentation layouts outfit. This is a two stage process. The stages in this process are close, high, volume, low, open.

Column Chart Ppt PowerPoint Presentation Ideas Demonstration
This is a column chart ppt powerpoint presentation ideas demonstration. This is a two stage process. The stages in this process are business, marketing, expenditure in, strategy, graph.

Stock Chart Ppt PowerPoint Presentation Guide
This is a stock chart ppt powerpoint presentation guide. This is a two stage process. The stages in this process are product, close, high, volume, low.

Financial Chart Ppt PowerPoint Presentation Outline Show
This is a financial chart ppt powerpoint presentation outline show. This is three stage process. The stages in this process are financial, minimum, medium, maximum.

Area Chart Ppt PowerPoint Presentation Summary Model
This is a area chart ppt powerpoint presentation summary model. This is a two stage process. The stages in this process are analysis, finance, marketing, management, investment.

Column Chart Ppt PowerPoint Presentation Layouts Rules
This is a column chart ppt powerpoint presentation layouts rules. This is a two stage process. The stages in this process are analysis, finance, marketing, management, investment.

Column Chart Ppt PowerPoint Presentation Portfolio Inspiration
This is a column chart ppt powerpoint presentation portfolio inspiration. This is a two stage process. The stages in this process are finance, marketing, management, investment, analysis.

Area Chart Ppt PowerPoint Presentation Gallery Diagrams
This is a area chart ppt powerpoint presentation gallery diagrams. This is a two stage process. The stages in this process are finance, marketing, management, investment, analysis.

Area Chart Ppt PowerPoint Presentation Summary Icon
This is a area chart ppt powerpoint presentation summary icon. This is a two stage process. The stages in this process are finance, marketing, management, investment, analysis.

Column Chart Ppt PowerPoint Presentation Slides Format
This is a column chart ppt powerpoint presentation slides format. This is a two stage process. The stages in this process are finance, marketing, management, investment, analysis.

Column Chart Ppt PowerPoint Presentation Show Outfit
This is a column chart ppt powerpoint presentation show outfit. This is a two stage process. The stages in this process are product, percentage, marketing.

Combo Chart Ppt PowerPoint Presentation File Example
This is a combo chart ppt powerpoint presentation file example. This is a three stage process. The stages in this process are product, percentage, marketing, business, management.

Combo Chart Ppt PowerPoint Presentation Model Grid
This is a combo chart ppt powerpoint presentation model grid. This is a three stage process. The stages in this process are growth, product, percentage, marketing.

Line Chart Ppt PowerPoint Presentation Summary Guidelines
This is a line chart ppt powerpoint presentation summary guidelines. This is a two stage process. The stages in this process are percentage, product, business, management, marketing.

Stock Chart Ppt PowerPoint Presentation Show Pictures
This is a stock chart ppt powerpoint presentation show pictures. This is a five stage process. The stages in this process are product, percentage, management, marketing.

Pie Chart Ppt PowerPoint Presentation Model Smartart
This is a pie chart ppt powerpoint presentation model smartart. This is a five stage process. The stages in this process are management, marketing, business, percentage, product.

Column Chart Ppt PowerPoint Presentation Gallery Templates
This is a column chart ppt powerpoint presentation gallery templates. This is a two stage process. The stages in this process are management, marketing, business, percentage.

Column Chart Ppt PowerPoint Presentation Ideas Example
This is a column chart ppt powerpoint presentation ideas example. This is a five stage process. The stages in this process are percentage, product, management, marketing.
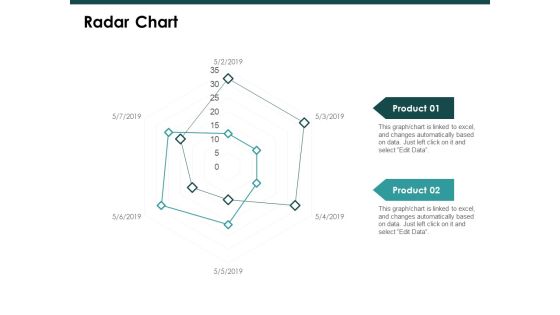
Radar Chart Graph Ppt PowerPoint Presentation Slide
This is a radar chart graph ppt powerpoint presentation slide. This is a two stage process. The stages in this process are finance, marketing, management, investment, analysis.

Pie Chart Finance Ppt Powerpoint Presentation Introduction
This is a pie chart finance ppt powerpoint presentation introduction. This is a three stage process. The stages in this process are finance, marketing, analysis, investment, strategy.

Education Dashboard With Fees Collection And Expense Metrics Demonstration PDF
This slide covers education key performance indicators tracking dashboard. It also include metrics such as total students, teachers, parents, total earrings, social media followers, event calendar, fees collection, and expenses. Showcasing this set of slides titled Education Dashboard With Fees Collection And Expense Metrics Demonstration PDF. The topics addressed in these templates are Event Calender, Annual Holidays, Fees Collection, Expenses. All the content presented in this PPT design is completely editable. Download it and make adjustments in color, background, font etc. as per your unique business setting.

Smarketing Alignment Technologies Used By Business Ppt Show Visual Aids PDF
This slide shows various technologies used by business which can be used in sales and marketing alignment. It includes digital asset management, content calendar artificial intelligence, etc. Showcasing this set of slides titled Smarketing Alignment Technologies Used By Business Ppt Show Visual Aids PDF. The topics addressed in these templates are Email Marketing, Sales Enablement Platform, Content Management. All the content presented in this PPT design is completely editable. Download it and make adjustments in color, background, font etc. as per your unique business setting.
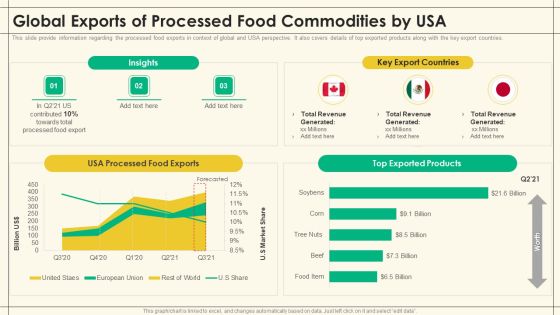
Precooked Food Industry Analysis Global Exports Of Processed Food Commodities By USA Topics PDF
This slide provide information regarding the processed food exports in context of global and USA perspective. It also covers details of top exported products along with the key export countries. Deliver and pitch your topic in the best possible manner with this Precooked Food Industry Analysis Global Exports Of Processed Food Commodities By USA Topics PDF. Use them to share invaluable insights on Supply Chain, Calendar Week, Carrying Costs and impress your audience. This template can be altered and modified as per your expectations. So, grab it now.

B2C Content Marketing Statistics Indicating Usage Of Techniques Sample PDF
This slide showcases business to consumer B2C content marketing figures highlighting usage of key strategies. It provides information about targeting, editorial calendar, promotion, website UI, social media, service development, etc. Pitch your topic with ease and precision using this B2C Content Marketing Statistics Indicating Usage Of Techniques Sample PDF. This layout presents information on Strategies, Marketers, Content Team. It is also available for immediate download and adjustment. So, changes can be made in the color, design, graphics or any other component to create a unique layout.
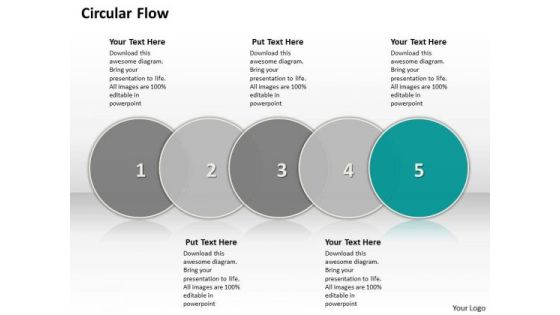
Ppt Circular Motion PowerPoint Flow Showing 5 Steps Involved Development Templates
PPT circular motion powerpoint flow showing 5 steps involved development Templates-This PowerPoint Diagram shows you the Circular Interpretation of the process which includes five phases. This Diagram can be used for the Presentation on art, arrow, bright, calendar, chart, circle, circular, clip, clipart, collection, graphic, illustration, isolated, menu, process, round. This Smart art can be used for Business Presentations. You can apply other 3D Styles and shapes to the slide to enhance your presentations.-PPT circular motion powerpoint flow showing 5 steps involved development Templates-3, Advice, Analysis, Analyze, Answer, Area, Career, Chart, Choice, Circles, Concept, Determination, Diagram, Graph, Idea, Illustration, Intersect, Measurement, Opportunities, Options, Overlap, Overlapped, Overlapping, Passion, Passionate, Prioritize, Priority, Profession
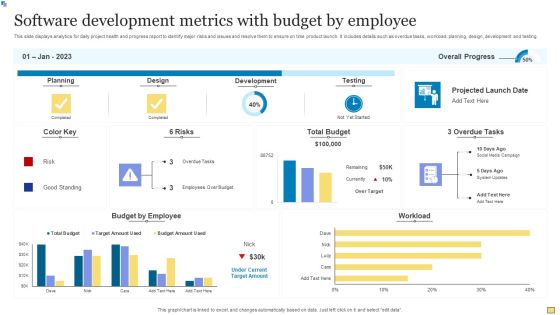
Software Development Metrics With Budget By Employee Guidelines PDF
This slide displays analytics for daily project health and progress report to identify major risks and issues and resolve them to ensure on time product launch. It includes details such as overdue tasks, workload, planning, design, development and testing. Pitch your topic with ease and precision using this Software Development Metrics With Budget By Employee Guidelines PDF. This layout presents information on Planning, Development, Testing. It is also available for immediate download and adjustment. So, changes can be made in the color, design, graphics or any other component to create a unique layout.
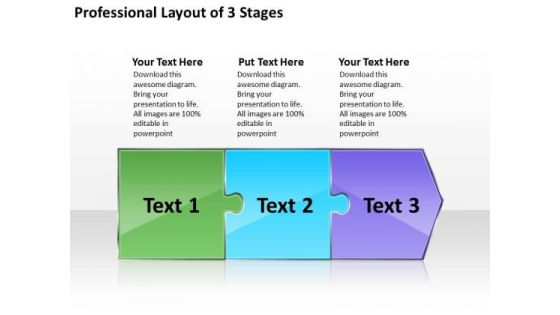
Professional Layout 3 Stages Oil Flow Chart PowerPoint Templates
We present our professional layout 3 stages oil flow chart PowerPoint templates.Use our Business PowerPoint Templates because,You have secured a name for yourself in the domestic market. Now the time is right to spread your reach to other countries Use our Puzzles or Jigsaws PowerPoint Templates because, Your foot is on the pedal and your company is purring along smoothly. Use our Shapes PowerPoint Templates because, This Diagram pinpoints the critical paths and areas in your process and set the timelines for their completion Use our Arrows PowerPoint Templates because,This diagram helps you to show goal also clearly etched in your mind. Use our Process and Flows PowerPoint Templates because,You can gain the success to desired levels in one go.Use these PowerPoint slides for presentations relating to algorithm, arrow, arrows, block, business, chart, connection, design, development, diagram, direction, element, flow, flowchart, graph, kind, linear, management, of, organization, process, program, section, segment, set, sign, solution, strategy, symbol. The prominent colors used in the PowerPoint template are Green, Blue, Purple. People tell us our professional layout 3 stages oil flow chart PowerPoint templates are Luxurious. The feedback we get is that our business PowerPoint templates and PPT Slides are Adorable. People tell us our professional layout 3 stages oil flow chart PowerPoint templates are Tranquil. Presenters tell us our business PowerPoint templates and PPT Slides are Perfect. The feedback we get is that our professional layout 3 stages oil flow chart PowerPoint templates are Reminiscent. Professionals tell us our connection PowerPoint templates and PPT Slides are Classic.

9 Arrows Describing Nine Steps Flow Charting PowerPoint Templates
We present our 9 arrows describing nine steps flow charting PowerPoint templates.Download and present our Arrows PowerPoint Templates because it is all there in bits and pieces. Present our Shapes PowerPoint Templates because your ideas are fundamentally stable with a broad base of workable possibilities. Download our Business PowerPoint Templates because it helps you to project your enthusiasm and single mindedness to your colleagues. Use our Leadership PowerPoint Templates because our creative template will lay down your views. Present our Process and Flows PowerPoint Templates because they enhance the essence of your viable ideas.Use these PowerPoint slides for presentations relating to Arrow, Arrows, Block, Business, Chart, Design, Development, Diagram, Direction, Element, Flow, Flowchart, Graph, Linear, Management, Organization, Process, Program, Section, Sign, Solution, Symbol. The prominent colors used in the PowerPoint template are Blue navy, Blue, Black. Customers tell us our 9 arrows describing nine steps flow charting PowerPoint templates are Sparkling. The feedback we get is that our Direction PowerPoint templates and PPT Slides are Nice. Professionals tell us our 9 arrows describing nine steps flow charting PowerPoint templates are Chic. People tell us our Design PowerPoint templates and PPT Slides are Charming. Customers tell us our 9 arrows describing nine steps flow charting PowerPoint templates are Endearing. Professionals tell us our Business PowerPoint templates and PPT Slides are Striking.
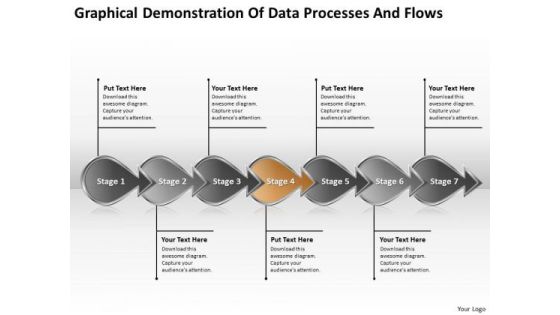
Demonstration Of Data Processes And Flows Chart Flowcharting PowerPoint Templates
We present our demonstration of data processes and flows chart flowcharting PowerPoint templates.Download and present our Leadership PowerPoint Templates because you know what it takes to keep it fit and healthy. Use our Business PowerPoint Templates because this template helps you to grab the attention of your listeners. Download our Arrows PowerPoint Templates because it helps to anticipate the doubts and questions in the minds of your colleagues and enlighten them with your inspired strategy to garner desired success. Download our Marketing PowerPoint Templates because the mind is always whirring with new ideas. Use our Process and Flows PowerPoint Templates because forward thinking is the way to go.Use these PowerPoint slides for presentations relating to Arrow Arrows Block Business Chart Design Development Diagram Direction Element Flow Flowchart Graph Linear Management Organization Process Program Section Sign Solution Symbol. The prominent colors used in the PowerPoint template are Orange, Gray, Black. Use our demonstration of data processes and flows chart flowcharting PowerPoint templates are Gorgeous. Presenters tell us our Block PowerPoint templates and PPT Slides are Radiant. Presenters tell us our demonstration of data processes and flows chart flowcharting PowerPoint templates are Tasteful. You can be sure our Development PowerPoint templates and PPT Slides are Versatile. PowerPoint presentation experts tell us our demonstration of data processes and flows chart flowcharting PowerPoint templates are Clever. Professionals tell us our Block PowerPoint templates and PPT Slides are Second to none.

Agile Information Technology Project Administration Feature Driven Development FDD Framework Formats PDF
This slide covers extreme programming framework including planning, design, coding, testing, release etc. Deliver an awe inspiring pitch with this creative agile information technology project administration feature driven development fdd framework formats pdf bundle. Topics like extreme programming xp in agile framework can be discussed with this completely editable template. It is available for immediate download depending on the needs and requirements of the user.

Corporate Governance Of ICT Life Cycle Of Information And Technology Governance Introduction PDF
This slide describes the life cycle of it governance that includes 7 phases such as initiate program, define problems and opportunities, define road map, plan program, and so on. There are so many reasons you need a Corporate Governance Of ICT Life Cycle Of Information And Technology Governance Introduction PDF. The first reason is you can not spend time making everything from scratch, Thus, Slidegeeks has made presentation templates for you too. You can easily download these templates from our website easily.
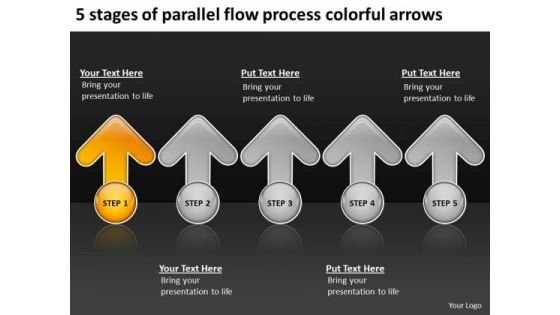
Flow Process Colorful Arrows Free Printable Business Plan Templates PowerPoint Slides
We present our flow process colorful arrows free printable business plan templates PowerPoint Slides.Use our Flow Charts PowerPoint Templates because the majestic tiger lord of all it surveys.It exudes power even when it is in repose. Present our Arrows PowerPoint Templates because you are going along well but your foresight shows that it may need a slight change in plans or direction. Use our Business PowerPoint Templates because you have had a great year or so business wise. It is time to celebrate the efforts of your team. Use our Shapes PowerPoint Templates because by using this slide you can Heighten the anticipation of your audience listing . Download and present our Process and Flows PowerPoint Templates because this slide brings grey areas to the table and explain in detail you assessment of the need for care to ensure continued smooth progress.Use these PowerPoint slides for presentations relating to Arrow, blue, business, circle, circular, collection, connection, cursor, decoration, design, direction, down, downwards, element, glossy, illustration, information, pointer, pointing, reflective, technology. The prominent colors used in the PowerPoint template are Orange, Gray, White. Use our flow process colorful arrows free printable business plan templates PowerPoint Slides effectively help you save your valuable time. Customers tell us our business PowerPoint templates and PPT Slides are Graceful. You can be sure our flow process colorful arrows free printable business plan templates PowerPoint Slides are aesthetically designed to attract attention. We guarantee that they will grab all the eyeballs you need. The feedback we get is that our circle PowerPoint templates and PPT Slides are Efficacious. You can be sure our flow process colorful arrows free printable business plan templates PowerPoint Slides are Fantastic. People tell us our connection PowerPoint templates and PPT Slides are Bold.
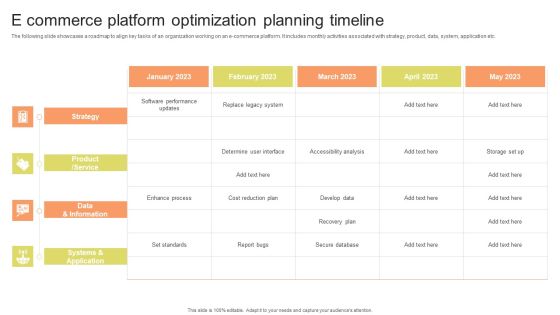
E Commerce Platform Optimization Planning Timeline Sample PDF
The following slide showcases a roadmap to align key tasks of an organization working on an e-commerce platform. It includes monthly activities associated with strategy, product, data, system, application etc. Pitch your topic with ease and precision using this E Commerce Platform Optimization Planning Timeline Sample PDF. This layout presents information on Accessibility Analysis, Strategy, Systems And Application. It is also available for immediate download and adjustment. So, changes can be made in the color, design, graphics or any other component to create a unique layout.

Website Development Cost Management Plan Diagrams PDF
In this slide we have showcased website development cost management plan which includes major activities and task involved, we have showcased how much percentage budget allocated for each tasks. Pitch your topic with ease and precision using this website development cost management plan diagrams pdf. This layout presents information on planning, development, maintenance. It is also available for immediate download and adjustment. So, changes can be made in the color, design, graphics or any other component to create a unique layout

Tactical Personnel Planning Model Dashboard Pictures PDF
This slide displays the overall report of the organization workforce. It includes demand and supply , skill analysis , gap analysis and headcount plan. Showcasing this set of slides titled Tactical Personnel Planning Model Dashboard Pictures PDF. The topics addressed in these templates are Tactical Personnel Planning, Model Dashboard. All the content presented in this PPT design is completely editable. Download it and make adjustments in color, background, font etc. as per your unique business setting.

Of Flow Chart 3 Concepts Chart Relative Circular Arrow Diagram PowerPoint Slides
We present our of flow chart 3 concepts chart Relative Circular Arrow Diagram PowerPoint Slides.Present our Ring Charts PowerPoint Templates because your brain is always churning out ideas like cogs in a wheel. Download and present our Process and Flows PowerPoint Templates because you have a clear vision of the cake you want. Present our Circle charts PowerPoint Templates because some opportunities are bound to be highly profitable for you to follow up. Download our Business PowerPoint Templates because you have had a great year or so business wise. It is time to celebrate the efforts of your team. Download our Arrows PowerPoint Templates because this can explain the various related aspects of these varied tracks and how they will, on hitting their own targets, cumulatively contribute to hitting GOLD.Use these PowerPoint slides for presentations relating to Arrow, art, blue, button, chart, clip,communication, design, diagram,element, graph, graphic, green, icon,illustration, isolated, loop, network,process, purple, recycling, red, round,set, shape, shiny, symbol, teamwork,. The prominent colors used in the PowerPoint template are Blue, Black, White. People tell us our of flow chart 3 concepts chart Relative Circular Arrow Diagram PowerPoint Slides are Fashionable. Customers tell us our blue PowerPoint templates and PPT Slides are Liberated. Professionals tell us our of flow chart 3 concepts chart Relative Circular Arrow Diagram PowerPoint Slides are Stunning. Presenters tell us our chart PowerPoint templates and PPT Slides are Sparkling. Use our of flow chart 3 concepts chart Relative Circular Arrow Diagram PowerPoint Slides are Radiant. Presenters tell us our chart PowerPoint templates and PPT Slides are aesthetically designed to attract attention. We guarantee that they will grab all the eyeballs you need.
Process Plan For Affirmative Plan For Equal Opportunity Sample PDF
This slide presents affirmative action program, helpful in planning out individual steps of process in strategic manner to achieve organisational goals. It includes action item, objectives, responsible party, timeline and metrics. Showcasing this set of slides titled Process Plan For Affirmative Plan For Equal Opportunity Sample PDF. The topics addressed in these templates are Conduct Workforce Analysis, Recruitment Strategies, Development Programs. All the content presented in this PPT design is completely editable. Download it and make adjustments in color, background, font etc. as per your unique business setting.
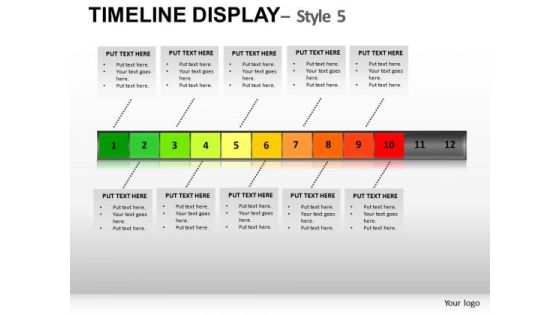
Editable Forecasting Planning PowerPoint Slides And Ppt Diagram Templates
Editable Forecasting Planning PowerPoint Slides And PPT Diagram Templates-These high quality, editable pre-designed powerpoint slides have been carefully created by our professional team to help you impress your audience. Each graphic in every slide is vector based and is 100% editable in powerpoint. Each and every property of any slide - color, size, shading etc can be modified to build an effective powerpoint presentation. Use these slides to convey complex business concepts in a simplified manner. Any text can be entered at any point in the powerpoint slide. Simply DOWNLOAD, TYPE and PRESENT!
