Schedule
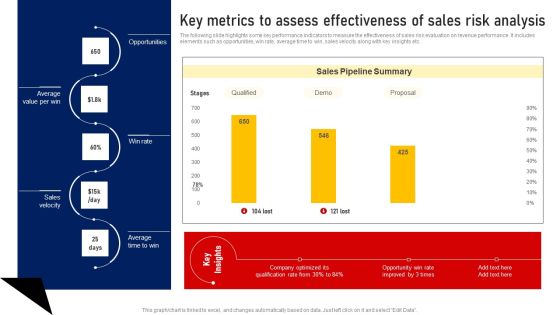
Performing Sales Risk Analysis Procedure Key Metrics To Assess Effectiveness Of Sales Risk Analysis Brochure PDF
The following slide highlights some key performance indicators to measure the effectiveness of sales risk evaluation on revenue performance. It includes elements such as opportunities, win rate, average time to win, sales velocity along with key insights etc. Get a simple yet stunning designed Performing Sales Risk Analysis Procedure Key Metrics To Assess Effectiveness Of Sales Risk Analysis Brochure PDF. It is the best one to establish the tone in your meetings. It is an excellent way to make your presentations highly effective. So, download this PPT today from Slidegeeks and see the positive impacts. Our easy to edit Performing Sales Risk Analysis Procedure Key Metrics To Assess Effectiveness Of Sales Risk Analysis Brochure PDF can be your go to option for all upcoming conferences and meetings. So, what are you waiting for Grab this template today.

Performing Sales Risk Analysis Procedure Major Factors Contributing Sales Risks Topics PDF
The following slide depicts some key drivers that elevate sales risks to define its scope and impact. It mainly includes elements such as rapid technology evolution, market fluctuation, market competition, risk management strategies along with key insights etc. From laying roadmaps to briefing everything in detail, our templates are perfect for you. You can set the stage with your presentation slides. All you have to do is download these easy to edit and customizable templates. Performing Sales Risk Analysis Procedure Major Factors Contributing Sales Risks Topics PDF will help you deliver an outstanding performance that everyone would remember and praise you for. Do download this presentation today.

Dashboard To Evaluate Display Advertising Source Conversion And Cost Designs PDF
This slide provides a dashboard to assess the rate of conversion and cost of display advertising campaign by different sources. It includes source, average cost of marketing, conversion, click, revenue, impression by source. Make sure to capture your audiences attention in your business displays with our gratis customizable Dashboard To Evaluate Display Advertising Source Conversion And Cost Designs PDF. These are great for business strategies, office conferences, capital raising or task suggestions. If you desire to acquire more customers for your tech business and ensure they stay satisfied, create your own sales presentation with these plain slides.

Dashboard To Measure Display Advertising Campaigns Performance Graphics PDF
This slide provides a dashboard to monitor the display advertising campaign performance in order to reduce overall marketing cost. It incorporates advertising cost, average number of clicks and impressions, clicks per day, revenue by campaign, etc. Formulating a presentation can take up a lot of effort and time, so the content and message should always be the primary focus. The visuals of the PowerPoint can enhance the presenters message, so our Dashboard To Measure Display Advertising Campaigns Performance Graphics PDF was created to help save time. Instead of worrying about the design, the presenter can concentrate on the message while our designers work on creating the ideal templates for whatever situation is needed. Slidegeeks has experts for everything from amazing designs to valuable content, we have put everything into Dashboard To Measure Display Advertising Campaigns Performance Graphics PDF
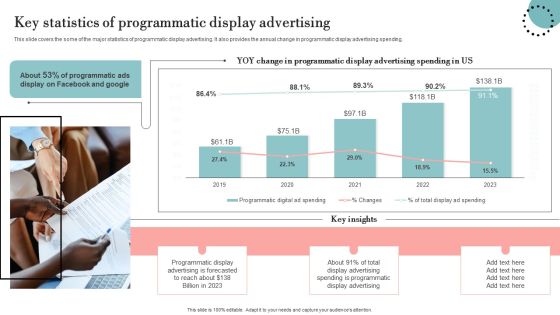
Key Statistics Of Programmatic Display Advertising Pictures PDF
This slide covers the some of the major statistics of programmatic display advertising. It also provides the annual change in programmatic display advertising spending. Presenting this PowerPoint presentation, titled Key Statistics Of Programmatic Display Advertising Pictures PDF, with topics curated by our researchers after extensive research. This editable presentation is available for immediate download and provides attractive features when used. Download now and captivate your audience. Presenting this Key Statistics Of Programmatic Display Advertising Pictures PDF. Our researchers have carefully researched and created these slides with all aspects taken into consideration. This is a completely customizable Key Statistics Of Programmatic Display Advertising Pictures PDF that is available for immediate downloading. Download now and make an impact on your audience. Highlight the attractive features available with our PPTs.

YOY Change In Display Advertising Spending Trends Rules PDF
Mentioned slide provides overview of major facts and figures of affiliate marketing. It incorporate annual change in advertising spendings, average CPC of google and facebook, annual earning by google via display advertising. Slidegeeks is here to make your presentations a breeze with YOY Change In Display Advertising Spending Trends Rules PDF With our easy to use and customizable templates, you can focus on delivering your ideas rather than worrying about formatting. With a variety of designs to choose from, you are sure to find one that suits your needs. And with animations and unique photos, illustrations, and fonts, you can make your presentation pop. So whether you are giving a sales pitch or presenting to the board, make sure to check out Slidegeeks first.

Information Analytics Company Outline Revenue By Customer Fy2023 Topics PDF
This slide highlights the revenue by customer which includes financial service, direct to consumer, health, retail, automotive, insurance, government, and public sector, media and technology. Slidegeeks is here to make your presentations a breeze with Information Analytics Company Outline Revenue By Customer Fy2023 Topics PDF With our easy to use and customizable templates, you can focus on delivering your ideas rather than worrying about formatting. With a variety of designs to choose from, you are sure to find one that suits your needs. And with animations and unique photos, illustrations, and fonts, you can make your presentation pop. So whether you are giving a sales pitch or presenting to the board, make sure to check out Slidegeeks first.

Information Analytics Company Outline Capital Expenditure Capex Information PDF
This slide highlights the Experian company capital expenditure breakdown which includes and total capital investment breakdown with development, infrastructure and data. Are you in need of a template that can accommodate all of your creative concepts This one is crafted professionally and can be altered to fit any style. Use it with Google Slides or PowerPoint. Include striking photographs, symbols, depictions, and other visuals. Fill, move around, or remove text boxes as desired. Test out color palettes and font mixtures. Edit and save your work, or work with colleagues. Download Information Analytics Company Outline Capital Expenditure Capex Information PDF and observe how to make your presentation outstanding. Give an impeccable presentation to your group and make your presentation unforgettable.
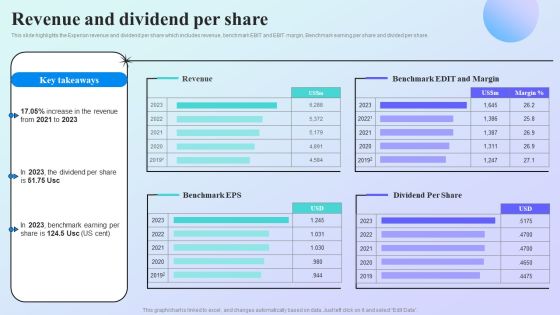
Information Analytics Company Outline Revenue And Dividend Per Share Guidelines PDF
This slide highlights the Experian revenue and dividend per share which includes revenue, benchmark EBIT and EBIT margin, Benchmark earning per share and divided per share. Presenting this PowerPoint presentation, titled Information Analytics Company Outline Revenue And Dividend Per Share Guidelines PDF, with topics curated by our researchers after extensive research. This editable presentation is available for immediate download and provides attractive features when used. Download now and captivate your audience. Presenting this Information Analytics Company Outline Revenue And Dividend Per Share Guidelines PDF. Our researchers have carefully researched and created these slides with all aspects taken into consideration. This is a completely customizable Information Analytics Company Outline Revenue And Dividend Per Share Guidelines PDF that is available for immediate downloading. Download now and make an impact on your audience. Highlight the attractive features available with our PPTs.

Information Analytics Company Outline Revenue By Business Activity And Regions Clipart PDF
This slide highlights the Experian company revenue which includes the revenue by business activity B2B Data, B2B decisioning and consumer services and revenue by regions North America, Latin America, UK, Ireland and EMEA. Here you can discover an assortment of the finest PowerPoint and Google Slides templates. With these templates, you can create presentations for a variety of purposes while simultaneously providing your audience with an eye catching visual experience. Download Information Analytics Company Outline Revenue By Business Activity And Regions Clipart PDF to deliver an impeccable presentation. These templates will make your job of preparing presentations much quicker, yet still, maintain a high level of quality. Slidegeeks has experienced researchers who prepare these templates and write high quality content for you. Later on, you can personalize the content by editing the Information Analytics Company Outline Revenue By Business Activity And Regions Clipart PDF.
Real Time Incident Management Solution Investor Funding Pitch Deck Contact Us Infographics PDF
Are you in need of a template that can accommodate all of your creative concepts This one is crafted professionally and can be altered to fit any style. Use it with Google Slides or PowerPoint. Include striking photographs, symbols, depictions, and other visuals. Fill, move around, or remove text boxes as desired. Test out color palettes and font mixtures. Edit and save your work, or work with colleagues. Download Real Time Incident Management Solution Investor Funding Pitch Deck Contact Us Infographics PDF and observe how to make your presentation outstanding. Give an impeccable presentation to your group and make your presentation unforgettable.

Real Time Incident Management Solution Investor Funding Pitch Deck Financial Performance Information PDF
This slide showcases the financial performance of the company which provides an incident management platform with intelligent slack integration. It include graph that shows the annualized revenue of the company and NPS Net Promoter Score. Crafting an eye catching presentation has never been more straightforward. Let your presentation shine with this tasteful yet straightforward Real Time Incident Management Solution Investor Funding Pitch Deck Financial Performance Information PDF template. It offers a minimalistic and classy look that is great for making a statement. The colors have been employed intelligently to add a bit of playfulness while still remaining professional. Construct the ideal Real Time Incident Management Solution Investor Funding Pitch Deck Financial Performance Information PDF that effortlessly grabs the attention of your audience. Begin now and be certain to wow your customers.

Benefits And Impact Of Presence Functionality Usage On Employee Productivity Ppt Layouts Example PDF
Following slide displays informational stats about benefits of using presence functionality on employee productivity along with the impact stats of instant messaging software on the same. Create an editable Benefits And Impact Of Presence Functionality Usage On Employee Productivity Ppt Layouts Example PDF that communicates your idea and engages your audience. Whether youre presenting a business or an educational presentation, pre designed presentation templates help save time. Benefits And Impact Of Presence Functionality Usage On Employee Productivity Ppt Layouts Example PDF is highly customizable and very easy to edit, covering many different styles from creative to business presentations. Slidegeeks has creative team members who have crafted amazing templates. So, go and get them without any delay.

Customer Service Measurement KPI Dashboard Ppt File Portfolio PDF
Mentioned slide portrays customer service measurement KPI dashboard that includes metrics namely request volume vs. service level, customer satisfaction, customer retention, costs per support and average time to solve issue. Do you have to make sure that everyone on your team knows about any specific topic I yes, then you should give Customer Service Measurement KPI Dashboard Ppt File Portfolio PDF a try. Our experts have put a lot of knowledge and effort into creating this impeccable Customer Service Measurement KPI Dashboard Ppt File Portfolio PDF. You can use this template for your upcoming presentations, as the slides are perfect to represent even the tiniest detail. You can download these templates from the Slidegeeks website and these are easy to edit. So grab these today.

Determining Customer Lifetime Value And Churn Rate Ppt File Good PDF
This slide shows informational statistics about customer lifetime value and churn rate in FY23. It also shows that average customer lifetime for 2022 was 23 months. From laying roadmaps to briefing everything in detail, our templates are perfect for you. You can set the stage with your presentation slides. All you have to do is download these easy to edit and customizable templates. Determining Customer Lifetime Value And Churn Rate Ppt File Good PDF will help you deliver an outstanding performance that everyone would remember and praise you for. Do download this presentation today.
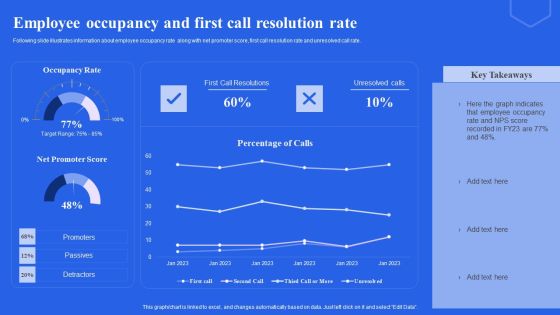
Employee Occupancy And First Call Resolution Rate Ppt Gallery PDF
Following slide illustrates information about employee occupancy rate along with net promoter score, first call resolution rate and unresolved call rate. Present like a pro with Employee Occupancy And First Call Resolution Rate Ppt Gallery PDF Create beautiful presentations together with your team, using our easy to use presentation slides. Share your ideas in real time and make changes on the fly by downloading our templates. So whether you are in the office, on the go, or in a remote location, you can stay in sync with your team and present your ideas with confidence. With Slidegeeks presentation got a whole lot easier. Grab these presentations today.

KPI Dashboard To Track Risk Events Ppt Infographic Template Layout Ideas PDF
This slide displays KPI dashboard that can be used by a firm to track multiple risk events. Metrics covered in the dashboard are residual risks by period and risk category by total risk rating. Are you in need of a template that can accommodate all of your creative concepts This one is crafted professionally and can be altered to fit any style. Use it with Google Slides or PowerPoint. Include striking photographs, symbols, depictions, and other visuals. Fill, move around, or remove text boxes as desired. Test out color palettes and font mixtures. Edit and save your work, or work with colleagues. Download KPI Dashboard To Track Risk Events Ppt Infographic Template Layout Ideas PDF and observe how to make your presentation outstanding. Give an impeccable presentation to your group and make your presentation unforgettable.
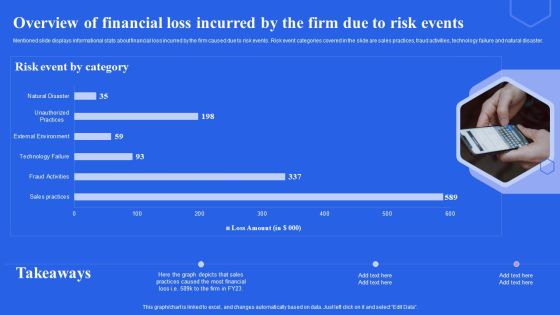
Overview Of Financial Loss Incurred By The Firm Due To Risk Events Ppt Infographics Slides PDF
Mentioned slide displays informational stats about financial loss incurred by the firm caused due to risk events. Risk event categories covered in the slide are sales practices, fraud activities, technology failure and natural disaster. Make sure to capture your audiences attention in your business displays with our gratis customizable Overview Of Financial Loss Incurred By The Firm Due To Risk Events Ppt Infographics Slides PDF. These are great for business strategies, office conferences, capital raising or task suggestions. If you desire to acquire more customers for your tech business and ensure they stay satisfied, create your own sales presentation with these plain slides.
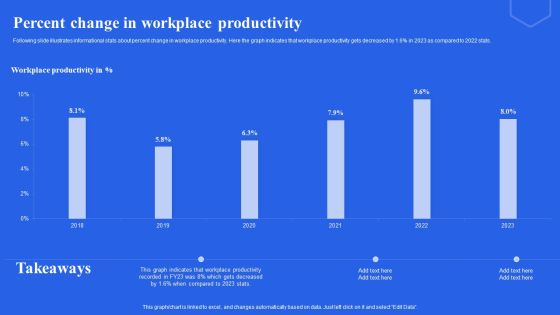
Percent Change In Workplace Productivity Ppt Pictures Slideshow PDF
Following slide illustrates informational stats about percent change in workplace productivity. Here the graph indicates that workplace productivity gets decreased by 1.6 percent in 2023 as compared to 2022 stats. Formulating a presentation can take up a lot of effort and time, so the content and message should always be the primary focus. The visuals of the PowerPoint can enhance the presenters message, so our Percent Change In Workplace Productivity Ppt Pictures Slideshow PDF was created to help save time. Instead of worrying about the design, the presenter can concentrate on the message while our designers work on creating the ideal templates for whatever situation is needed. Slidegeeks has experts for everything from amazing designs to valuable content, we have put everything into Percent Change In Workplace Productivity Ppt Pictures Slideshow PDF
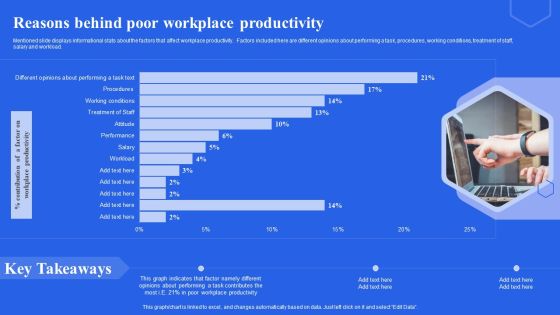
Reasons Behind Poor Workplace Productivity Ppt Infographics Rules PDF
Mentioned slide displays informational stats about the factors that affect workplace productivity. Factors included here are different opinions about performing a task, procedures, working conditions, treatment of staff, salary and workload. Coming up with a presentation necessitates that the majority of the effort goes into the content and the message you intend to convey. The visuals of a PowerPoint presentation can only be effective if it supplements and supports the story that is being told. Keeping this in mind our experts created Reasons Behind Poor Workplace Productivity Ppt Infographics Rules PDF to reduce the time that goes into designing the presentation. This way, you can concentrate on the message while our designers take care of providing you with the right template for the situation.

Sales Opportunity Monitoring Dashboard Ppt Infographics Good PDF
Explore a selection of the finest Sales Opportunity Monitoring Dashboard Ppt Infographics Good PDF here. With a plethora of professionally designed and pre made slide templates, you can quickly and easily find the right one for your upcoming presentation. You can use our Sales Opportunity Monitoring Dashboard Ppt Infographics Good PDF to effectively convey your message to a wider audience. Slidegeeks has done a lot of research before preparing these presentation templates. The content can be personalized and the slides are highly editable. Grab templates today from Slidegeeks.

Assessing Impact Of Sales Risk Management With Kpi Dashboard Diagrams PDF
The following slide highlights some key performance indicators KPIs to measure the influence of executing sales risk management strategies on revenue performance. It includes elements such as target attainment rate, gross profit, annual growth rate etc. Boost your pitch with our creative Assessing Impact Of Sales Risk Management With Kpi Dashboard Diagrams PDF. Deliver an awe inspiring pitch that will mesmerize everyone. Using these presentation templates you will surely catch everyones attention. You can browse the ppts collection on our website. We have researchers who are experts at creating the right content for the templates. So you do not have to invest time in any additional work. Just grab the template now and use them.

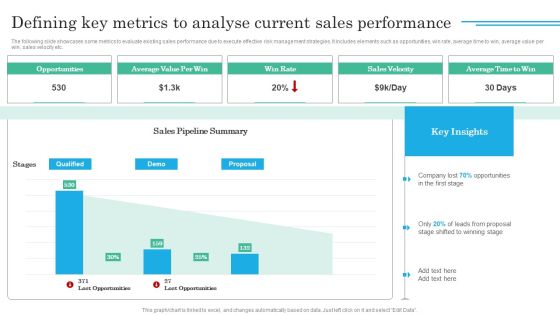
Defining Key Metrics To Analyse Current Sales Performance Background PDF
The following slide showcases some metrics to evaluate existing sales performance due to execute effective risk management strategies. It includes elements such as opportunities, win rate, average time to win, average value per win, sales velocity etc. Want to ace your presentation in front of a live audience Our Defining Key Metrics To Analyse Current Sales Performance Background PDF can help you do that by engaging all the users towards you. Slidegeeks experts have put their efforts and expertise into creating these impeccable powerpoint presentations so that you can communicate your ideas clearly. Moreover, all the templates are customizable, and easy to edit and downloadable. Use these for both personal and commercial use.

Evaluating Projected Vs Actual Sales Performance Microsoft PDF
The following slide depicts the evaluation of existing sales performance to set future standards and determine opportunities for improvement. It mainly includes key performance indicators KPIs such as pipeline, forecast, attainment, gap etc. Get a simple yet stunning designed Evaluating Projected Vs Actual Sales Performance Microsoft PDF. It is the best one to establish the tone in your meetings. It is an excellent way to make your presentations highly effective. So, download this PPT today from Slidegeeks and see the positive impacts. Our easy to edit Evaluating Projected Vs Actual Sales Performance Microsoft PDF can be your go to option for all upcoming conferences and meetings. So, what are you waiting for Grab this template today.

Impact Of Poor Risk Analysis On Sales Performance Information PDF
The following slide depicts the influence of inappropriate risk assessment on annual sales to review and control threats within the organization. It includes monthly sales amount along with key insights etc. Do you have an important presentation coming up Are you looking for something that will make your presentation stand out from the rest Look no further than Impact Of Poor Risk Analysis On Sales Performance Information PDF. With our professional designs, you can trust that your presentation will pop and make delivering it a smooth process. And with Slidegeeks, you can trust that your presentation will be unique and memorable. So why wait Grab Impact Of Poor Risk Analysis On Sales Performance Information PDF today and make your presentation stand out from the rest.

Challenges Faced By Team Due To High Sales Risks Ppt Styles PDF
The following slide highlights the major issues faced by organizations sales department in grabbing more deals. It mainly includes elements such as pipeline management, forecasting, adopting latest technology, budget constraints, training salesforce etc. Are you in need of a template that can accommodate all of your creative concepts This one is crafted professionally and can be altered to fit any style. Use it with Google Slides or PowerPoint. Include striking photographs, symbols, depictions, and other visuals. Fill, move around, or remove text boxes as desired. Test out color palettes and font mixtures. Edit and save your work, or work with colleagues. Download Challenges Faced By Team Due To High Sales Risks Ppt Styles PDF and observe how to make your presentation outstanding. Give an impeccable presentation to your group and make your presentation unforgettable.

Comparative Analysis Of Budgeted And Actual Sales Ppt File Clipart Images PDF
The following slide depicts the analysis of projected and actual sales performance post risk management to evaluate its success. It mainly includes revenue generated during 2021 and 2022 along with gross profit margin etc. Crafting an eye catching presentation has never been more straightforward. Let your presentation shine with this tasteful yet straightforward Comparative Analysis Of Budgeted And Actual Sales Ppt File Clipart Images PDF template. It offers a minimalistic and classy look that is great for making a statement. The colors have been employed intelligently to add a bit of playfulness while still remaining professional. Construct the ideal Comparative Analysis Of Budgeted And Actual Sales Ppt File Clipart Images PDF that effortlessly grabs the attention of your audience Begin now and be certain to wow your customers.

Major Factors Contributing Sales Risks Ppt Summary Themes PDF
The following slide depicts some key drivers that elevate sales risks to define its scope and impact. It mainly includes elements such as rapid technology evolution, market fluctuation, market competition, risk management strategies along with key insights etc. Formulating a presentation can take up a lot of effort and time, so the content and message should always be the primary focus. The visuals of the PowerPoint can enhance the presenters message, so our Major Factors Contributing Sales Risks Ppt Summary Themes PDF was created to help save time. Instead of worrying about the design, the presenter can concentrate on the message while our designers work on creating the ideal templates for whatever situation is needed. Slidegeeks has experts for everything from amazing designs to valuable content, we have put everything into Major Factors Contributing Sales Risks Ppt Summary Themes PDF.

Dashboard To Evaluate Display Advertising Source Conversion And Cost Ppt Styles Icon PDF
This slide provides a dashboard to assess the rate of conversion and cost of display advertising campaign by different sources. It includes source, average cost of marketing, conversion, click, revenue, impression by source. From laying roadmaps to briefing everything in detail, our templates are perfect for you. You can set the stage with your presentation slides. All you have to do is download these easy to edit and customizable templates. Dashboard To Evaluate Display Advertising Source Conversion And Cost Ppt Styles Icon PDF will help you deliver an outstanding performance that everyone would remember and praise you for. Do download this presentation today.

Dashboard To Measure Display Advertising Campaigns Performance Ppt Layouts Objects PDF
This slide showcases the functioning model of the programmatic RTB methodology. It include processes such as user visit, website communication with SSP, SSP communication with DSP and setting bid rates. Present like a pro with Dashboard To Measure Display Advertising Campaigns Performance Ppt Layouts Objects PDF Create beautiful presentations together with your team, using our easy to use presentation slides. Share your ideas in real time and make changes on the fly by downloading our templates. So whether you are in the office, on the go, or in a remote location, you can stay in sync with your team and present your ideas with confidence. With Slidegeeks presentation got a whole lot easier. Grab these presentations today.

Key Statistics Of Programmatic Display Advertising Ppt Show Clipart PDF
This slide covers the some of the major statistics of programmatic display advertising. It also provides the annual change in programmatic display advertising spending. Formulating a presentation can take up a lot of effort and time, so the content and message should always be the primary focus. The visuals of the PowerPoint can enhance the presenters message, so our Key Statistics Of Programmatic Display Advertising Ppt Show Clipart PDF was created to help save time. Instead of worrying about the design, the presenter can concentrate on the message while our designers work on creating the ideal templates for whatever situation is needed. Slidegeeks has experts for everything from amazing designs to valuable content, we have put everything into Key Statistics Of Programmatic Display Advertising Ppt Show Clipart PDF
Web Designing Icon Investor Funding Elevator Pitch Deck Financial Performance Slides PDF
Following slide provides information about business revenue generation on yearly basis. It includes revenue in USD and annual revenue. Coming up with a presentation necessitates that the majority of the effort goes into the content and the message you intend to convey. The visuals of a PowerPoint presentation can only be effective if it supplements and supports the story that is being told. Keeping this in mind our experts created Web Designing Icon Investor Funding Elevator Pitch Deck Financial Performance Slides PDF to reduce the time that goes into designing the presentation. This way, you can concentrate on the message while our designers take care of providing you with the right template for the situation.
Web Designing Icon Investor Funding Elevator Pitch Deck Financial Projection Clipart PDF
Following slide showcases anticipated business revenue growth for next 4 years. It includes revenue in USD and annual forecasted revenue. This modern and well arranged Web Designing Icon Investor Funding Elevator Pitch Deck Financial Projection Clipart PDF provides lots of creative possibilities. It is very simple to customize and edit with the Powerpoint Software. Just drag and drop your pictures into the shapes. All facets of this template can be edited with Powerpoint no extra software is necessary. Add your own material, put your images in the places assigned for them, adjust the colors, and then you can show your slides to the world, with an animated slide included.

YOY Change In Display Advertising Spending Trends Ppt File Shapes PDF
Mentioned slide provides overview of major facts and figures of affiliate marketing. It incorporate annual change in advertising spendings, average CPC of google and facebook, annual earning by google via display advertising. Boost your pitch with our creative YOY Change In Display Advertising Spending Trends Ppt File Shapes PDF. Deliver an awe-inspiring pitch that will mesmerize everyone. Using these presentation templates you will surely catch everyones attention. You can browse the ppts collection on our website. We have researchers who are experts at creating the right content for the templates. So you do not have to invest time in any additional work. Just grab the template now and use them.
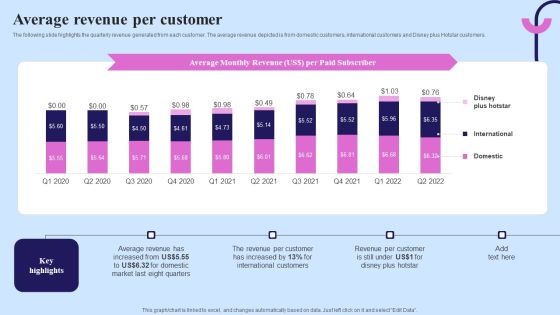
Video Streaming Technology Company Introduction Average Revenue Per Customer Template PDF
The following slide highlights the quarterly revenue generated from each customer. The average revenue depicted is from domestic customers, international customers and Disney plus Hotstar customers. Are you in need of a template that can accommodate all of your creative concepts This one is crafted professionally and can be altered to fit any style. Use it with Google Slides or PowerPoint. Include striking photographs, symbols, depictions, and other visuals. Fill, move around, or remove text boxes as desired. Test out color palettes and font mixtures. Edit and save your work, or work with colleagues. Download Video Streaming Technology Company Introduction Average Revenue Per Customer Template PDF and observe how to make your presentation outstanding. Give an impeccable presentation to your group and make your presentation unforgettable.
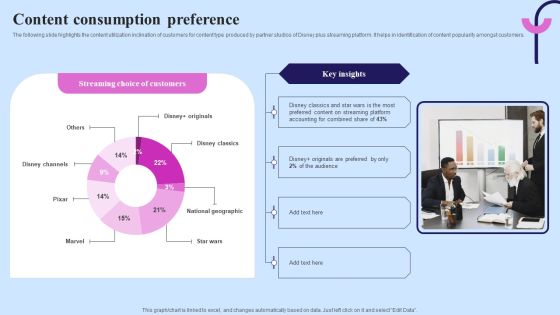
Video Streaming Technology Company Introduction Content Consumption Preference Microsoft PDF
The following slide highlights the content utilization inclination of customers for content type produced by partner studios of Disney plus streaming platform. It helps in identification of content popularity amongst customers. Make sure to capture your audiences attention in your business displays with our gratis customizable Video Streaming Technology Company Introduction Content Consumption Preference Microsoft PDF. These are great for business strategies, office conferences, capital raising or task suggestions. If you desire to acquire more customers for your tech business and ensure they stay satisfied, create your own sales presentation with these plain slides.
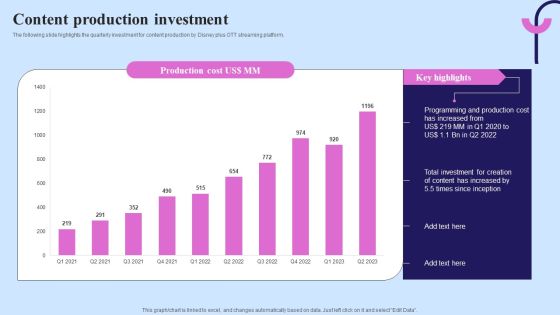
Video Streaming Technology Company Introduction Content Production Investment Themes PDF
The following slide highlights the quarterly investment for content production by Disney plus OTT streaming platform. Formulating a presentation can take up a lot of effort and time, so the content and message should always be the primary focus. The visuals of the PowerPoint can enhance the presenters message, so our Video Streaming Technology Company Introduction Content Production Investment Themes PDF was created to help save time. Instead of worrying about the design, the presenter can concentrate on the message while our designers work on creating the ideal templates for whatever situation is needed. Slidegeeks has experts for everything from amazing designs to valuable content, we have put everything into Video Streaming Technology Company Introduction Content Production Investment Themes PDF

Video Streaming Technology Company Introduction Cost And Price Structure Demonstration PDF
The following slide highlights the comparative pricing structure of top OTT streaming service platforms. It also depicts amount spend on content development by Netflix, Amazon Prime, Disney Plus and HBO Max. Coming up with a presentation necessitates that the majority of the effort goes into the content and the message you intend to convey. The visuals of a PowerPoint presentation can only be effective if it supplements and supports the story that is being told. Keeping this in mind our experts created Video Streaming Technology Company Introduction Cost And Price Structure Demonstration PDF to reduce the time that goes into designing the presentation. This way, you can concentrate on the message while our designers take care of providing you with the right template for the situation.
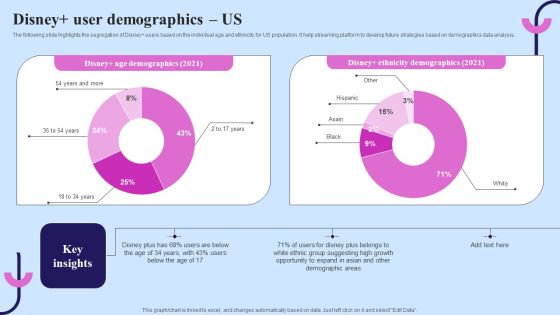
Video Streaming Technology Company Introduction Disney Plus User Demographics US Ideas PDF
The following slide highlights the segregation of Disney plus users based on the individual age and ethnicity for US population. It help streaming platform to develop future strategies based on demographics data analysis. This modern and well arranged Video Streaming Technology Company Introduction Disney Plus User Demographics US Ideas PDF provides lots of creative possibilities. It is very simple to customize and edit with the Powerpoint Software. Just drag and drop your pictures into the shapes. All facets of this template can be edited with Powerpoint no extra software is necessary. Add your own material, put your images in the places assigned for them, adjust the colors, and then you can show your slides to the world, with an animated slide included.

Video Streaming Technology Company Introduction Historical Revenue Topics PDF
The following slide highlights the revenue generated from Disney plus streaming services from its inception along with quarterly growth and key insights. This Video Streaming Technology Company Introduction Historical Revenue Topics PDF is perfect for any presentation, be it in front of clients or colleagues. It is a versatile and stylish solution for organizing your meetings. The Video Streaming Technology Company Introduction Historical Revenue Topics PDF features a modern design for your presentation meetings. The adjustable and customizable slides provide unlimited possibilities for acing up your presentation. Slidegeeks has done all the homework before launching the product for you. So, do not wait, grab the presentation templates today

Video Streaming Technology Company Introduction Paid Subscriber Base Introduction PDF
The following slide highlights the number of paid subscribers of Disney plus streaming services. It shows increase in the subscribers numbers in domestic and international market. The best PPT templates are a great way to save time, energy, and resources. Slidegeeks have 100 percent editable powerpoint slides making them incredibly versatile. With these quality presentation templates, you can create a captivating and memorable presentation by combining visually appealing slides and effectively communicating your message. Download Video Streaming Technology Company Introduction Paid Subscriber Base Introduction PDF from Slidegeeks and deliver a wonderful presentation.

Video Streaming Technology Company Introduction Subscription And SVOD Market Share Mockup PDF
The following slide highlights the market share of Disney plus in USA for subscription video on demand SVOD and total subscriptions for previous quarters. Retrieve professionally designed Video Streaming Technology Company Introduction Subscription And SVOD Market Share Mockup PDF to effectively convey your message and captivate your listeners. Save time by selecting pre made slideshows that are appropriate for various topics, from business to educational purposes. These themes come in many different styles, from creative to corporate, and all of them are easily adjustable and can be edited quickly. Access them as PowerPoint templates or as Google Slides themes. You do not have to go on a hunt for the perfect presentation because Slidegeeks got you covered from everywhere.

Video Streaming Technology Company Introduction Subscription Video On Demand Market Brochure PDF
The following slide highlights the global market share of top OTT platforms along with global subscribers in FY2021. The major OTT platforms includes netflix, amazon, disney plus and HBO max. Slidegeeks has constructed Video Streaming Technology Company Introduction Subscription Video On Demand Market Brochure PDF after conducting extensive research and examination. These presentation templates are constantly being generated and modified based on user preferences and critiques from editors. Here, you will find the most attractive templates for a range of purposes while taking into account ratings and remarks from users regarding the content. This is an excellent jumping off point to explore our content and will give new users an insight into our top notch PowerPoint Templates.
Projection Model Predictive Analytics Model Performance Tracking Dashboard Microsoft PDF
This slide represents the predictive analytics model performance tracking dashboard, and it covers the details of total visitors, total buyers, total products added to the cart, filters by date and category, visitors to clients conversion rate, and so on. Find a pre-designed and impeccable Projection Model Predictive Analytics Model Performance Tracking Dashboard Microsoft PDF. The templates can ace your presentation without additional effort. You can download these easy-to-edit presentation templates to make your presentation stand out from others. So, what are you waiting for Download the template from Slidegeeks today and give a unique touch to your presentation.
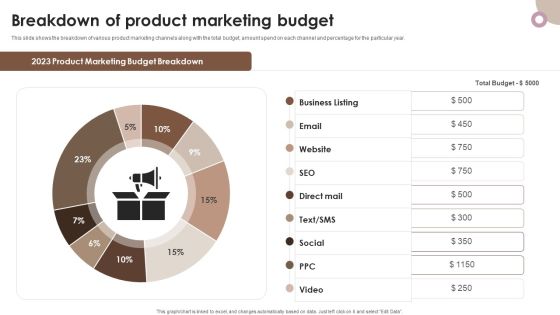
Strategic Components Of Product Advertising Breakdown Of Product Marketing Budget Introduction PDF
This slide shows the breakdown of various product marketing channels along with the total budget, amount spend on each channel and percentage for the particular year. Slidegeeks is one of the best resources for PowerPoint templates. You can download easily and regulate Strategic Components Of Product Advertising Breakdown Of Product Marketing Budget Introduction PDF for your personal presentations from our wonderful collection. A few clicks is all it takes to discover and get the most relevant and appropriate templates. Use our Templates to add a unique zing and appeal to your presentation and meetings. All the slides are easy to edit and you can use them even for advertisement purposes.

Strategic Components Of Product Advertising Product Marketing Dashboard With Sales Trend And Total Visits Information PDF
Explore a selection of the finest Strategic Components Of Product Advertising Product Marketing Dashboard With Sales Trend And Total Visits Information PDF here. With a plethora of professionally designed and pre made slide templates, you can quickly and easily find the right one for your upcoming presentation. You can use our Strategic Components Of Product Advertising Product Marketing Dashboard With Sales Trend And Total Visits Information PDF to effectively convey your message to a wider audience. Slidegeeks has done a lot of research before preparing these presentation templates. The content can be personalized and the slides are highly editable. Grab templates today from Slidegeeks.
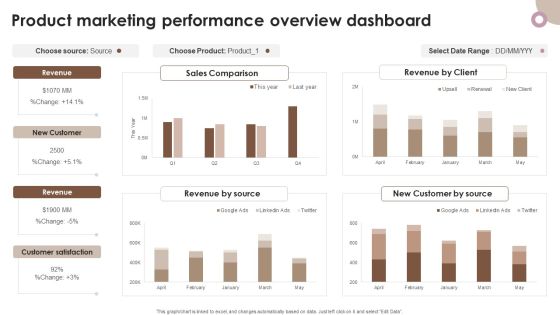
Strategic Components Of Product Advertising Product Marketing Performance Overview Dashboard Pictures PDF
The best PPT templates are a great way to save time, energy, and resources. Slidegeeks have 100 percent editable powerpoint slides making them incredibly versatile. With these quality presentation templates, you can create a captivating and memorable presentation by combining visually appealing slides and effectively communicating your message. Download Strategic Components Of Product Advertising Product Marketing Performance Overview Dashboard Pictures PDF from Slidegeeks and deliver a wonderful presentation.
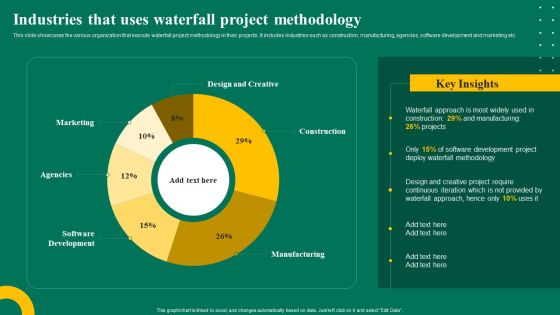
Industries That Uses Waterfall Project Methodology Ppt Layouts Graphic Tips PDF
This slide showcases the various organization that execute waterfall project methodology in their projects. It includes industries such as construction, manufacturing, agencies, software development and marketing etc. Get a simple yet stunning designed Industries That Uses Waterfall Project Methodology Ppt Layouts Graphic Tips PDF. It is the best one to establish the tone in your meetings. It is an excellent way to make your presentations highly effective. So, download this PPT today from Slidegeeks and see the positive impacts. Our easy to edit Industries That Uses Waterfall Project Methodology Ppt Layouts Graphic Tips PDF can be your go to option for all upcoming conferences and meetings. So, what are you waiting for Grab this template today.

Success Rate Of Waterfall And Agile Project Management Approach Ppt Inspiration Backgrounds PDF
This slide showcases the success rate of waterfall and agile methodology for project management. It presents the project success, failure and challenged percentage in waterfall and agile model approach. Find highly impressive Success Rate Of Waterfall And Agile Project Management Approach Ppt Inspiration Backgrounds PDF on Slidegeeks to deliver a meaningful presentation. You can save an ample amount of time using these presentation templates. No need to worry to prepare everything from scratch because Slidegeeks experts have already done a huge research and work for you. You need to download Success Rate Of Waterfall And Agile Project Management Approach Ppt Inspiration Backgrounds PDF for your upcoming presentation. All the presentation templates are 100 percent editable and you can change the color and personalize the content accordingly. Download now.

Waterfall And Agile Model Failure Rate By Project Size Ppt Pictures Gallery PDF
This slide showcases the rate of failure of waterfall and agile model approach in project management by its size. It compares waterfall and agile model in small, medium and large project size. Make sure to capture your audiences attention in your business displays with our gratis customizable Waterfall And Agile Model Failure Rate By Project Size Ppt Pictures Gallery PDF. These are great for business strategies, office conferences, capital raising or task suggestions. If you desire to acquire more customers for your tech business and ensure they stay satisfied, create your own sales presentation with these plain slides.

Data Driven Marketing Solutions Firm Company Profile Balance Sheet And Cash Flow Guidelines PDF
The slide showcases the balance sheet and cash flow statement of last six years to represent the current financial position of the organization. Boost your pitch with our creative Data Driven Marketing Solutions Firm Company Profile Balance Sheet And Cash Flow Guidelines PDF. Deliver an awe-inspiring pitch that will mesmerize everyone. Using these presentation templates you will surely catch everyones attention. You can browse the ppts collection on our website. We have researchers who are experts at creating the right content for the templates. So you do not have to invest time in any additional work. Just grab the template now and use them.

Data Driven Marketing Solutions Firm Company Profile Gross Profit And Margin Information PDF
The following slide highlights the yearly gross profit from 2017 to 2023. it illustrates the changes in profit and margin along with the reasons for the increase or decrease Make sure to capture your audiences attention in your business displays with our gratis customizable Data Driven Marketing Solutions Firm Company Profile Gross Profit And Margin Information PDF. These are great for business strategies, office conferences, capital raising or task suggestions. If you desire to acquire more customers for your tech business and ensure they stay satisfied, create your own sales presentation with these plain slides.

Data Driven Marketing Solutions Firm Company Profile Historical Revenue Professional PDF
The following slide highlights the historical revenue of Pureprofile from all of its operations. It also describes revenue CAGR and revenue growth over a time period of 6 years Formulating a presentation can take up a lot of effort and time, so the content and message should always be the primary focus. The visuals of the PowerPoint can enhance the presenters message, so our Data Driven Marketing Solutions Firm Company Profile Historical Revenue Professional PDF was created to help save time. Instead of worrying about the design, the presenter can concentrate on the message while our designers work on creating the ideal templates for whatever situation is needed. Slidegeeks has experts for everything from amazing designs to valuable content, we have put everything into Data Driven Marketing Solutions Firm Company Profile Historical Revenue Professional PDF

Data Driven Marketing Solutions Firm Company Profile Net Income And Profit Margin Portrait PDF
The following slide highlights the companys net income and profit margin from all operations. It shows net income data from 2018 to 2023 to showcase growth in income Explore a selection of the finest Data Driven Marketing Solutions Firm Company Profile Net Income And Profit Margin Portrait PDF here. With a plethora of professionally designed and pre made slide templates, you can quickly and easily find the right one for your upcoming presentation. You can use our Data Driven Marketing Solutions Firm Company Profile Net Income And Profit Margin Portrait PDF to effectively convey your message to a wider audience. Slidegeeks has done a lot of research before preparing these presentation templates. The content can be personalized and the slides are highly editable. Grab templates today from Slidegeeks.

Data Driven Marketing Solutions Firm Company Profile Operating Expense Background PDF
The following slide showcases the yearly expense incurred by the organization for running the business. It shows the change in expenses from 2019 to 2023 The best PPT templates are a great way to save time, energy, and resources. Slidegeeks have 100 percent editable powerpoint slides making them incredibly versatile. With these quality presentation templates, you can create a captivating and memorable presentation by combining visually appealing slides and effectively communicating your message. Download Data Driven Marketing Solutions Firm Company Profile Operating Expense Background PDF from Slidegeeks and deliver a wonderful presentation.

Data Driven Marketing Solutions Firm Company Profile Operating Profit And Margin Topics PDF
The following slide highlights the profit and margin from business operations for a time period of 6 years. It also provides key insights for the operating income data The Data Driven Marketing Solutions Firm Company Profile Operating Profit And Margin Topics PDF is a compilation of the most recent design trends as a series of slides. It is suitable for any subject or industry presentation, containing attractive visuals and photo spots for businesses to clearly express their messages. This template contains a variety of slides for the user to input data, such as structures to contrast two elements, bullet points, and slides for written information. Slidegeeks is prepared to create an impression.

Data Driven Marketing Solutions Firm Company Profile Our Employees Portrait PDF
The following slide depicts the employees working in Pureprofile. It shows total employee count, employee retention, employee consideration and employee satisfaction score Slidegeeks has constructed Data Driven Marketing Solutions Firm Company Profile Our Employees Portrait PDF after conducting extensive research and examination. These presentation templates are constantly being generated and modified based on user preferences and critiques from editors. Here, you will find the most attractive templates for a range of purposes while taking into account ratings and remarks from users regarding the content. This is an excellent jumping off point to explore our content and will give new users an insight into our top notch PowerPoint Templates.

Data Driven Marketing Solutions Firm Company Profile Website Visitors Data Guidelines PDF
The following slide highlights the companys audience demographics distribution based on people age and gender to make business strategy for target market Slidegeeks is one of the best resources for PowerPoint templates. You can download easily and regulate Data Driven Marketing Solutions Firm Company Profile Website Visitors Data Guidelines PDF for your personal presentations from our wonderful collection. A few clicks is all it takes to discover and get the most relevant and appropriate templates. Use our Templates to add a unique zing and appeal to your presentation and meetings. All the slides are easy to edit and you can use them even for advertisement purposes.

Coca Cola Brand Portfolio Strategy Brands Revenue Contribution Analysis Elements PDF
This slide covers a graphical representation of coca- colas revenue contribution from the smallest 200 brands and the biggest 200 brands. It also includes key insights such as brand portfolio strategy key focus, etc. Find a pre designed and impeccable Coca Cola Brand Portfolio Strategy Brands Revenue Contribution Analysis Elements PDF. The templates can ace your presentation without additional effort. You can download these easy to edit presentation templates to make your presentation stand out from others. So, what are you waiting for Download the template from Slidegeeks today and give a unique touch to your presentation.

Comprehensive Guide To Manage Brand Portfolio Introduction To Coca Colas Brand Portfolio Inspiration PDF
This slide covers an introduction to coca colas brand portfolio and its management strategy. It also includes a graphical representation of coca cola brand portfolio and key insights such as streamlining the brand portfolio helped to identify opportunities and better investment allocation. Want to ace your presentation in front of a live audience Our Comprehensive Guide To Manage Brand Portfolio Introduction To Coca Colas Brand Portfolio Inspiration PDF can help you do that by engaging all the users towards you. Slidegeeks experts have put their efforts and expertise into creating these impeccable powerpoint presentations so that you can communicate your ideas clearly. Moreover, all the templates are customizable, and easy to edit and downloadable. Use these for both personal and commercial use.
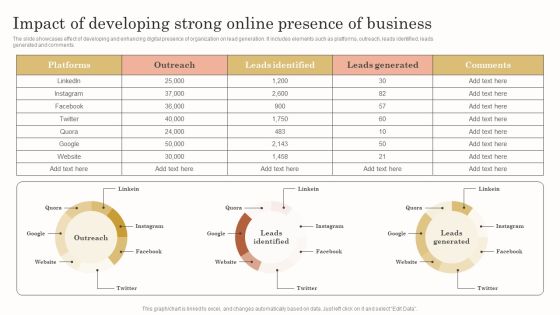
Impact Of Developing Strong Online Presence Of Business Background PDF
The slide showcases effect of developing and enhancing digital presence of organization on lead generation. It includes elements such as platforms, outreach, leads identified, leads generated and comments. Are you in need of a template that can accommodate all of your creative concepts This one is crafted professionally and can be altered to fit any style. Use it with Google Slides or PowerPoint. Include striking photographs, symbols, depictions, and other visuals. Fill, move around, or remove text boxes as desired. Test out color palettes and font mixtures. Edit and save your work, or work with colleagues. Download Impact Of Developing Strong Online Presence Of Business Background PDF and observe how to make your presentation outstanding. Give an impeccable presentation to your group and make your presentation unforgettable.

Impact Of Improving Sales Process On Business Microsoft PDF
The following slide exhibits impact analysis of improving sales tools, techniques, procedures and channels on business. It provides information about product sales, business profits and customer churn rate. Crafting an eye catching presentation has never been more straightforward. Let your presentation shine with this tasteful yet straightforward Impact Of Improving Sales Process On Business Microsoft PDF template. It offers a minimalistic and classy look that is great for making a statement. The colors have been employed intelligently to add a bit of playfulness while still remaining professional. Construct the ideal Impact Of Improving Sales Process On Business Microsoft PDF that effortlessly grabs the attention of your audience Begin now and be certain to wow your customers.
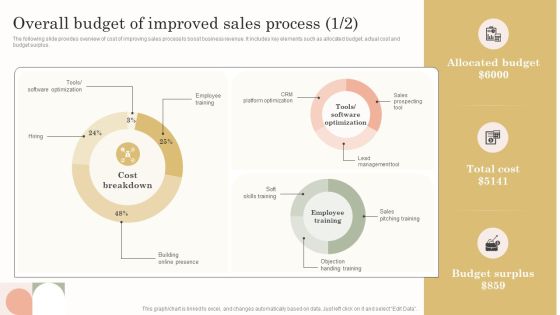
Overall Budget Of Improved Sales Process Sample PDF
The following slide provides overview of cost of improving sales process to boost business revenue. It includes key elements such as allocated budget, actual cost and budget surplus. Formulating a presentation can take up a lot of effort and time, so the content and message should always be the primary focus. The visuals of the PowerPoint can enhance the presenters message, so our Overall Budget Of Improved Sales Process Sample PDF was created to help save time. Instead of worrying about the design, the presenter can concentrate on the message while our designers work on creating the ideal templates for whatever situation is needed. Slidegeeks has experts for everything from amazing designs to valuable content, we have put everything into Overall Budget Of Improved Sales Process Sample PDF.
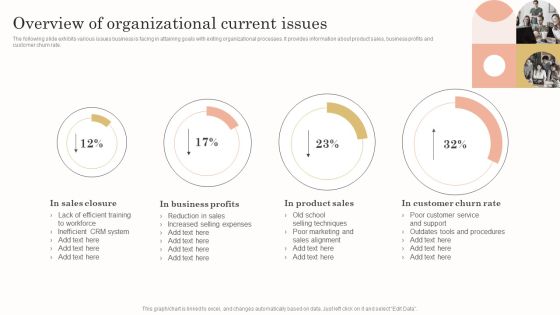
Overview Of Organizational Current Issues Diagrams PDF
The following slide exhibits various issues business is facing in attaining goals with exiting organizational processes. It provides information about product sales, business profits and customer churn rate. Coming up with a presentation necessitates that the majority of the effort goes into the content and the message you intend to convey. The visuals of a PowerPoint presentation can only be effective if it supplements and supports the story that is being told. Keeping this in mind our experts created Overview Of Organizational Current Issues Diagrams PDF to reduce the time that goes into designing the presentation. This way, you can concentrate on the message while our designers take care of providing you with the right template for the situation.
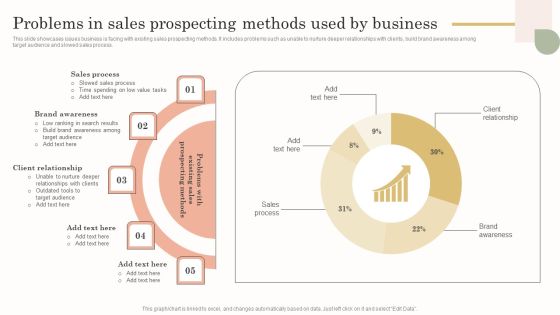
Problems In Sales Prospecting Methods Used By Business Ideas PDF
This slide showcases issues business is facing with existing sales prospecting methods. It includes problems such as unable to nurture deeper relationships with clients, build brand awareness among target audience and slowed sales process. This modern and well arranged Problems In Sales Prospecting Methods Used By Business Ideas PDF provides lots of creative possibilities. It is very simple to customize and edit with the Powerpoint Software. Just drag and drop your pictures into the shapes. All facets of this template can be edited with Powerpoint no extra software is necessary. Add your own material, put your images in the places assigned for them, adjust the colors, and then you can show your slides to the world, with an animated slide included.
Social Media Performance Tracking And Monitoring Dashboard Mockup PDF
The following slide showcases a dashboard to track and measure social media platforms performance. It includes key elements such as website traffic, social media referral rate, site revenue, social media site revenue, etc. This Social Media Performance Tracking And Monitoring Dashboard Mockup PDF is perfect for any presentation, be it in front of clients or colleagues. It is a versatile and stylish solution for organizing your meetings. The product features a modern design for your presentation meetings. The adjustable and customizable slides provide unlimited possibilities for acing up your presentation. Slidegeeks has done all the homework before launching the product for you. So, do not wait, grab the presentation templates today
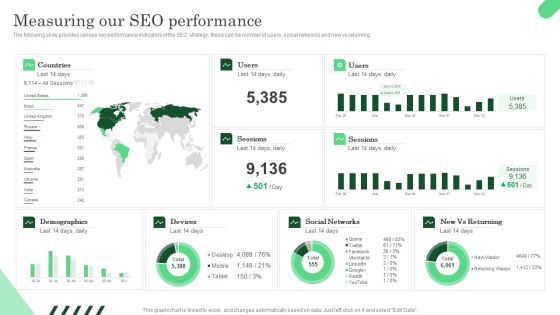
Measuring Our SEO Performance Ppt PowerPoint Presentation File Gallery PDF
The following slide provides various key performance indicators of the SEO strategy, these can be number of users, social networks and new vs returning. This Measuring Our SEO Performance Ppt PowerPoint Presentation File Gallery PDF is perfect for any presentation, be it in front of clients or colleagues. It is a versatile and stylish solution for organizing your meetings. The Measuring Our SEO Performance Ppt PowerPoint Presentation File Gallery PDF features a modern design for your presentation meetings. The adjustable and customizable slides provide unlimited possibilities for acing up your presentation. Slidegeeks has done all the homework before launching the product for you. So, do not wait, grab the presentation templates today

Our E Mail Marketing Campaign Performance Ppt PowerPoint Presentation File Gallery PDF
The following slide provides an overview of multiple key metrics that can be uses by the organization to track performance of the e-mail marketing campaign. these metrics can be - open rates, click through rates etc. The Our E Mail Marketing Campaign Performance Ppt PowerPoint Presentation File Gallery PDF is a compilation of the most recent design trends as a series of slides. It is suitable for any subject or industry presentation, containing attractive visuals and photo spots for businesses to clearly express their messages. This template contains a variety of slides for the user to input data, such as structures to contrast two elements, bullet points, and slides for written information. Slidegeeks is prepared to create an impression.
SEO Tracking Dashboard For Backlinks And Keywords Ppt PowerPoint Presentation File Outline PDF
Purpose of the following slide is to measure the SEO performance of the organization as it measures the keywords, backlinks, the total number of sessions and average call duration. This SEO Tracking Dashboard For Backlinks And Keywords Ppt PowerPoint Presentation File Outline PDF from Slidegeeks makes it easy to present information on your topic with precision. It provides customization options, so you can make changes to the colors, design, graphics, or any other component to create a unique layout. It is also available for immediate download, so you can begin using it right away. Slidegeeks has done good research to ensure that you have everything you need to make your presentation stand out. Make a name out there for a brilliant performance.

Analyze Employee Engagement Survey Results Post Strategy Implementation Introduction PDF
The following slide displays the expected results of employee engagement survey results post successful strategy execution. It includes rating scale, parameters such as motivation, healthy relations, appreciation at workplace etc. Find a pre designed and impeccable Analyze Employee Engagement Survey Results Post Strategy Implementation Introduction PDF. The templates can ace your presentation without additional effort. You can download these easy to edit presentation templates to make your presentation stand out from others. So, what are you waiting for Download the template from Slidegeeks today and give a unique touch to your presentation.

Analyzing And Improving Staff Work Satisfaction Evaluate Employee Engagement Survey Results Pictures PDF
The following slide depicts the outcomes of employee engagement questionnaire to analyze and formulate strategies for improvement. It includes data related to actively disengaged, not engaged, engaged employees along with key takeaways etc. From laying roadmaps to briefing everything in detail, our templates are perfect for you. You can set the stage with your presentation slides. All you have to do is download these easy to edit and customizable templates. Analyzing And Improving Staff Work Satisfaction Evaluate Employee Engagement Survey Results Pictures PDF will help you deliver an outstanding performance that everyone would remember and praise you for. Do download this presentation today.

Analysing Employee Engagement Survey Questionnaire Ppt Pictures Outline PDF
The following slide depicts the key results of employee engagement survey to evaluate staff connection with their organization. It includes elements such as employees are motivated to meet their targets, healthy relations with colleagues, appreciates work culture etc. Here you can discover an assortment of the finest PowerPoint and Google Slides templates. With these templates, you can create presentations for a variety of purposes while simultaneously providing your audience with an eye catching visual experience. Download Analysing Employee Engagement Survey Questionnaire Ppt Pictures Outline PDF to deliver an impeccable presentation. These templates will make your job of preparing presentations much quicker, yet still, maintain a high level of quality. Slidegeeks has experienced researchers who prepare these templates and write high quality content for you. Later on, you can personalize the content by editing the Analysing Employee Engagement Survey Questionnaire Ppt Pictures Outline PDF.

Analyze Corporate Training Effectiveness With KPI Dashboard Ppt Visual Aids Backgrounds PDF
The following slide showcases outcomes of conducting corporate trainings to measure its effectiveness. It includes elements such as absence rate, cost, productivity rate, engagement index, satisfaction rate, acceptance ratio etc. This Analyze Corporate Training Effectiveness With KPI Dashboard Ppt Visual Aids Backgrounds PDF from Slidegeeks makes it easy to present information on your topic with precision. It provides customization options, so you can make changes to the colors, design, graphics, or any other component to create a unique layout. It is also available for immediate download, so you can begin using it right away. Slidegeeks has done good research to ensure that you have everything you need to make your presentation stand out. Make a name out there for a brilliant performance.

Employee Engagement And Satisfaction Kpi Dashboard Ppt Model Layouts PDF
The following slide showcases employee engagement and satisfaction key performance indicators to encourage healthy team relationships. It includes key elements such as net promotor score, retention and absenteeism rate etc. Do you know about Slidesgeeks Employee Engagement And Satisfaction Kpi Dashboard Ppt Model Layouts PDF These are perfect for delivering any kind od presentation. Using it, create PowerPoint presentations that communicate your ideas and engage audiences. Save time and effort by using our pre designed presentation templates that are perfect for a wide range of topic. Our vast selection of designs covers a range of styles, from creative to business, and are all highly customizable and easy to edit. Download as a PowerPoint template or use them as Google Slides themes.
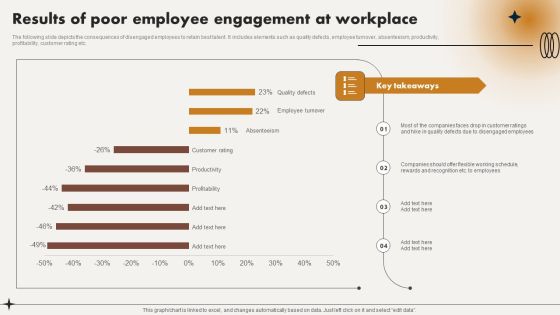
Results Of Poor Employee Engagement At Workplace Ppt File Demonstration PDF
The following slide depicts the consequences of disengaged employees to retain best talent. It includes elements such as quality defects, employee turnover, absenteeism, productivity, profitability, customer rating etc. Get a simple yet stunning designed Results Of Poor Employee Engagement At Workplace Ppt File Demonstration PDF. It is the best one to establish the tone in your meetings. It is an excellent way to make your presentations highly effective. So, download this PPT today from Slidegeeks and see the positive impacts. Our easy to edit Results Of Poor Employee Engagement At Workplace Ppt File Demonstration PDF can be your go to option for all upcoming conferences and meetings. So, what are you waiting for Grab this template today.

Review Yearly Employee Engagement Score With Kpi Dashboard Ppt Pictures Design Ideas PDF
The following slide showcases annual employee engagement scores to measure employee activeness. It includes elements such as response rate, net promotor score, monthly engagement rate, number of responses, teams, accuracy etc. From laying roadmaps to briefing everything in detail, our templates are perfect for you. You can set the stage with your presentation slides. All you have to do is download these easy to edit and customizable templates. Review Yearly Employee Engagement Score With Kpi Dashboard Ppt Pictures Design Ideas PDF will help you deliver an outstanding performance that everyone would remember and praise you for. Do download this presentation today.

Assessing Impact Of Sales Risk Management With KPI Dashboard Guidelines PDF
The following slide highlights some key performance indicators KPIs to measure the influence of executing sales risk management strategies on revenue performance. It includes elements such as target attainment rate, gross profit, annual growth rate etc. Presenting this PowerPoint presentation, titled Assessing Impact Of Sales Risk Management With KPI Dashboard Guidelines PDF, with topics curated by our researchers after extensive research. This editable presentation is available for immediate download and provides attractive features when used. Download now and captivate your audience. Presenting this Assessing Impact Of Sales Risk Management With KPI Dashboard Guidelines PDF. Our researchers have carefully researched and created these slides with all aspects taken into consideration. This is a completely customizable Assessing Impact Of Sales Risk Management With KPI Dashboard Guidelines PDF that is available for immediate downloading. Download now and make an impact on your audience. Highlight the attractive features available with our PPTs.

Brand Awareness Metrics Sentiment Analysis Opinion Mining Template PDF
This slide provides information regarding sentiment analysis or opinion mining as brand awareness metrics. It helps in identifying key influencer across social network. The slide also include key initiatives to manage sentiment analysis. Boost your pitch with our creative Brand Awareness Metrics Sentiment Analysis Opinion Mining Template PDF. Deliver an awe inspiring pitch that will mesmerize everyone. Using these presentation templates you will surely catch everyones attention. You can browse the ppts collection on our website. We have researchers who are experts at creating the right content for the templates. So you do not have to invest time in any additional work. Just grab the template now and use them.

Brand Awareness Metrics Social Or Non Social Media Reach Clipart PDF
This slide provides information regarding social or non-social media reach as brand awareness metrics. It helps in assessing brand awareness and recall. The slide also include key initiatives to enhance brand reach. Create an editable Brand Awareness Metrics Social Or Non Social Media Reach Clipart PDF that communicates your idea and engages your audience. Whether you are presenting a business or an educational presentation, pre designed presentation templates help save time. Brand Awareness Metrics Social Or Non Social Media Reach Clipart PDF is highly customizable and very easy to edit, covering many different styles from creative to business presentations. Slidegeeks has creative team members who have crafted amazing templates. So, go and get them without any delay.

Brand Awareness Activities Tracking Dashboard Ppt Layout PDF
This slide provides information regarding brand activities tracking dashboard in terms of site traffic, attention, search, brand mentions, inbound traffic, etc. Presenting this PowerPoint presentation, titled Brand Awareness Activities Tracking Dashboard Ppt Layout PDF, with topics curated by our researchers after extensive research. This editable presentation is available for immediate download and provides attractive features when used. Download now and captivate your audience. Presenting this Brand Awareness Activities Tracking Dashboard Ppt Layout PDF. Our researchers have carefully researched and created these slides with all aspects taken into consideration. This is a completely customizable Brand Awareness Activities Tracking Dashboard Ppt Layout PDF that is available for immediate downloading. Download now and make an impact on your audience. Highlight the attractive features available with our PPTs.

Brand Awareness Metrics Share Of Voice Ppt Infographics Show PDF
This slide provides information regarding share of voice as brand awareness metrics. It helps in determining online discussion initiated by specific public profile. The slide also include key initiatives to boost share of voice on social media. Here you can discover an assortment of the finest PowerPoint and Google Slides templates. With these templates, you can create presentations for a variety of purposes while simultaneously providing your audience with an eye catching visual experience. Download Brand Awareness Metrics Share Of Voice Ppt Infographics Show PDF to deliver an impeccable presentation. These templates will make your job of preparing presentations much quicker, yet still, maintain a high level of quality. Slidegeeks has experienced researchers who prepare these templates and write high quality content for you. Later on, you can personalize the content by editing the Brand Awareness Metrics Share Of Voice Ppt Infographics Show PDF.

Brand Awareness Metrics Volume Of Social Mentions Ppt Gallery Maker PDF
This slide provides information regarding volume of social or brand mentions as brand awareness metrics. It helps in assessing the frequency of brand name mentioned across online platforms. It also include ways to increase volume of mentions. This Brand Awareness Metrics Volume Of Social Mentions Ppt Gallery Maker PDF from Slidegeeks makes it easy to present information on your topic with precision. It provides customization options, so you can make changes to the colors, design, graphics, or any other component to create a unique layout. It is also available for immediate download, so you can begin using it right away. Slidegeeks has done good research to ensure that you have everything you need to make your presentation stand out. Make a name out there for a brilliant performance.
Different Brands Performance Tracking Dashboard Ppt Gallery Infographics PDF
This slide provides information regarding different brands performance tracking dashboard in terms of brand metric, brand commitment, advertising metrics, and purchase metrics. Take your projects to the next level with our ultimate collection of Different Brands Performance Tracking Dashboard Ppt Gallery Infographics PDF. Slidegeeks has designed a range of layouts that are perfect for representing task or activity duration, keeping track of all your deadlines at a glance. Tailor these designs to your exact needs and give them a truly corporate look with your own brand colors they will make your projects stand out from the rest.

How Overall Brand Reputation Can Be Improved Ppt Styles Elements PDF
This slide provides information regarding overall brand reputation improvement by highlighting its rile in consumer loyalty, initiatives to manage brand reputation and statistics associated with it. Do you know about Slidesgeeks How Overall Brand Reputation Can Be Improved Ppt Styles Elements PDF These are perfect for delivering any kind od presentation. Using it, create PowerPoint presentations that communicate your ideas and engage audiences. Save time and effort by using our pre designed presentation templates that are perfect for a wide range of topic. Our vast selection of designs covers a range of styles, from creative to business, and are all highly customizable and easy to edit. Download as a PowerPoint template or use them as Google Slides themes.

Adopting Multiple Tactics To Improve Inventory Optimization Dashboard To Manage Inventory And Warehouse Operations Guidelines PDF
This showcases dashboard that can help organization to manage warehouse operations and reduce unnecessary expenses. Its other key elements are inventory carrying cost, inventory days of supply and product stock details. Crafting an eye catching presentation has never been more straightforward. Let your presentation shine with this tasteful yet straightforward Adopting Multiple Tactics To Improve Inventory Optimization Dashboard To Manage Inventory And Warehouse Operations Guidelines PDF template. It offers a minimalistic and classy look that is great for making a statement. The colors have been employed intelligently to add a bit of playfulness while still remaining professional. Construct the ideal Adopting Multiple Tactics To Improve Inventory Optimization Dashboard To Manage Inventory And Warehouse Operations Guidelines PDF that effortlessly grabs the attention of your audience. Begin now and be certain to wow your customers.

Adopting Multiple Tactics To Improve Inventory Optimization Evaluating Increase In Warehouse Indirect And Direct Cost Background PDF
This slide showcases graph that can help organization in analyzing the rise of warehouse costs. It also shows reasons for increase in warheouse costs that are rise in inventory wastage and delay in order fulfillment. Make sure to capture your audiences attention in your business displays with our gratis customizable Adopting Multiple Tactics To Improve Inventory Optimization Evaluating Increase In Warehouse Indirect And Direct Cost Background PDF. These are great for business strategies, office conferences, capital raising or task suggestions. If you desire to acquire more customers for your tech business and ensure they stay satisfied, create your own sales presentation with these plain slides.

Adopting Multiple Tactics To Improve Inventory Optimization Managing Stock In Warehouse With Abc Analysis Method Brochure PDF
This modern and well arranged Adopting Multiple Tactics To Improve Inventory Optimization Managing Stock In Warehouse With Abc Analysis Method Brochure PDF provides lots of creative possibilities. It is very simple to customize and edit with the Powerpoint Software. Just drag and drop your pictures into the shapes. All facets of this template can be edited with Powerpoint no extra software is necessary. Add your own material, put your images in the places assigned for them, adjust the colors, and then you can show your slides to the world, with an animated slide included.

Adopting Multiple Tactics To Improve Inventory Optimization Dashboard To Track Warehouse Shipments And Operating Cost Template PDF
This slide showcases dashboard that can help organization to track operating cost incurred by organization in different warehousing activities. Its other key elements are - perfect order rate, total shipments by country and on time shipments. Presenting this PowerPoint presentation, titled Adopting Multiple Tactics To Improve Inventory Optimization Dashboard To Track Warehouse Shipments And Operating Cost Template PDF, with topics curated by our researchers after extensive research. This editable presentation is available for immediate download and provides attractive features when used. Download now and captivate your audience. Presenting this Adopting Multiple Tactics To Improve Inventory Optimization Dashboard To Track Warehouse Shipments And Operating Cost Template PDF. Our researchers have carefully researched and created these slides with all aspects taken into consideration. This is a completely customizable Adopting Multiple Tactics To Improve Inventory Optimization Dashboard To Track Warehouse Shipments And Operating Cost Template PDF that is available for immediate downloading. Download now and make an impact on your audience. Highlight the attractive features available with our PPTs.

Adopting Multiple Tactics To Improve Inventory Optimization Hml Analysis For Inventory Management In Warehouse Brochure PDF
This slide showcases HML analysis method that can help organization in inventory management. It categorized inventory into high, medium and low priced items which can help to determine the verification frequency of different type of stock categories. Here you can discover an assortment of the finest PowerPoint and Google Slides templates. With these templates, you can create presentations for a variety of purposes while simultaneously providing your audience with an eye catching visual experience. Download Adopting Multiple Tactics To Improve Inventory Optimization Hml Analysis For Inventory Management In Warehouse Brochure PDF to deliver an impeccable presentation. These templates will make your job of preparing presentations much quicker, yet still, maintain a high level of quality. Slidegeeks has experienced researchers who prepare these templates and write high quality content for you. Later on, you can personalize the content by editing the Adopting Multiple Tactics To Improve Inventory Optimization Hml Analysis For Inventory Management In Warehouse Brochure PDF.

Implementing Sales Volatility Management Techniques Assessing Impact Of Sales Risk Management Topics PDF
The following slide highlights some key performance indicators KPIs to measure the influence of executing sales risk management strategies on revenue performance. It includes elements such as target attainment rate, gross profit, annual growth rate etc. Find a pre designed and impeccable Implementing Sales Volatility Management Techniques Assessing Impact Of Sales Risk Management Topics PDF. The templates can ace your presentation without additional effort. You can download these easy to edit presentation templates to make your presentation stand out from others. So, what are you waiting for Download the template from Slidegeeks today and give a unique touch to your presentation.

Implementing Sales Volatility Management Techniques Comparative Analysis Of Budgeted And Actual Sales Formats PDF
The following slide depicts the analysis of projected and actual sales performance post risk management to evaluate its success. It mainly includes revenue generated during 2021 and 2022 along with gross profit margin etc. Create an editable Implementing Sales Volatility Management Techniques Comparative Analysis Of Budgeted And Actual Sales Formats PDF that communicates your idea and engages your audience. Whether youre presenting a business or an educational presentation, pre designed presentation templates help save time. Implementing Sales Volatility Management Techniques Comparative Analysis Of Budgeted And Actual Sales Formats PDF is highly customizable and very easy to edit, covering many different styles from creative to business presentations. Slidegeeks has creative team members who have crafted amazing templates. So, go and get them without any delay.
Implementing Sales Volatility Management Techniques Defining Key Metrics To Analyse Current Sales Ideas PDF
The following slide showcases some metrics to evaluate existing sales performance due to execute effective risk management strategies. It includes elements such as opportunities, win rate, average time to win, average value per win, sales velocity etc. Want to ace your presentation in front of a live audience Our Implementing Sales Volatility Management Techniques Defining Key Metrics To Analyse Current Sales Ideas PDF can help you do that by engaging all the users towards you. Slidegeeks experts have put their efforts and expertise into creating these impeccable powerpoint presentations so that you can communicate your ideas clearly. Moreover, all the templates are customizable, and easy to edit and downloadable. Use these for both personal and commercial use.

Implementing Sales Volatility Management Techniques Impact Of Poor Risk Analysis On Sales Summary PDF
The following slide depicts the influence of inappropriate risk assessment on annual sales to review and control threats within the organization. It includes monthly sales amount along with key insights etc. Slidegeeks is here to make your presentations a breeze with Implementing Sales Volatility Management Techniques Impact Of Poor Risk Analysis On Sales Summary PDF With our easy to use and customizable templates, you can focus on delivering your ideas rather than worrying about formatting. With a variety of designs to choose from, you are sure to find one that suits your needs. And with animations and unique photos, illustrations, and fonts, you can make your presentation pop. So whether you are giving a sales pitch or presenting to the board, make sure to check out Slidegeeks first.

Implementing Sales Volatility Management Techniques Key Metrics To Assess Effectiveness Of Sales Designs PDF
The following slide highlights some key performance indicators to measure the effectiveness of sales risk evaluation on revenue performance. It includes elements such as opportunities, win rate, average time to win, sales velocity along with key insights etc. Do you have an important presentation coming up Are you looking for something that will make your presentation stand out from the rest Look no further than Implementing Sales Volatility Management Techniques Key Metrics To Assess Effectiveness Of Sales Designs PDF. With our professional designs, you can trust that your presentation will pop and make delivering it a smooth process. And with Slidegeeks, you can trust that your presentation will be unique and memorable. So why wait Grab Implementing Sales Volatility Management Techniques Key Metrics To Assess Effectiveness Of Sales Designs PDF today and make your presentation stand out from the rest.
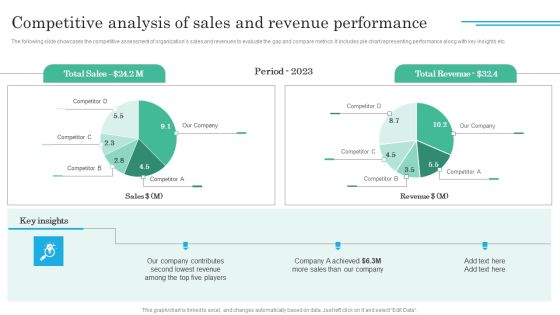
Implementing Sales Volatility Management Techniques Competitive Analysis Of Sales And Revenue Rules PDF
Are you in need of a template that can accommodate all of your creative concepts This one is crafted professionally and can be altered to fit any style. Use it with Google Slides or PowerPoint. Include striking photographs, symbols, depictions, and other visuals. Fill, move around, or remove text boxes as desired. Test out color palettes and font mixtures. Edit and save your work, or work with colleagues. Download Implementing Sales Volatility Management Techniques Competitive Analysis Of Sales And Revenue Rules PDF and observe how to make your presentation outstanding. Give an impeccable presentation to your group and make your presentation unforgettable.

Implementing Sales Volatility Management Techniques Evaluating Projected Vs Actual Sales Performance Structure PDF
Crafting an eye catching presentation has never been more straightforward. Let your presentation shine with this tasteful yet straightforward Implementing Sales Volatility Management Techniques Evaluating Projected Vs Actual Sales Performance Structure PDF template. It offers a minimalistic and classy look that is great for making a statement. The colors have been employed intelligently to add a bit of playfulness while still remaining professional. Construct the ideal Implementing Sales Volatility Management Techniques Evaluating Projected Vs Actual Sales Performance Structure PDF that effortlessly grabs the attention of your audience. Begin now and be certain to wow your customers.
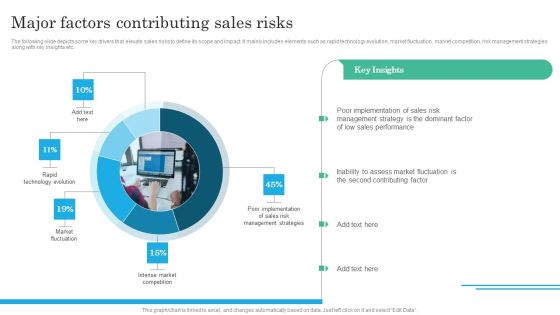
Implementing Sales Volatility Management Techniques Major Factors Contributing Sales Risks Introduction PDF
Make sure to capture your audiences attention in your business displays with our gratis customizable Implementing Sales Volatility Management Techniques Major Factors Contributing Sales Risks Introduction PDF. These are great for business strategies, office conferences, capital raising or task suggestions. If you desire to acquire more customers for your tech business and ensure they stay satisfied, create your own sales presentation with these plain slides.

Financial Dashboard To Track Organization Expenses Ppt PowerPoint Presentation File Ideas PDF
The following slide showcases KPI dashboard which can be used by finance managers to evaluate financial health of company. Revenue, expenses, net profit, bills receivable, bills payable, quick ratio, current ratio are some of the major metrics which are outlined in the slide. Boost your pitch with our creative Financial Dashboard To Track Organization Expenses Ppt PowerPoint Presentation File Ideas PDF. Deliver an awe-inspiring pitch that will mesmerize everyone. Using these presentation templates you will surely catch everyones attention. You can browse the ppts collection on our website. We have researchers who are experts at creating the right content for the templates. So you do not have to invest time in any additional work. Just grab the template now and use them.

Forecasting Revenue And Growth Of Saas Company Ppt PowerPoint Presentation File Pictures PDF
The following slide showcases a histogram highlighting revenue projection of Software as a service SaaS company. It also provides information about compound annual growth rate CAGR along with key takeaways. Create an editable Forecasting Revenue And Growth Of Saas Company Ppt PowerPoint Presentation File Pictures PDF that communicates your idea and engages your audience. Whether youre presenting a business or an educational presentation, pre designed presentation templates help save time. Forecasting Revenue And Growth Of Saas Company Ppt PowerPoint Presentation File Pictures PDF is highly customizable and very easy to edit, covering many different styles from creative to business presentations. Slidegeeks has creative team members who have crafted amazing templates. So, go and get them without any delay.
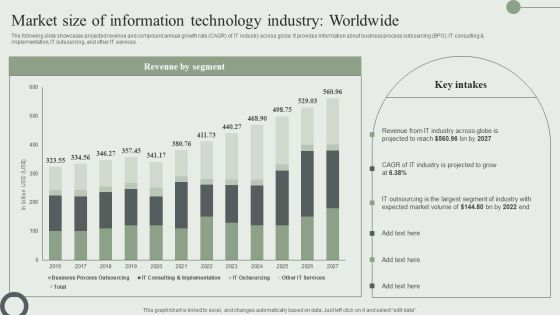
Market Size Of Information Technology Industry Worldwide Ppt PowerPoint Presentation File Outline PDF
The following slide showcases projected revenue and compound annual growth rate CAGR of IT industry across globe. It provides information about business process outsourcing BPO, IT consulting and implementation, IT outsourcing, and other IT services. From laying roadmaps to briefing everything in detail, our templates are perfect for you. You can set the stage with your presentation slides. All you have to do is download these easy to edit and customizable templates. Market Size Of Information Technology Industry Worldwide Ppt PowerPoint Presentation File Outline PDF will help you deliver an outstanding performance that everyone would remember and praise you for. Do download this presentation today.

Marketing Campaign Dashboard For B2B Marketers Ppt PowerPoint Presentation File Diagrams PDF
The following slide showcases key performance indicator KPI dashboard that can assist managers to evaluate digital marketing campaign performance. The key metrics mentioned in the slide are click-through-rate CTR, conversion rate, cost per click CPC, etc. Present like a pro with Marketing Campaign Dashboard For B2B Marketers Ppt PowerPoint Presentation File Diagrams PDF Create beautiful presentations together with your team, using our easy to use presentation slides. Share your ideas in real time and make changes on the fly by downloading our templates. So whether you are in the office, on the go, or in a remote location, you can stay in sync with your team and present your ideas with confidence. With Slidegeeks presentation got a whole lot easier. Grab these presentations today.
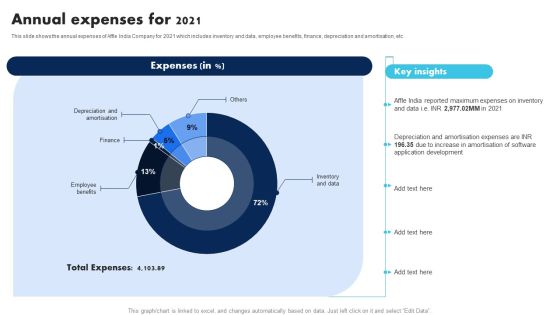
Information Technology Solutions Company Outline Annual Expenses For 2021 Guidelines PDF
This slide shows the annual expenses of Affle India Company for 2021 which includes inventory and data, employee benefits, finance, depreciation and amortisation, etc Do you know about Slidesgeeks Information Technology Solutions Company Outline Annual Expenses For 2021 Guidelines PDF. These are perfect for delivering any kind od presentation. Using it, create PowerPoint presentations that communicate your ideas and engage audiences. Save time and effort by using our pre designed presentation templates that are perfect for a wide range of topic. Our vast selection of designs covers a range of styles, from creative to business, and are all highly customizable and easy to edit. Download as a PowerPoint template or use them as Google Slides themes.

Information Technology Solutions Company Outline Cost Per Converted User CPCU Revenue Topics PDF
This slide covers the cost per converted user revenue for last five years from 2018 to 2022 which shows increasing trend due to more user conversions From laying roadmaps to briefing everything in detail, our templates are perfect for you. You can set the stage with your presentation slides. All you have to do is download these easy to edit and customizable templates. Information Technology Solutions Company Outline Cost Per Converted User CPCU Revenue Topics PDF will help you deliver an outstanding performance that everyone would remember and praise you for. Do download this presentation today.
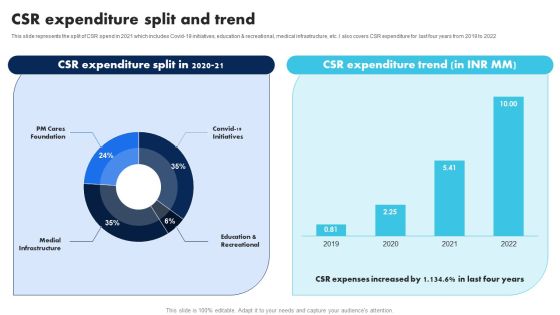
Information Technology Solutions Company Outline CSR Expenditure Split And Trend Summary PDF
This slide represents the split of CSR spend in 2021 which includes Covid-19 initiatives, education and recreational, medical infrastructure, etc. I also covers CSR expenditure for last four years from 2019 to 2022 Present like a pro with Information Technology Solutions Company Outline CSR Expenditure Split And Trend Summary PDF Create beautiful presentations together with your team, using our easy to use presentation slides. Share your ideas in real time and make changes on the fly by downloading our templates. So whether you are in the office, on the go, or in a remote location, you can stay in sync with your team and present your ideas with confidence. With Slidegeeks presentation got a whole lot easier. Grab these presentations today.
Information Technology Solutions Company Outline Employee Count And Diversity Icons PDF
This slide focuses on employee count and diversity which shows employee by gender and functions such as data platforms and operations, general administration, management, etc Slidegeeks is here to make your presentations a breeze with Information Technology Solutions Company Outline Employee Count And Diversity Icons PDF With our easy to use and customizable templates, you can focus on delivering your ideas rather than worrying about formatting. With a variety of designs to choose from, you are sure to find one that suits your needs. And with animations and unique photos, illustrations, and fonts, you can make your presentation pop. So whether you are giving a sales pitch or presenting to the board, make sure to check out Slidegeeks first.
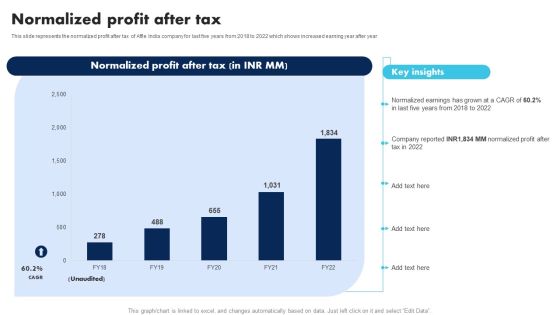
Information Technology Solutions Company Outline Normalized Profit After Tax Slides PDF
This slide represents the normalized profit after tax of Affle India company for last five years from 2018 to 2022 which shows increased earning year after year Are you in need of a template that can accommodate all of your creative concepts This one is crafted professionally and can be altered to fit any style. Use it with Google Slides or PowerPoint. Include striking photographs, symbols, depictions, and other visuals. Fill, move around, or remove text boxes as desired. Test out color palettes and font mixtures. Edit and save your work, or work with colleagues. Download Information Technology Solutions Company Outline Normalized Profit After Tax Slides PDF and observe how to make your presentation outstanding. Give an impeccable presentation to your group and make your presentation unforgettable.

Information Technology Solutions Company Outline Operating Cash Flows From 2018 To 2022 Professional PDF
This slide showcases the cash flows from operating activities for last five years from 2018 to 2022 which shows increase in cash flows year after year Crafting an eye catching presentation has never been more straightforward. Let your presentation shine with this tasteful yet straightforward Information Technology Solutions Company Outline Operating Cash Flows From 2018 To 2022 Professional PDF template. It offers a minimalistic and classy look that is great for making a statement. The colors have been employed intelligently to add a bit of playfulness while still remaining professional. Construct the ideal Information Technology Solutions Company Outline Operating Cash Flows From 2018 To 2022 Professional PDF that effortlessly grabs the attention of your audience. Begin now and be certain to wow your customers.

Information Technology Solutions Company Outline Operational Revenue Breakdown By Segments Pictures PDF
This slide represents the operational revenue split on the basis of business segments such as consumer and enterprise platform for last four years from 2019 to 2022 Make sure to capture your audiences attention in your business displays with our gratis customizable Information Technology Solutions Company Outline Operational Revenue Breakdown By Segments Pictures PDF. These are great for business strategies, office conferences, capital raising or task suggestions. If you desire to acquire more customers for your tech business and ensure they stay satisfied, create your own sales presentation with these plain slides.
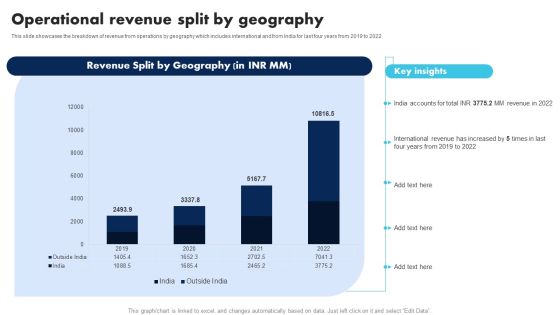
Information Technology Solutions Company Outline Operational Revenue Split By Geography Formats PDF
This slide showcases the breakdown of revenue from operations by geography which includes international and from India for last four years from 2019 to 2022 Formulating a presentation can take up a lot of effort and time, so the content and message should always be the primary focus. The visuals of the PowerPoint can enhance the presenters message, so our Information Technology Solutions Company Outline Operational Revenue Split By Geography Formats PDF was created to help save time. Instead of worrying about the design, the presenter can concentrate on the message while our designers work on creating the ideal templates for whatever situation is needed. Slidegeeks has experts for everything from amazing designs to valuable content, we have put everything into Information Technology Solutions Company Outline Operational Revenue Split By Geography Formats PDF
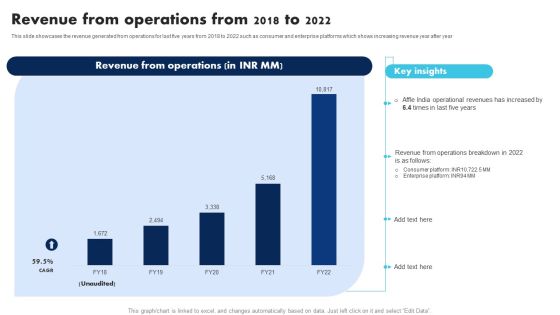
Information Technology Solutions Company Outline Revenue From Operations From 2018 To 2022 Professional PDF
This slide showcases the revenue generated from operations for last five years from 2018 to 2022 such as consumer and enterprise platforms which shows increasing revenue year after year This Information Technology Solutions Company Outline Revenue From Operations From 2018 To 2022 Professional PDF is perfect for any presentation, be it in front of clients or colleagues. It is a versatile and stylish solution for organizing your meetings. The Information Technology Solutions Company Outline Revenue From Operations From 2018 To 2022 Professional PDF features a modern design for your presentation meetings. The adjustable and customizable slides provide unlimited possibilities for acing up your presentation. Slidegeeks has done all the homework before launching the product for you. So, do not wait, grab the presentation templates today

Information Technology Solutions Company Outline Total Revenue Net Profit And EBIDTA Clipart PDF
This slide showcases revenue, net profit and EBIDTA of Affle India Company for last three years from 2020 to 2022 which shows increasing revenue year after year The Information Technology Solutions Company Outline Total Revenue Net Profit And EBIDTA Clipart PDF is a compilation of the most recent design trends as a series of slides. It is suitable for any subject or industry presentation, containing attractive visuals and photo spots for businesses to clearly express their messages. This template contains a variety of slides for the user to input data, such as structures to contrast two elements, bullet points, and slides for written information. Slidegeeks is prepared to create an impression.
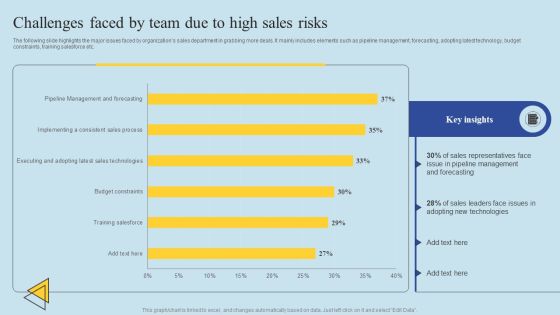
Determining Risks In Sales Administration Procedure Challenges Faced By Team Due To High Sales Risks Structure PDF
The following slide highlights the major issues faced by organizations sales department in grabbing more deals. It mainly includes elements such as pipeline management, forecasting, adopting latest technology, budget constraints, training salesforce etc. Crafting an eye catching presentation has never been more straightforward. Let your presentation shine with this tasteful yet straightforward Determining Risks In Sales Administration Procedure Challenges Faced By Team Due To High Sales Risks Structure PDF template. It offers a minimalistic and classy look that is great for making a statement. The colors have been employed intelligently to add a bit of playfulness while still remaining professional. Construct the ideal Determining Risks In Sales Administration Procedure Challenges Faced By Team Due To High Sales Risks Structure PDF that effortlessly grabs the attention of your audience. Begin now and be certain to wow your customers.
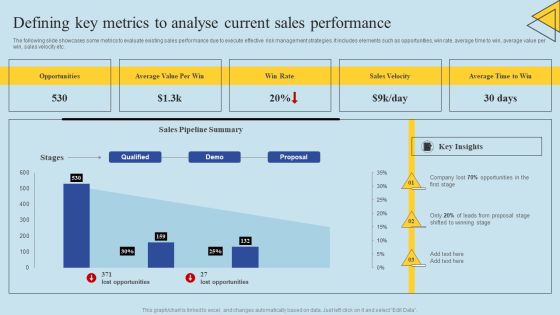
Determining Risks In Sales Administration Procedure Defining Key Metrics To Analyse Current Structure PDF
The following slide showcases some metrics to evaluate existing sales performance due to execute effective risk management strategies. It includes elements such as opportunities, win rate, average time to win, average value per win, sales velocity etc. Coming up with a presentation necessitates that the majority of the effort goes into the content and the message you intend to convey. The visuals of a PowerPoint presentation can only be effective if it supplements and supports the story that is being told. Keeping this in mind our experts created Determining Risks In Sales Administration Procedure Defining Key Metrics To Analyse Current Structure PDF to reduce the time that goes into designing the presentation. This way, you can concentrate on the message while our designers take care of providing you with the right template for the situation.

Determining Risks In Sales Administration Procedure Evaluating Projected Vs Actual Sales Performance Pictures PDF
The following slide depicts the evaluation of existing sales performance to set future standards and determine opportunities for improvement. It mainly includes key performance indicators KPIs such as pipeline, forecast, attainment, gap etc. Explore a selection of the finest Determining Risks In Sales Administration Procedure Evaluating Projected Vs Actual Sales Performance Pictures PDF here. With a plethora of professionally designed and pre made slide templates, you can quickly and easily find the right one for your upcoming presentation. You can use our Determining Risks In Sales Administration Procedure Evaluating Projected Vs Actual Sales Performance Pictures PDF to effectively convey your message to a wider audience. Slidegeeks has done a lot of research before preparing these presentation templates. The content can be personalized and the slides are highly editable. Grab templates today from Slidegeeks.
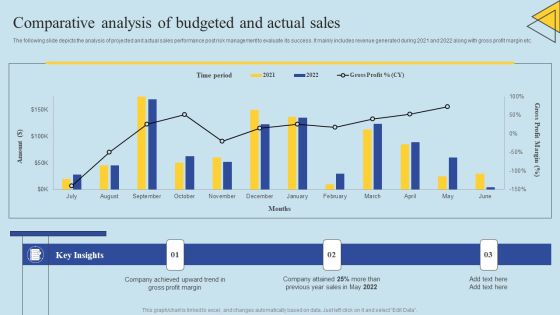
Determining Risks In Sales Administration Procedure Comparative Analysis Of Budgeted And Actual Sales Formats PDF
The following slide depicts the analysis of projected and actual sales performance post risk management to evaluate its success. It mainly includes revenue generated during 2021 and 2022 along with gross profit margin etc. Presenting this PowerPoint presentation, titled Determining Risks In Sales Administration Procedure Comparative Analysis Of Budgeted And Actual Sales Formats PDF, with topics curated by our researchers after extensive research. This editable presentation is available for immediate download and provides attractive features when used. Download now and captivate your audience. Presenting this Determining Risks In Sales Administration Procedure Comparative Analysis Of Budgeted And Actual Sales Formats PDF. Our researchers have carefully researched and created these slides with all aspects taken into consideration. This is a completely customizable Determining Risks In Sales Administration Procedure Comparative Analysis Of Budgeted And Actual Sales Formats PDF that is available for immediate downloading. Download now and make an impact on your audience. Highlight the attractive features available with our PPTs.
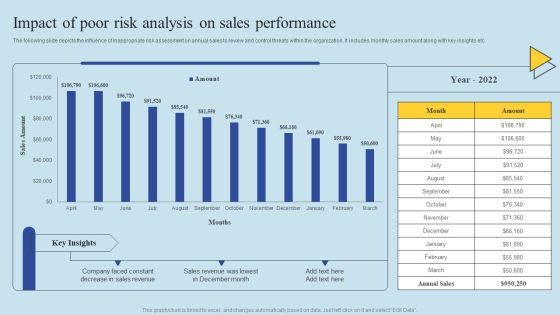
Determining Risks In Sales Administration Procedure Impact Of Poor Risk Analysis On Sales Performance Information PDF
The following slide depicts the influence of inappropriate risk assessment on annual sales to review and control threats within the organization. It includes monthly sales amount along with key insights etc. Here you can discover an assortment of the finest PowerPoint and Google Slides templates. With these templates, you can create presentations for a variety of purposes while simultaneously providing your audience with an eye catching visual experience. Download Determining Risks In Sales Administration Procedure Impact Of Poor Risk Analysis On Sales Performance Information PDF to deliver an impeccable presentation. These templates will make your job of preparing presentations much quicker, yet still, maintain a high level of quality. Slidegeeks has experienced researchers who prepare these templates and write high quality content for you. Later on, you can personalize the content by editing the Determining Risks In Sales Administration Procedure Impact Of Poor Risk Analysis On Sales Performance Information PDF.
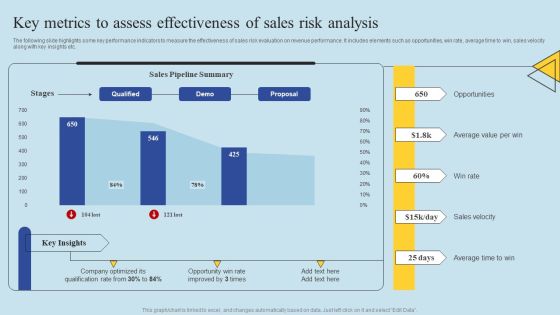
Determining Risks In Sales Administration Procedure Key Metrics To Assess Effectiveness Of Sales Pictures PDF
The following slide highlights some key performance indicators to measure the effectiveness of sales risk evaluation on revenue performance. It includes elements such as opportunities, win rate, average time to win, sales velocity along with key insights etc. This Determining Risks In Sales Administration Procedure Key Metrics To Assess Effectiveness Of Sales Pictures PDF from Slidegeeks makes it easy to present information on your topic with precision. It provides customization options, so you can make changes to the colors, design, graphics, or any other component to create a unique layout. It is also available for immediate download, so you can begin using it right away. Slidegeeks has done good research to ensure that you have everything you need to make your presentation stand out. Make a name out there for a brilliant performance.

Determining Risks In Sales Administration Procedure Major Factors Contributing Sales Risks Topics PDF
The following slide depicts some key drivers that elevate sales risks to define its scope and impact. It mainly includes elements such as rapid technology evolution, market fluctuation, market competition, risk management strategies along with key insights etc. Take your projects to the next level with our ultimate collection of Determining Risks In Sales Administration Procedure Major Factors Contributing Sales Risks Topics PDF. Slidegeeks has designed a range of layouts that are perfect for representing task or activity duration, keeping track of all your deadlines at a glance. Tailor these designs to your exact needs and give them a truly corporate look with your own brand colors they will make your projects stand out from the rest.
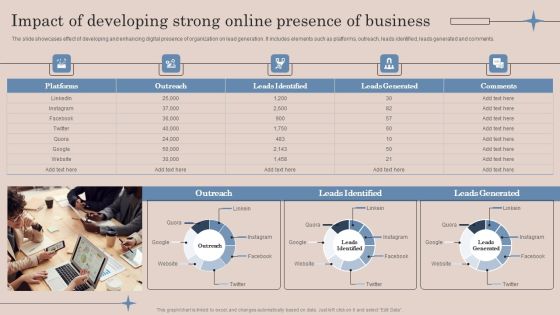
Impact Of Developing Strong Online Presence Of Business Ideas PDF
The slide showcases effect of developing and enhancing digital presence of organization on lead generation. It includes elements such as platforms, outreach, leads identified, leads generated and comments. Want to ace your presentation in front of a live audience Our Impact Of Developing Strong Online Presence Of Business Ideas PDF can help you do that by engaging all the users towards you. Slidegeeks experts have put their efforts and expertise into creating these impeccable powerpoint presentations so that you can communicate your ideas clearly. Moreover, all the templates are customizable, and easy to edit and downloadable. Use these for both personal and commercial use.
Monthly Sales Performance Tracking And Monitoring Dashboard Sample PDF
This slide showcases a dashboard presenting various metrics to measure and analyze sales performance for revenue growth. It includes key components such as number of sales, revenue, profit, cost, sales revenue, sales increment, cost analysis and cross sell. Do you have to make sure that everyone on your team knows about any specific topic I yes, then you should give Monthly Sales Performance Tracking And Monitoring Dashboard Sample PDF a try. Our experts have put a lot of knowledge and effort into creating this impeccable Monthly Sales Performance Tracking And Monitoring Dashboard Sample PDF. You can use this template for your upcoming presentations, as the slides are perfect to represent even the tiniest detail. You can download these templates from the Slidegeeks website and these are easy to edit. So grab these today.

Challenges In Managing And Resolving Client Objections Ppt Show Example PDF
This slide showcases various issues faced by business in customer issue managing and resolving. It includes problems such as high objection handling and resolution time and lack of trained sales representatives. Presenting this PowerPoint presentation, titled Challenges In Managing And Resolving Client Objections Ppt Show Example PDF, with topics curated by our researchers after extensive research. This editable presentation is available for immediate download and provides attractive features when used. Download now and captivate your audience. Presenting this Challenges In Managing And Resolving Client Objections Ppt Show Example PDF. Our researchers have carefully researched and created these slides with all aspects taken into consideration. This is a completely customizable Challenges In Managing And Resolving Client Objections Ppt Show Example PDF that is available for immediate downloading. Download now and make an impact on your audience. Highlight the attractive features available with our PPTs.

Impact Of Improving Sales Process On Business Ppt Portfolio Backgrounds PDF
The following slide exhibits impact analysis of improving sales tools, techniques, procedures and channels on business. It provides information about product sales, business profits and customer churn rate. Take your projects to the next level with our ultimate collection of Impact Of Improving Sales Process On Business Ppt Portfolio Backgrounds PDF. Slidegeeks has designed a range of layouts that are perfect for representing task or activity duration, keeping track of all your deadlines at a glance. Tailor these designs to your exact needs and give them a truly corporate look with your own brand colors they will make your projects stand out from the rest.
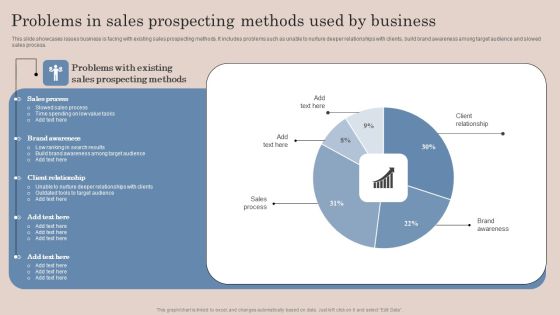
Problems In Sales Prospecting Methods Used By Business Ppt Infographic Template Graphics Download PDF
This slide showcases issues business is facing with existing sales prospecting methods. It includes problems such as unable to nurture deeper relationships with clients, build brand awareness among target audience and slowed sales process. Do you know about Slidesgeeks Problems In Sales Prospecting Methods Used By Business Ppt Infographic Template Graphics Download PDF These are perfect for delivering any kind od presentation. Using it, create PowerPoint presentations that communicate your ideas and engage audiences. Save time and effort by using our pre designed presentation templates that are perfect for a wide range of topic. Our vast selection of designs covers a range of styles, from creative to business, and are all highly customizable and easy to edit. Download as a PowerPoint template or use them as Google Slides themes.
Social Media Performance Tracking And Monitoring Dashboard Ppt Portfolio Gallery PDF
The following slide showcases a dashboard to track and measure social media platforms performance. It includes key elements such as website traffic, social media referral rate, site revenue, social media site revenue, etc. There are so many reasons you need a Social Media Performance Tracking And Monitoring Dashboard Ppt Portfolio Gallery PDF. The first reason is you can not spend time making everything from scratch, Thus, Slidegeeks has made presentation templates for you too. You can easily download these templates from our website easily.
Website Performance Tracking And Monitoring Dashboard Ppt Summary Rules PDF
The following slide showcases a dashboard to track and measure website performance. It includes key elements such as visits, average session duration, bounce rate, page views, goal conversion, visits by week, traffic sources, top channels by conversions, etc. Do you have to make sure that everyone on your team knows about any specific topic I yes, then you should give Website Performance Tracking And Monitoring Dashboard Ppt Summary Rules PDF a try. Our experts have put a lot of knowledge and effort into creating this impeccable Website Performance Tracking And Monitoring Dashboard Ppt Summary Rules PDF. You can use this template for your upcoming presentations, as the slides are perfect to represent even the tiniest detail. You can download these templates from the Slidegeeks website and these are easy to edit. So grab these today.

Employee Performance Management KPI Dashboard Structure PDF
The following slide depicts the overview of staff performance management system to achieve goals and evaluate business growth. It includes key elements such as absenteeism rate, overtime hours, training costs, labor effectiveness etc. Take your projects to the next level with our ultimate collection of Employee Performance Management KPI Dashboard Structure PDF. Slidegeeks has designed a range of layouts that are perfect for representing task or activity duration, keeping track of all your deadlines at a glance. Tailor these designs to your exact needs and give them a truly corporate look with your own brand colors they will make your projects stand out from the rest.

Major Reasons Of Employee Poor Performance Elements PDF
The following slide depicts the main causes of staff poor performance to formulate improvement strategies and assist decision making. It constitutes elements such as lack of skills, stressful work environment, inadequate training and development opportunities etc. Get a simple yet stunning designed Major Reasons Of Employee Poor Performance Elements PDF. It is the best one to establish the tone in your meetings. It is an excellent way to make your presentations highly effective. So, download this PPT today from Slidegeeks and see the positive impacts. Our easy to edit Major Reasons Of Employee Poor Performance Elements PDF can be your go to option for all upcoming conferences and meetings. So, what are you waiting for Grab this template today.

Overview Of Organizational Current Performance Issues Demonstration PDF
The following slide covers graph depicting current employee performance issues in the company to analyze improvement opportunities. It mainly includes elements such as productivity rate, sales revenue growth, work quality, staff morale, hiring cost etc. From laying roadmaps to briefing everything in detail, our templates are perfect for you. You can set the stage with your presentation slides. All you have to do is download these easy to edit and customizable templates. Overview Of Organizational Current Performance Issues Demonstration PDF will help you deliver an outstanding performance that everyone would remember and praise you for. Do download this presentation today.
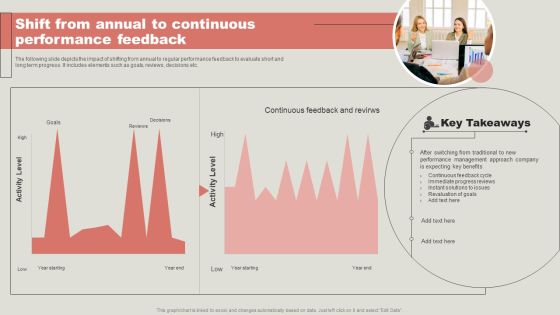
Shift From Annual To Continuous Performance Feedback Elements PDF
The following slide depicts the impact of shifting from annual to regular performance feedback to evaluate short and long term progress. It includes elements such as goals, reviews, decisions etc. Present like a pro with Shift From Annual To Continuous Performance Feedback Elements PDF Create beautiful presentations together with your team, using our easy to use presentation slides. Share your ideas in real time and make changes on the fly by downloading our templates. So whether you are in the office, on the go, or in a remote location, you can stay in sync with your team and present your ideas with confidence. With Slidegeeks presentation got a whole lot easier. Grab these presentations today.

Workforce Appraisal Status Monitoring Kpi Dashboard Template PDF
The following slide depicts the overview of employee appraisal tracking summary to align goals and system. It includes key elements such as stages, employee ID, name, feedback status pending, done, due etc. Slidegeeks is here to make your presentations a breeze with Workforce Appraisal Status Monitoring Kpi Dashboard Template PDF With our easy to use and customizable templates, you can focus on delivering your ideas rather than worrying about formatting. With a variety of designs to choose from, you are sure to find one that suits your needs. And with animations and unique photos, illustrations, and fonts, you can make your presentation pop. So whether you are giving a sales pitch or presenting to the board, make sure to check out Slidegeeks first.
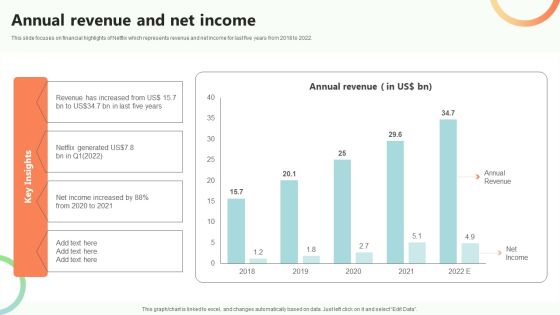
Online Video Content Provider Business Profile Annual Revenue And Net Income Background PDF
This slide focuses on financial highlights of Netflix which represents revenue and net income for last five years from 2018 to 2022. Find a pre designed and impeccable Online Video Content Provider Business Profile Annual Revenue And Net Income Background PDF. The templates can ace your presentation without additional effort. You can download these easy to edit presentation templates to make your presentation stand out from others. So, what are you waiting for Download the template from Slidegeeks today and give a unique touch to your presentation.
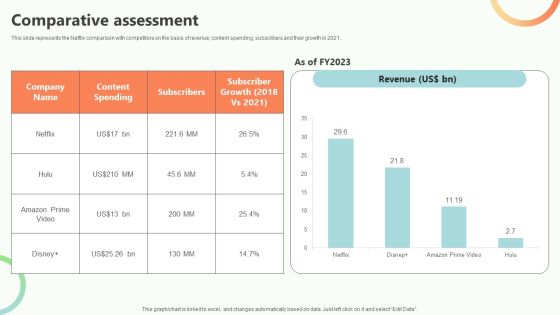
Online Video Content Provider Business Profile Comparative Assessment Infographics PDF
This slide represents the Netflix comparison with competitors on the basis of revenue, content spending, subscribers and their growth in 2021. Create an editable Online Video Content Provider Business Profile Comparative Assessment Infographics PDF that communicates your idea and engages your audience. Whether youre presenting a business or an educational presentation, pre designed presentation templates help save time. Online Video Content Provider Business Profile Comparative Assessment Infographics PDF is highly customizable and very easy to edit, covering many different styles from creative to business presentations. Slidegeeks has creative team members who have crafted amazing templates. So, go and get them without any delay.
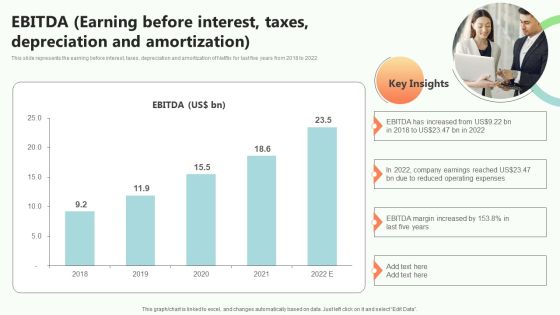
Online Video Content Provider Business Profile EBITDA Earning Before Interest Taxes Depreciation Summary PDF
This slide represents the earning before interest, taxes, depreciation and amortization of Netflix for last five years from 2018 to 2022 There are so many reasons you need a Online Video Content Provider Business Profile EBITDA Earning Before Interest Taxes Depreciation Summary PDF. The first reason is you cannot spend time making everything from scratch, Thus, Slidegeeks has made presentation templates for you too. You can easily download these templates from our website easily.

Online Video Content Provider Business Profile Employee Count From 2018 To 2021 Diagrams PDF
This slide showcases the employee count for last four years from 2018 to 2021 that represents continuous increase in number of Netflix employees. It also covers employee split by region. Do you have to make sure that everyone on your team knows about any specific topic I yes, then you should give Online Video Content Provider Business Profile Employee Count From 2018 To 2021 Diagrams PDF a try. Our experts have put a lot of knowledge and effort into creating this impeccable Online Video Content Provider Business Profile Employee Count From 2018 To 2021 Diagrams PDF. You can use this template for your upcoming presentations, as the slides are perfect to represent even the tiniest detail. You can download these templates from the Slidegeeks website and these are easy to edit. So grab these today.

Online Video Content Provider Business Profile Netflix Investment In Content Production Topics PDF
This slide showcases the investment in content production by Netflix for last 7 years from 2016 to 2022 which represents highest spending in 2020 till now If your project calls for a presentation, then Slidegeeks is your go to partner because we have professionally designed, easy to edit templates that are perfect for any presentation. After downloading, you can easily edit Online Video Content Provider Business Profile Netflix Investment In Content Production Topics PDF and make the changes accordingly. You can rearrange slides or fill them with different images. Check out all the handy templates
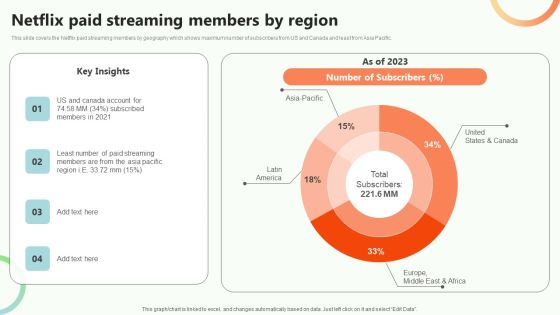
Online Video Content Provider Business Profile Netflix Paid Streaming Members By Region Rules PDF
This slide covers the Netflix paid streaming members by geography which shows maximum number of subscribers from US and Canada and least from Asia Pacific. Crafting an eye catching presentation has never been more straightforward. Let your presentation shine with this tasteful yet straightforward Online Video Content Provider Business Profile Netflix Paid Streaming Members By Region Rules PDF template. It offers a minimalistic and classy look that is great for making a statement. The colors have been employed intelligently to add a bit of playfulness while still remaining professional. Construct the ideal Online Video Content Provider Business Profile Netflix Paid Streaming Members By Region Rules PDF that effortlessly grabs the attention of your audience. Begin now and be certain to wow your customers.

Online Video Content Provider Business Profile Netflix Subscribers By Year Infographics PDF
This slide represents the number of Netflix paid subscribers in last five years from 2018 to 2022 which shows increase in subscribers year after year. Make sure to capture your audiences attention in your business displays with our gratis customizable Online Video Content Provider Business Profile Netflix Subscribers By Year Infographics PDF. These are great for business strategies, office conferences, capital raising or task suggestions. If you desire to acquire more customers for your tech business and ensure they stay satisfied, create your own sales presentation with these plain slides.
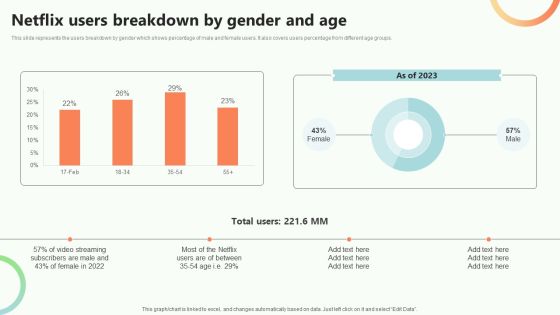
Online Video Content Provider Business Profile Netflix Users Breakdown By Gender And Age Introduction PDF
This slide represents the users breakdown by gender which shows percentage of male and female users. It also covers users percentage from different age groups. Coming up with a presentation necessitates that the majority of the effort goes into the content and the message you intend to convey. The visuals of a PowerPoint presentation can only be effective if it supplements and supports the story that is being told. Keeping this in mind our experts created Online Video Content Provider Business Profile Netflix Users Breakdown By Gender And Age Introduction PDF to reduce the time that goes into designing the presentation. This way, you can concentrate on the message while our designers take care of providing you with the right template for the situation.
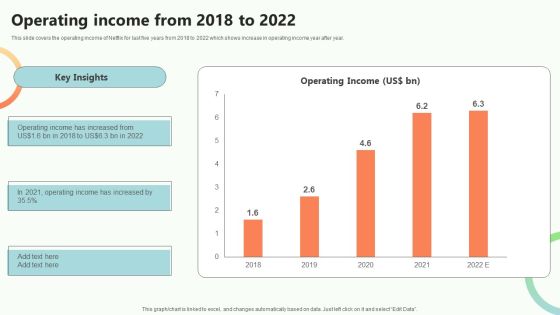
Online Video Content Provider Business Profile Operating Income From 2018 To 2022 Inspiration PDF
This slide covers the operating income of Netflix for last five years from 2018 to 2022 which shows increase in operating income year after year. This Online Video Content Provider Business Profile Operating Income From 2018 To 2022 Inspiration PDF is perfect for any presentation, be it in front of clients or colleagues. It is a versatile and stylish solution for organizing your meetings. The Online Video Content Provider Business Profile Operating Income From 2018 To 2022 Inspiration PDF features a modern design for your presentation meetings. The adjustable and customizable slides provide unlimited possibilities for acing up your presentation. Slidegeeks has done all the homework before launching the product for you. So, do not wait, grab the presentation templates today
Online Video Content Provider Business Profile Ownership Structure Icons PDF
This slide represents the shareholder ownership structure which includes state or government, individual insiders, general public and institutions Explore a selection of the finest Online Video Content Provider Business Profile Ownership Structure Icons PDF here. With a plethora of professionally designed and pre made slide templates, you can quickly and easily find the right one for your upcoming presentation. You can use our Online Video Content Provider Business Profile Ownership Structure Icons PDF to effectively convey your message to a wider audience. Slidegeeks has done a lot of research before preparing these presentation templates. The content can be personalized and the slides are highly editable. Grab templates today from Slidegeeks.

Online Video Content Provider Business Profile Revenue Split By Geography Sample PDF
This slide revenue breakdown by geography which shows highest revenue from United States and Canada and lowest from Asia-Pacific region. The Online Video Content Provider Business Profile Revenue Split By Geography Sample PDF is a compilation of the most recent design trends as a series of slides. It is suitable for any subject or industry presentation, containing attractive visuals and photo spots for businesses to clearly express their messages. This template contains a variety of slides for the user to input data, such as structures to contrast two elements, bullet points, and slides for written information. Slidegeeks is prepared to create an impression.

360 Degree Employee Performance Evaluation Dashboard Elements PDF
The following slide showcases the summary of 360 degree performance assessment method to analyze employee productivity and engagement rate. It includes reviews based on self, subordinate, peer, customer feedback along with project based rating etc. Presenting this PowerPoint presentation, titled 360 Degree Employee Performance Evaluation Dashboard Elements PDF, with topics curated by our researchers after extensive research. This editable presentation is available for immediate download and provides attractive features when used. Download now and captivate your audience. Presenting this 360 Degree Employee Performance Evaluation Dashboard Elements PDF. Our researchers have carefully researched and created these slides with all aspects taken into consideration. This is a completely customizable 360 Degree Employee Performance Evaluation Dashboard Elements PDF that is available for immediate downloading. Download now and make an impact on your audience. Highlight the attractive features available with our PPTs.

Online Advertising Firm Business Profile Annual Expenses For 2021 Information PDF
This slide shows the annual expenses of Affle India Company for 2021 which includes inventory and data, employee benefits, finance, depreciation and amortisation, etc. Take your projects to the next level with our ultimate collection of Online Advertising Firm Business Profile Annual Expenses For 2021 Information PDF. Slidegeeks has designed a range of layouts that are perfect for representing task or activity duration, keeping track of all your deadlines at a glance. Tailor these designs to your exact needs and give them a truly corporate look with your own brand colors they will make your projects stand out from the rest.
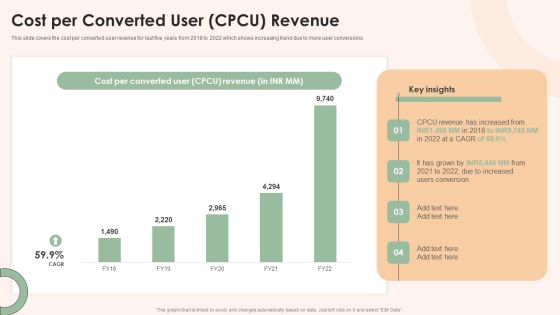
Online Advertising Firm Business Profile Cost Per Converted User CPCU Revenue Information PDF
This slide covers the cost per converted user revenue for last five years from 2018 to 2022 which shows increasing trend due to more user conversions Get a simple yet stunning designed Online Advertising Firm Business Profile Cost Per Converted User CPCU Revenue Information PDF. It is the best one to establish the tone in your meetings. It is an excellent way to make your presentations highly effective. So, download this PPT today from Slidegeeks and see the positive impacts. Our easy to edit Online Advertising Firm Business Profile Cost Per Converted User CPCU Revenue Information PDF can be your go to option for all upcoming conferences and meetings. So, what are you waiting for Grab this template today.

Online Advertising Firm Business Profile CSR Expenditure Split And Trend Themes PDF
This slide represents the split of CSR spend in 2021 which includes Covid-19 initiatives, education and recreational, medical infrastructure, etc. I also covers CSR expenditure for last four years from 2019 to 2022 From laying roadmaps to briefing everything in detail, our templates are perfect for you. You can set the stage with your presentation slides. All you have to do is download these easy to edit and customizable templates. Online Advertising Firm Business Profile CSR Expenditure Split And Trend Themes PDF will help you deliver an outstanding performance that everyone would remember and praise you for. Do download this presentation today.

Online Advertising Firm Business Profile Employee Count And Diversity Mockup PDF
This slide focuses on employee count and diversity which shows employee by gender and functions such as data platforms and operations, general administration, management, etc. Present like a pro with Online Advertising Firm Business Profile Employee Count And Diversity Mockup PDF Create beautiful presentations together with your team, using our easy to use presentation slides. Share your ideas in real time and make changes on the fly by downloading our templates. So whether you are in the office, on the go, or in a remote location, you can stay in sync with your team and present your ideas with confidence. With Slidegeeks presentation got a whole lot easier. Grab these presentations today.
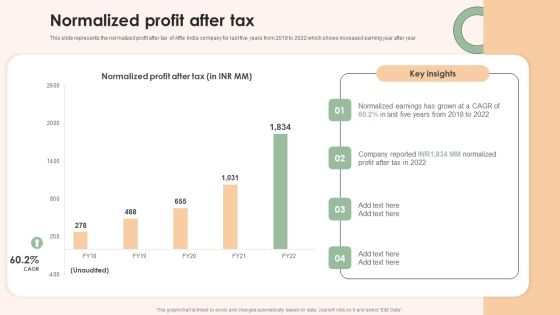
Online Advertising Firm Business Profile Normalized Profit After Tax Microsoft PDF
This slide represents the normalized profit after tax of Affle India company for last five years from 2018 to 2022 which shows increased earning year after year Formulating a presentation can take up a lot of effort and time, so the content and message should always be the primary focus. The visuals of the PowerPoint can enhance the presenters message, so our Online Advertising Firm Business Profile Normalized Profit After Tax Microsoft PDF was created to help save time. Instead of worrying about the design, the presenter can concentrate on the message while our designers work on creating the ideal templates for whatever situation is needed. Slidegeeks has experts for everything from amazing designs to valuable content, we have put everything into Online Advertising Firm Business Profile Normalized Profit After Tax Microsoft PDF
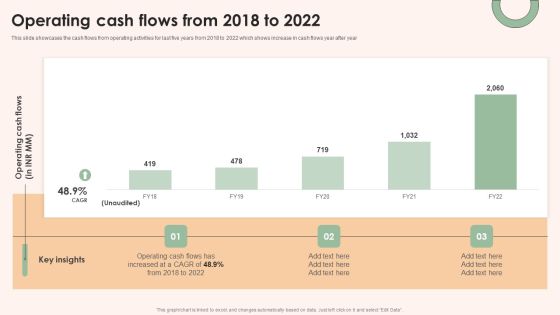
Online Advertising Firm Business Profile Operating Cash Flows From 2018 To 2022 Designs PDF
This slide showcases the cash flows from operating activities for last five years from 2018 to 2022 which shows increase in cash flows year after year Coming up with a presentation necessitates that the majority of the effort goes into the content and the message you intend to convey. The visuals of a PowerPoint presentation can only be effective if it supplements and supports the story that is being told. Keeping this in mind our experts created Online Advertising Firm Business Profile Operating Cash Flows From 2018 To 2022 Designs PDF to reduce the time that goes into designing the presentation. This way, you can concentrate on the message while our designers take care of providing you with the right template for the situation.

Online Advertising Firm Business Profile Operational Revenue Breakdown By Segments Formats PDF
This slide represents the operational revenue split on the basis of business segments such as consumer and enterprise platform for last four years from 2019 to 2022 This modern and well arranged Online Advertising Firm Business Profile Operational Revenue Breakdown By Segments Formats PDF provides lots of creative possibilities. It is very simple to customize and edit with the Powerpoint Software. Just drag and drop your pictures into the shapes. All facets of this template can be edited with Powerpoint no extra software is necessary. Add your own material, put your images in the places assigned for them, adjust the colors, and then you can show your slides to the world, with an animated slide included.
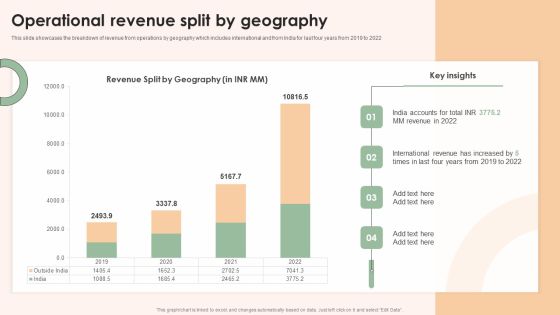
Online Advertising Firm Business Profile Operational Revenue Split By Geography Elements PDF
This slide showcases the breakdown of revenue from operations by geography which includes international and from India for last four years from 2019 to 2022 This Online Advertising Firm Business Profile Operational Revenue Split By Geography Elements PDF is perfect for any presentation, be it in front of clients or colleagues. It is a versatile and stylish solution for organizing your meetings. The Online Advertising Firm Business Profile Operational Revenue Split By Geography Elements PDF features a modern design for your presentation meetings. The adjustable and customizable slides provide unlimited possibilities for acing up your presentation. Slidegeeks has done all the homework before launching the product for you. So, do not wait, grab the presentation templates today

Online Advertising Firm Business Profile Revenue From Operations From 2018 To 2022 Ideas PDF
This slide showcases the revenue generated from operations for last five years from 2018 to 2022 such as consumer and enterprise platforms which shows increasing revenue year after year The best PPT templates are a great way to save time, energy, and resources. Slidegeeks have 100 percent editable powerpoint slides making them incredibly versatile. With these quality presentation templates, you can create a captivating and memorable presentation by combining visually appealing slides and effectively communicating your message. Download Online Advertising Firm Business Profile Revenue From Operations From 2018 To 2022 Ideas PDF from Slidegeeks and deliver a wonderful presentation.
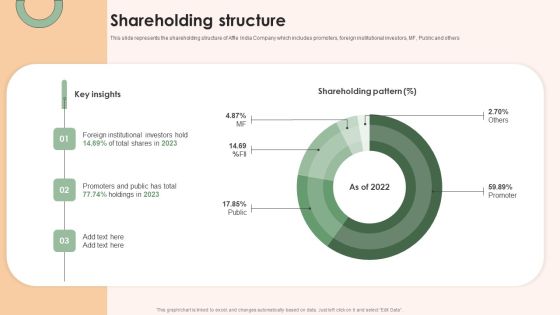
Online Advertising Firm Business Profile Shareholding Structure Introduction PDF
This slide represents the shareholding structure of Affle India Company which includes promoters, foreign institutional investors, MF, Public and others The Online Advertising Firm Business Profile Shareholding Structure Introduction PDF is a compilation of the most recent design trends as a series of slides. It is suitable for any subject or industry presentation, containing attractive visuals and photo spots for businesses to clearly express their messages. This template contains a variety of slides for the user to input data, such as structures to contrast two elements, bullet points, and slides for written information. Slidegeeks is prepared to create an impression.
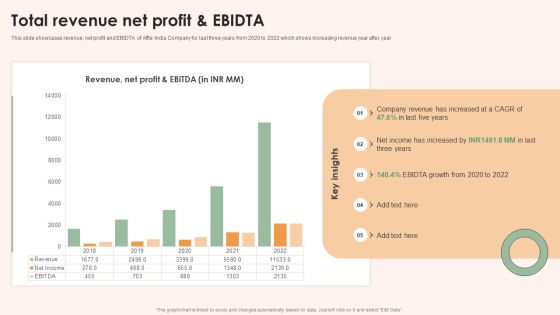
Online Advertising Firm Business Profile Total Revenue Net Profit And Ebidta Designs PDF
This slide showcases revenue, net profit and EBIDTA of Affle India Company for last three years from 2020 to 2022 which shows increasing revenue year after year Slidegeeks has constructed Online Advertising Firm Business Profile Total Revenue Net Profit And Ebidta Designs PDF after conducting extensive research and examination. These presentation templates are constantly being generated and modified based on user preferences and critiques from editors. Here, you will find the most attractive templates for a range of purposes while taking into account ratings and remarks from users regarding the content. This is an excellent jumping off point to explore our content and will give new users an insight into our top notch PowerPoint Templates.

Consulting Firm Business Profile Divisional Revenue Information PDF
The following slide highlights the comparative revenue generated from multiple business divisions for 2022 and 2023. The divisions included are insights, profiles, consulting, media, world panel, numerator and public services. From laying roadmaps to briefing everything in detail, our templates are perfect for you. You can set the stage with your presentation slides. All you have to do is download these easy to edit and customizable templates. Consulting Firm Business Profile Divisional Revenue Information PDF will help you deliver an outstanding performance that everyone would remember and praise you for. Do download this presentation today.

Consulting Firm Business Profile EBITDA Mockup PDF
This slide illustrates a graph of EBITDA for Kantar company showing growth trend in from 2021. It also showcases key insights for EBITDA highlighting estimated EBITDA for 2022 and 2023 Present like a pro with Consulting Firm Business Profile EBITDA Mockup PDF Create beautiful presentations together with your team, using our easy to use presentation slides. Share your ideas in real time and make changes on the fly by downloading our templates. So whether you are in the office, on the go, or in a remote location, you can stay in sync with your team and present your ideas with confidence. With Slidegeeks presentation got a whole lot easier. Grab these presentations today.

Consulting Firm Business Profile Gross Profit Mockup PDF
The following slide highlights the yearly gross profit from 2019 to 2021. it illustrates the changes in profit and margin along with the reasons for the increase and future projection Formulating a presentation can take up a lot of effort and time, so the content and message should always be the primary focus. The visuals of the PowerPoint can enhance the presenters message, so our Consulting Firm Business Profile Gross Profit Mockup PDF was created to help save time. Instead of worrying about the design, the presenter can concentrate on the message while our designers work on creating the ideal templates for whatever situation is needed. Slidegeeks has experts for everything from amazing designs to valuable content, we have put everything into Consulting Firm Business Profile Gross Profit Mockup PDF

Consulting Firm Business Profile Historical Revenue Elements PDF
The following slide highlights the historical revenue of Kantar from all of its operations. It also describes revenue growth and its projection for future This modern and well arranged Consulting Firm Business Profile Historical Revenue Elements PDF provides lots of creative possibilities. It is very simple to customize and edit with the Powerpoint Software. Just drag and drop your pictures into the shapes. All facets of this template can be edited with Powerpoint no extra software is necessary. Add your own material, put your images in the places assigned for them, adjust the colors, and then you can show your slides to the world, with an animated slide included.

Consulting Firm Business Profile Operational Profit Template PDF
The following slide highlights the profit generated by company from business operations from last 3 years. It also provides projected operating income data for 2022 and 2023 Retrieve professionally designed Consulting Firm Business Profile Operational Profit Template PDF to effectively convey your message and captivate your listeners. Save time by selecting pre made slideshows that are appropriate for various topics, from business to educational purposes. These themes come in many different styles, from creative to corporate, and all of them are easily adjustable and can be edited quickly. Access them as PowerPoint templates or as Google Slides themes. You do not have to go on a hunt for the perfect presentation because Slidegeeks got you covered from everywhere.

Customer Credit Reporting Company Outline Capital Expenditure Capex Designs PDF
This slide highlights the Experian company capital expenditure breakdown which includes and total capital investment breakdown with development, infrastructure and data. There are so many reasons you need a Customer Credit Reporting Company Outline Capital Expenditure Capex Designs PDF. The first reason is you cannot spend time making everything from scratch, Thus, Slidegeeks has made presentation templates for you too. You can easily download these templates from our website easily.

Customer Credit Reporting Company Outline Revenue And Dividend Per Share Pictures PDF
This slide highlights the Experian revenue and dividend per share which includes revenue, benchmark EBIT and EBIT margin, Benchmark earning per share and divided per share. This Customer Credit Reporting Company Outline Revenue And Dividend Per Share Pictures PDF is perfect for any presentation, be it in front of clients or colleagues. It is a versatile and stylish solution for organizing your meetings. The Customer Credit Reporting Company Outline Revenue And Dividend Per Share Pictures PDF features a modern design for your presentation meetings. The adjustable and customizable slides provide unlimited possibilities for acing up your presentation. Slidegeeks has done all the homework before launching the product for you. So, do not wait, grab the presentation templates today

Customer Credit Reporting Company Outline Revenue By Customer FY2022 Elements PDF
This slide highlights the revenue by customer which includes financial service, direct to consumer, health, retail, automotive, insurance, government, and public sector, media and technology. Explore a selection of the finest Customer Credit Reporting Company Outline Revenue By Customer FY2022 Elements PDF here. With a plethora of professionally designed and pre made slide templates, you can quickly and easily find the right one for your upcoming presentation. You can use our Customer Credit Reporting Company Outline Revenue By Customer FY2022 Elements PDF to effectively convey your message to a wider audience. Slidegeeks has done a lot of research before preparing these presentation templates. The content can be personalized and the slides are highly editable. Grab templates today from Slidegeeks.

Ambush Marketing Most Cost Effective Event Marketing Strategy Ppt Model Graphics Pictures PDF
This slide provides glimpse about main reason for adopting ambush marketing strategies which gets more weightage from other types of advertising. It includes strategies such as getting sponsorship contracts, street marketing, experiential marketing, etc. Take your projects to the next level with our ultimate collection of Ambush Marketing Most Cost Effective Event Marketing Strategy Ppt Model Graphics Pictures PDF. Slidegeeks has designed a range of layouts that are perfect for representing task or activity duration, keeping track of all your deadlines at a glance. Tailor these designs to your exact needs and give them a truly corporate look with your own brand colors they will make your projects stand out from the rest.
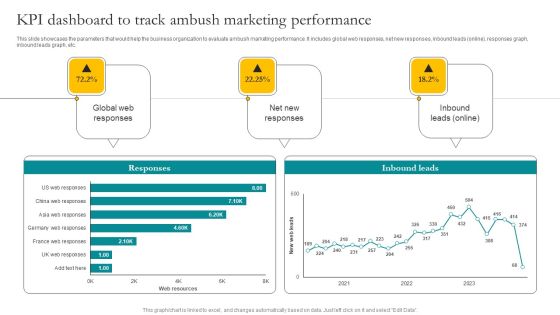
KPI Dashboard To Track Ambush Marketing Performance Ppt Slides Microsoft PDF
This slide showcases the parameters that would help the business organization to evaluate ambush marketing performance. It includes global web responses, net new responses, inbound leads online, responses graph, inbound leads graph, etc. Do you have an important presentation coming up Are you looking for something that will make your presentation stand out from the rest Look no further than KPI Dashboard To Track Ambush Marketing Performance Ppt Slides Microsoft PDF. With our professional designs, you can trust that your presentation will pop and make delivering it a smooth process. And with Slidegeeks, you can trust that your presentation will be unique and memorable. So why wait Grab KPI Dashboard To Track Ambush Marketing Performance Ppt Slides Microsoft PDF today and make your presentation stand out from the rest.

Effective Product Positioning Approach Brand Awareness Measuring Kpi Dashboard Ideas PDF
Following slide illustrates KPI dashboard that can be used to track the awareness level of a specific brand. KPIs covered in the slide are traffic, attention, authority, inbound channel performance etc. Boost your pitch with our creative Effective Product Positioning Approach Brand Awareness Measuring Kpi Dashboard Ideas PDF. Deliver an awe-inspiring pitch that will mesmerize everyone. Using these presentation templates you will surely catch everyones attention. You can browse the ppts collection on our website. We have researchers who are experts at creating the right content for the templates. So you do not have to invest time in any additional work. Just grab the template now and use them.
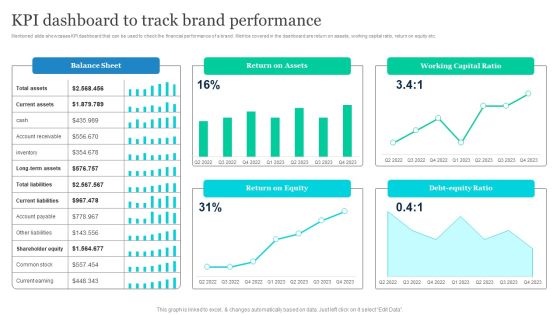
Effective Product Positioning Approach Kpi Dashboard To Track Brand Performance Infographics PDF
Mentioned slide showcases KPI dashboard that can be used to check the financial performance of a brand. Metrics covered in the dashboard are return on assets, working capital ratio, return on equity etc. Slidegeeks is one of the best resources for PowerPoint templates. You can download easily and regulate Effective Product Positioning Approach Kpi Dashboard To Track Brand Performance Infographics PDF for your personal presentations from our wonderful collection. A few clicks is all it takes to discover and get the most relevant and appropriate templates. Use our Templates to add a unique zing and appeal to your presentation and meetings. All the slides are easy to edit and you can use them even for advertisement purposes.

Flexible Working Policies And Guidelines Analyzing Workplace Flexibility Survey Results Diagrams PDF
The following slide outlines result of the remote working survey in the form of statistical data. Using this data the organizations can improve flexible work culture and boost workers morale in the organization. Boost your pitch with our creative Flexible Working Policies And Guidelines Analyzing Workplace Flexibility Survey Results Diagrams PDF. Deliver an awe-inspiring pitch that will mesmerize everyone. Using these presentation templates you will surely catch everyones attention. You can browse the ppts collection on our website. We have researchers who are experts at creating the right content for the templates. So you do not have to invest time in any additional work. Just grab the template now and use them.
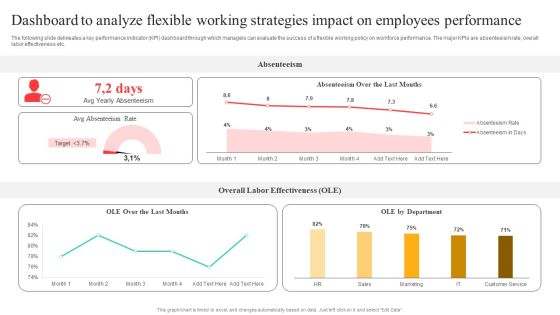
Flexible Working Policies And Guidelines Dashboard To Analyze Flexible Working Strategies Information PDF
The following slide delineates a key performance indicator KPI dashboard through which managers can evaluate the success of a flexible working policy on workforce performance. The major KPIs are absenteeism rate, overall labor effectiveness etc. Create an editable Flexible Working Policies And Guidelines Dashboard To Analyze Flexible Working Strategies Information PDF that communicates your idea and engages your audience. Whether youre presenting a business or an educational presentation, pre designed presentation templates help save time. Flexible Working Policies And Guidelines Dashboard To Analyze Flexible Working Strategies Information PDF is highly customizable and very easy to edit, covering many different styles from creative to business presentations. Slidegeeks has creative team members who have crafted amazing templates. So, go and get them without any delay.

Flexible Working Policies And Guidelines Impact Of Flexible Working On Employees Performance Topics PDF
The following slide showcases the impact of remote working on performance of the workforce. Employee productivity, job satisfaction, employee retention and absenteeism rate are the major factors that are mentioned in the slide along with key insights. Slidegeeks is one of the best resources for PowerPoint templates. You can download easily and regulate Flexible Working Policies And Guidelines Impact Of Flexible Working On Employees Performance Topics PDF for your personal presentations from our wonderful collection. A few clicks is all it takes to discover and get the most relevant and appropriate templates. Use our Templates to add a unique zing and appeal to your presentation and meetings. All the slides are easy to edit and you can use them even for advertisement purposes.

Flexible Working Policies And Guidelines Statistics Showing Continuously Rise In Flexible Working Mockup PDF
The following slide outlines a diagrammatic representation outlining the percentage of companies switching to flexible work arrangements. It includes details of the last 5 years along with key observations. Want to ace your presentation in front of a live audience Our Flexible Working Policies And Guidelines Statistics Showing Continuously Rise In Flexible Working Mockup PDF can help you do that by engaging all the users towards you. Slidegeeks experts have put their efforts and expertise into creating these impeccable powerpoint presentations so that you can communicate your ideas clearly. Moreover, all the templates are customizable, and easy to edit and downloadable. Use these for both personal and commercial use.
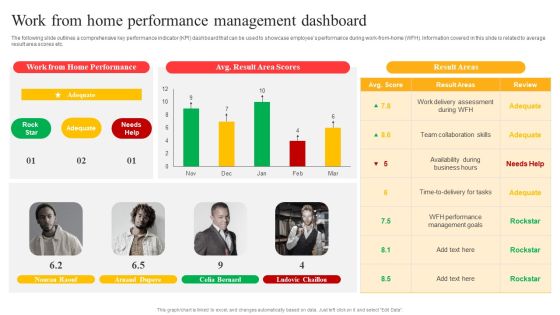
Flexible Working Policies And Guidelines Work From Home Performance Management Dashboard Introduction PDF
The following slide outlines a comprehensive key performance indicator KPI dashboard that can be used to showcase employees performance during work from home WFH. Information covered in this slide is related to average result area scores etc. There are so many reasons you need a Flexible Working Policies And Guidelines Work From Home Performance Management Dashboard Introduction PDF. The first reason is you cannot spend time making everything from scratch, Thus, Slidegeeks has made presentation templates for you too. You can easily download these templates from our website easily.

Dashboard To Manage Marketing Campaigns Of Multiple Brands Diagrams PDF
This slide showcases dashboard that can help organization to manage the marketing campaigns in multi brand strategy. Its key elements are lead breakdown, total leads, key conversion metrics etc. Here you can discover an assortment of the finest PowerPoint and Google Slides templates. With these templates, you can create presentations for a variety of purposes while simultaneously providing your audience with an eye catching visual experience. Download Dashboard To Manage Marketing Campaigns Of Multiple Brands Diagrams PDF to deliver an impeccable presentation. These templates will make your job of preparing presentations much quicker, yet still, maintain a high level of quality. Slidegeeks has experienced researchers who prepare these templates and write high quality content for you. Later on, you can personalize the content by editing the Dashboard To Manage Marketing Campaigns Of Multiple Brands Diagrams PDF.
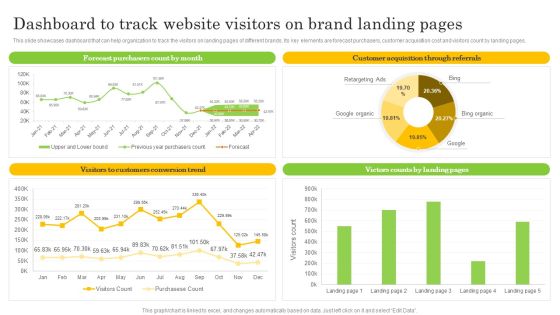
Dashboard To Track Website Visitors On Brand Landing Pages Sample PDF
This slide showcases dashboard that can help organization to track the visitors on landing pages of different brands. Its key elements are forecast purchasers, customer acquisition cost and visitors count by landing pages. This Dashboard To Track Website Visitors On Brand Landing Pages Sample PDF from Slidegeeks makes it easy to present information on your topic with precision. It provides customization options, so you can make changes to the colors, design, graphics, or any other component to create a unique layout. It is also available for immediate download, so you can begin using it right away. Slidegeeks has done good research to ensure that you have everything you need to make your presentation stand out. Make a name out there for a brilliant performance.

Executing Sales Risk Administration Procedure Major Factors Contributing Sales Risks Diagrams PDF
The following slide depicts some key drivers that elevate sales risks to define its scope and impact. It mainly includes elements such as rapid technology evolution, market fluctuation, market competition, risk management strategies along with key insights etc. Get a simple yet stunning designed Executing Sales Risk Administration Procedure Major Factors Contributing Sales Risks Diagrams PDF. It is the best one to establish the tone in your meetings. It is an excellent way to make your presentations highly effective. So, download this PPT today from Slidegeeks and see the positive impacts. Our easy to edit Executing Sales Risk Administration Procedure Major Factors Contributing Sales Risks Diagrams PDF can be your go to option for all upcoming conferences and meetings. So, what are you waiting for Grab this template today.

Impact Of Poor Risk Analysis On Sales Performance Template PDF
The following slide depicts the influence of inappropriate risk assessment on annual sales to review and control threats within the organization. It includes monthly sales amount along with key insights etc. If your project calls for a presentation, then Slidegeeks is your go to partner because we have professionally designed, easy to edit templates that are perfect for any presentation. After downloading, you can easily edit Impact Of Poor Risk Analysis On Sales Performance Template PDF and make the changes accordingly. You can rearrange slides or fill them with different images. Check out all the handy templates.

Assessing Impact Of Sales Risk Management With KPI Dashboard Ppt Professional Graphics Pictures PDF
The following slide highlights some key performance indicators KPIs to measure the influence of executing sales risk management strategies on revenue performance. It includes elements such as target attainment rate, gross profit, annual growth rate etc. Are you in need of a template that can accommodate all of your creative concepts This one is crafted professionally and can be altered to fit any style. Use it with Google Slides or PowerPoint. Include striking photographs, symbols, depictions, and other visuals. Fill, move around, or remove text boxes as desired. Test out color palettes and font mixtures. Edit and save your work, or work with colleagues. Download Assessing Impact Of Sales Risk Management With KPI Dashboard Ppt Professional Graphics Pictures PDF and observe how to make your presentation outstanding. Give an impeccable presentation to your group and make your presentation unforgettable.

Challenges Faced By Team Due To High Sales Risks Ppt Styles Slide Download PDF
The following slide highlights the major issues faced by organizations sales department in grabbing more deals. It mainly includes elements such as pipeline management, forecasting, adopting latest technology, budget constraints, training salesforce etc. Formulating a presentation can take up a lot of effort and time, so the content and message should always be the primary focus. The visuals of the PowerPoint can enhance the presenters message, so our Challenges Faced By Team Due To High Sales Risks Ppt Styles Slide Download PDF was created to help save time. Instead of worrying about the design, the presenter can concentrate on the message while our designers work on creating the ideal templates for whatever situation is needed. Slidegeeks has experts for everything from amazing designs to valuable content, we have put everything into Challenges Faced By Team Due To High Sales Risks Ppt Styles Slide Download PDF.

Comparative Analysis Of Budgeted And Actual Sales Ppt Slides Graphics Tutorials PDF
The following slide depicts the analysis of projected and actual sales performance post risk management to evaluate its success. It mainly includes revenue generated during 2021 and 2022 along with gross profit margin etc. Coming up with a presentation necessitates that the majority of the effort goes into the content and the message you intend to convey. The visuals of a PowerPoint presentation can only be effective if it supplements and supports the story that is being told. Keeping this in mind our experts created Comparative Analysis Of Budgeted And Actual Sales Ppt Slides Graphics Tutorials PDF to reduce the time that goes into designing the presentation. This way, you can concentrate on the message while our designers take care of providing you with the right template for the situation.

Evaluating Projected Vs Actual Sales Performance Ppt Ideas Template PDF
The following slide depicts the evaluation of existing sales performance to set future standards and determine opportunities for improvement. It mainly includes key performance indicators KPIs such as pipeline, forecast, attainment, gap etc. The Evaluating Projected Vs Actual Sales Performance Ppt Ideas Template PDF is a compilation of the most recent design trends as a series of slides. It is suitable for any subject or industry presentation, containing attractive visuals and photo spots for businesses to clearly express their messages. This template contains a variety of slides for the user to input data, such as structures to contrast two elements, bullet points, and slides for written information. Slidegeeks is prepared to create an impression.

Key Metrics To Assess Effectiveness Of Sales Risk Analysis Ppt Outline Design Ideas PDF
The following slide highlights some key performance indicators to measure the effectiveness of sales risk evaluation on revenue performance. It includes elements such as opportunities, win rate, average time to win, sales velocity along with key insights etc. Retrieve professionally designed Key Metrics To Assess Effectiveness Of Sales Risk Analysis Ppt Outline Design Ideas PDF to effectively convey your message and captivate your listeners. Save time by selecting pre made slideshows that are appropriate for various topics, from business to educational purposes. These themes come in many different styles, from creative to corporate, and all of them are easily adjustable and can be edited quickly. Access them as PowerPoint templates or as Google Slides themes. You do not have to go on a hunt for the perfect presentation because Slidegeeks got you covered from everywhere.

Integrating Cobots To Improve Business Processes Dashboard To Track Cobot Performance Introduction PDF
This slide represents the cobots performance dashboard by covering details of battery level, performance, total hours, average time, time to return, energy consumption, and so on. Here you can discover an assortment of the finest PowerPoint and Google Slides templates. With these templates, you can create presentations for a variety of purposes while simultaneously providing your audience with an eye catching visual experience. Download Integrating Cobots To Improve Business Processes Dashboard To Track Cobot Performance Introduction PDF to deliver an impeccable presentation. These templates will make your job of preparing presentations much quicker, yet still, maintain a high level of quality. Slidegeeks has experienced researchers who prepare these templates and write high quality content for you. Later on, you can personalize the content by editing the Integrating Cobots To Improve Business Processes Dashboard To Track Cobot Performance Introduction PDF.


 Continue with Email

 Home
Home


