Sales Turnover

Business Sales Comparison With Actual And Predictive Data Ppt Model Slide PDF
The following slide highlights the annual sales forecast report for business illustrating key headings which includes product, last year, forecast, actual, number of customers, average sales per customer and net sales. Showcasing this set of slides titled business sales comparison with actual and predictive data ppt model slide pdf. The topics addressed in these templates are antivirus protection, cloud solutions, system controls. All the content presented in this PPT design is completely editable. Download it and make adjustments in color, background, font etc. as per your unique business setting.

B2B Marketing Content Administration Playbook Different Ways To Optimize Return On Sales Content Microsoft PDF
This slide provides information regarding different ways to optimize returns on sales content in terms of upgraded content generation process, reorganized sales content and organized content targeting, delivery and measurement. Presenting b2b marketing content administration playbook different ways to optimize return on sales content microsoft pdf to provide visual cues and insights. Share and navigate important information on three stages that need your due attention. This template can be used to pitch topics like upgrade content generation process, reorganize sales content, organize content targeting In addtion, this PPT design contains high resolution images, graphics, etc, that are easily editable and available for immediate download.

B2B Marketing Content Administration Playbook Several Steps Involved In B2B Sales Process Template PDF
This slide provides information regarding streamlining B2B sales models for improved productivity by assessing different sales models based in cost per transaction and degree of sales interaction and aligning organizational strengths with prospects requirements. Deliver and pitch your topic in the best possible manner with this b2b marketing content administration playbook several steps involved in b2b sales process template pdf Use them to share invaluable insights on lead identification, business justification, negotiation and impress your audience. This template can be altered and modified as per your expectations. So, grab it now.
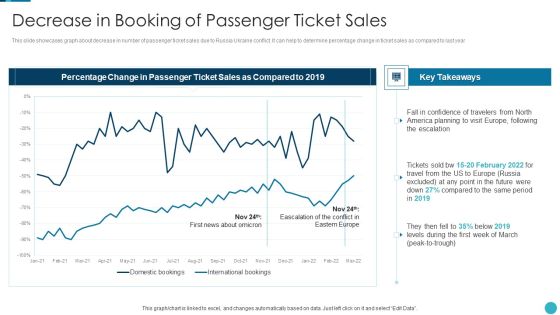
Russia Ukraine War Influence On Airline Sector Decrease In Booking Of Passenger Ticket Sales Topics PDF
This slide showcases graph about decrease in number of passenger ticket sales due to Russia Ukraine conflict. It can help to determine percentage change in ticket sales as compared to last year Deliver and pitch your topic in the best possible manner with this russia ukraine war influence on airline sector decrease in booking of passenger ticket sales topics pdf Use them to share invaluable insights on decrease in booking of passenger ticket sales and impress your audience. This template can be altered and modified as per your expectations. So, grab it now.
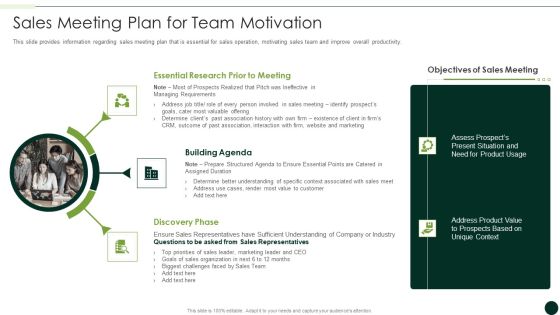
Salesman Principles Playbook Sales Meeting Plan For Team Motivation Formats PDF
This slide provides information regarding sales meeting plan that is essential for sales operation, motivating sales team and improve overall productivity. This is a salesman principles playbook sales meeting plan for team motivation formats pdf template with various stages. Focus and dispense information on three stages using this creative set, that comes with editable features. It contains large content boxes to add your information on topics like essential research prior to meeting, building agenda, discovery phase You can also showcase facts, figures, and other relevant content using this PPT layout. Grab it now.

Salesman Principles Playbook Sales Workforce Training For Performance Improvement Inspiration PDF
This slide provides information regarding sales workforce training for performance improvement in terms of product or service training, market insights understanding, job role clarification. It caters basic and advanced level training program for sales, marketing, account management representatives. Deliver and pitch your topic in the best possible manner with this salesman principles playbook sales workforce training for performance improvement inspiration pdf Use them to share invaluable insights on sales workforce training for performance improvement and impress your audience. This template can be altered and modified as per your expectations. So, grab it now.
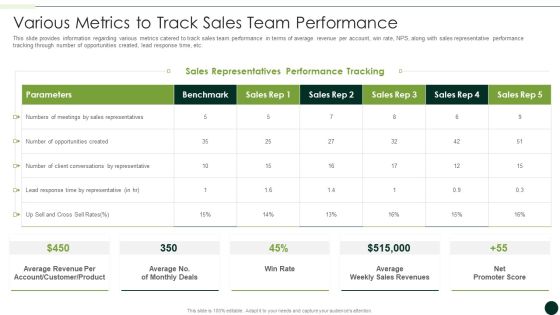
Salesman Principles Playbook Various Metrics To Track Sales Team Performance Summary PDF
This slide provides information regarding various metrics catered to track sales team performance in terms of average revenue per account, win rate, NPS, along with sales representative performance tracking through number of opportunities created, lead response time, etc. Deliver an awe inspiring pitch with this creative salesman principles playbook various metrics to track sales team performance summary pdf bundle. Topics like various metrics to track sales team performance can be discussed with this completely editable template. It is available for immediate download depending on the needs and requirements of the user.

Business To Business Account Key People Associated With B2B Sales Workforce Structure Elements PDF
This slide provides information regarding B2B sales workforce structure including market development representatives, sales engineers, on boarder, account managers, sales development representatives, etc. This is a Business To Business Account Key People Associated With B2B Sales Workforce Structure Elements PDF template with various stages. Focus and dispense information on eight stages using this creative set, that comes with editable features. It contains large content boxes to add your information on topics like Market Development, Engineers On Boarders, Account Managers, Account Executives, Customer Success Managers. You can also showcase facts, figures, and other relevant content using this PPT layout. Grab it now.

Business To Business Account Metrices To Track Sales Team Performance Background PDF
This slide provides information regarding various metrics catered to track sales team performance in terms of average revenue per account, win rate, NPS, along with sales representative performance tracking through number of opportunities created, lead response time, etc. Deliver an awe inspiring pitch with this creative Business To Business Account Metrices To Track Sales Team Performance Background PDF bundle. Topics like Average Revenue Per Account, Customer, Product, Sales Representatives Performance Tracking can be discussed with this completely editable template. It is available for immediate download depending on the needs and requirements of the user.
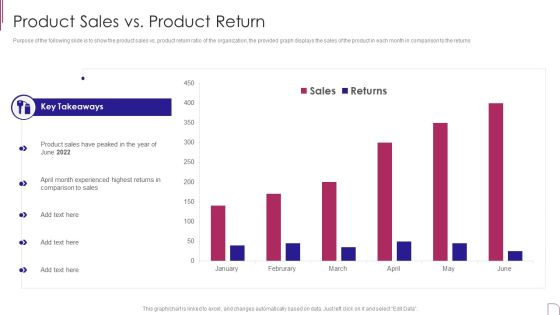
Yearly Product Performance Assessment Repor Product Sales Vs Product Return Information PDF
Purpose of the following slide is to show the product sales vs. product return ratio of the organization, the provided graph displays the sales of the product in each month in comparison to the returns.Deliver an awe inspiring pitch with this creative Yearly Product Performance Assessment Repor Product Sales Vs Product Return Information PDF bundle. Topics like Key Takeaways, Experienced Highest, Comparison Sales can be discussed with this completely editable template. It is available for immediate download depending on the needs and requirements of the user.
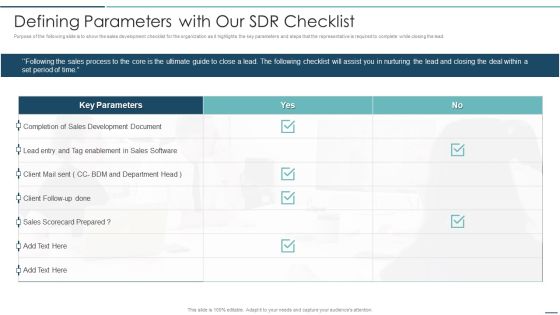
Playbook For Sales Development Executives Defining Parameters With Our SDR Checklist Designs PDF
Purpose of the following slide is to show the sales development checklist for the organization as it highlights the key parameters and steps that the representative is required to complete while closing the lead. Deliver an awe inspiring pitch with this creative Playbook For Sales Development Executives Defining Parameters With Our SDR Checklist Designs PDF bundle. Topics like Development Document, Enablement In Sales, Sales Scorecard can be discussed with this completely editable template. It is available for immediate download depending on the needs and requirements of the user.

Sales Team Report To Identify Employees With Low Output Brochure PDF
This slide depicts the analysis report formulated by sales team to track employee productiveness and pinpoint underproductive members. It considers target vs actual sales and target vs actual hours worked and performance status. Showcasing this set of slides titled Sales Team Report To Identify Employees With Low Output Brochure PDF. The topics addressed in these templates are Target Sales, Target Hours, Actual Hours. All the content presented in this PPT design is completely editable. Download it and make adjustments in color, background, font etc. as per your unique business setting.

Data Processing Services Delivery Machine Learning Solutions For Sales And Marketing Introduction PDF
This template covers the Machine Learning Solutions for sales and marketing team such as Machine learning employs a learning algorithm to examine prior CRM or ERP data in order to determine the best pricing optimization method. Presenting Data Processing Services Delivery Machine Learning Solutions For Sales And Marketing Introduction PDF to provide visual cues and insights. Share and navigate important information on one stages that need your due attention. This template can be used to pitch topics like Sales Executives, Historical Data, Sales Team, Considerable Time. In addtion, this PPT design contains high resolution images, graphics, etc, that are easily editable and available for immediate download.

Business Performance Review Report To Evaluate Performance Of Sales Rep Infographics PDF
The following slide highlights quarterly business review QBR report which can be used by firm to evaluate the efficiency of sales rep. information covered in this slide is related to total sales by employees in different quarters, number of calls made. Pitch your topic with ease and precision using this Business Performance Review Report To Evaluate Performance Of Sales Rep Infographics PDF. This layout presents information on Revenue Sales, Tim Paine, Number Colds Calls. It is also available for immediate download and adjustment. So, changes can be made in the color, design, graphics or any other component to create a unique layout.

Global Automobile Sector Overview Global Electric Vehicle Sales With Market Share In 2021 Designs PDF
This slide covers the graphical representation of the global EV market share along with BEV and PHEV sales. It also includes key insights about the global plugin electric car sales, chinas share in global EV sales, etc. Deliver and pitch your topic in the best possible manner with this Global Automobile Sector Overview Global Electric Vehicle Sales With Market Share In 2021 Designs PDF. Use them to share invaluable insights on Electric Vehicles, Battery Electric, Electric Vehicle and impress your audience. This template can be altered and modified as per your expectations. So, grab it now.
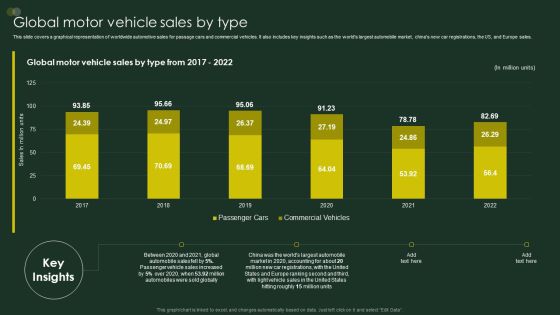
Global Automobile Sector Overview Global Motor Vehicle Sales By Type Mockup PDF
This slide covers a graphical representation of worldwide automotive sales for passage cars and commercial vehicles. It also includes key insights such as the worlds largest automobile market, chinas new car registrations, the US, and Europe sales. Deliver an awe inspiring pitch with this creative Global Automobile Sector Overview Global Motor Vehicle Sales By Type Mockup PDF bundle. Topics like Automobile Sales, Automobiles Were, Hitting Roughly can be discussed with this completely editable template. It is available for immediate download depending on the needs and requirements of the user.
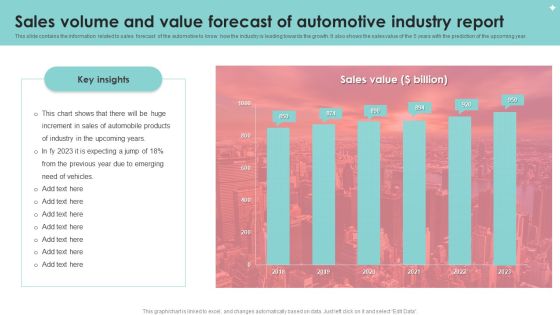
Sales Volume And Value Forecast Of Automotive Industry Report Diagrams PDF
This slide contains the information related to sales forecast of the automotive to know how the industry is leading towards the growth. It also shows the sales value of the 5 years with the prediction of the upcoming year. Showcasing this set of slides titled Sales Volume And Value Forecast Of Automotive Industry Report Diagrams PDF. The topics addressed in these templates are Sales Volume, Value Forecast, Automotive Industry Report. All the content presented in this PPT design is completely editable. Download it and make adjustments in color, background, font etc. as per your unique business setting.
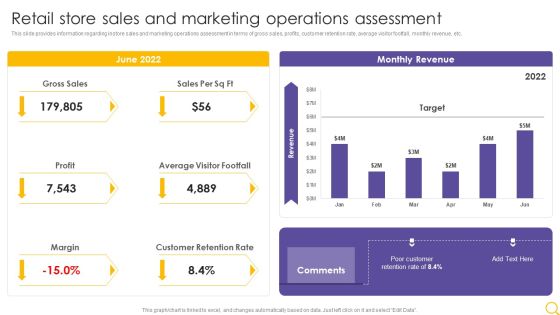
Retail Outlet Operational Efficiency Analytics Retail Store Sales And Marketing Operations Assessment Designs PDF
This slide provides information regarding instore sales and marketing operations assessment in terms of gross sales, profits, customer retention rate, average visitor footfall, monthly revenue, etc. Deliver and pitch your topic in the best possible manner with this Retail Outlet Operational Efficiency Analytics Retail Store Sales And Marketing Operations Assessment Designs PDF. Use them to share invaluable insights on Gross Sales, Profit, Average Visitor Footfall and impress your audience. This template can be altered and modified as per your expectations. So, grab it now.

Retail Outlet Operational Efficiency Analytics Sales Dashboards For Retail Store Inspiration PDF
This slide illustrates the dashboard retail store sales forecasting providing information regarding sales per employee, price unit every transaction, total number of customers and average value of customer transaction. Deliver and pitch your topic in the best possible manner with this Retail Outlet Operational Efficiency Analytics Sales Dashboards For Retail Store Inspiration PDF. Use them to share invaluable insights on Gross Sales, Total No Customers, Value Customer and impress your audience. This template can be altered and modified as per your expectations. So, grab it now.
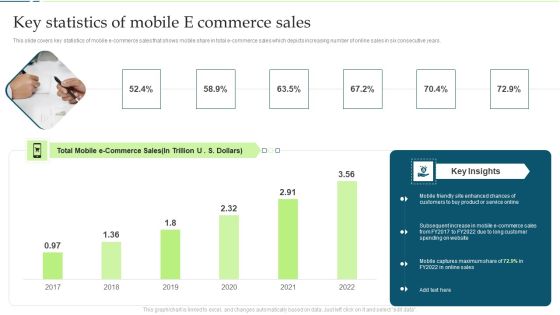
Customer Engagement And Experience Key Statistics Of Mobile E Commerce Sales Structure PDF Brochure PDF
This slide covers key statistics of mobile e commerce sales that shows mobile share in total e commerce sales which depicts increasing number of online sales in six consecutive years.Deliver and pitch your topic in the best possible manner with this Customer Engagement And Experience Key Statistics Of Mobile E Commerce Sales Structure PDF Brochure PDF. Use them to share invaluable insights on Subsequent Increase, Long Customer, Captures Maximum and impress your audience. This template can be altered and modified as per your expectations. So, grab it now.

Annual Sales Work Schedule For Estimation Of Revenue And Product Positioning Goals Demonstration PDF
This slide covers plan for improving revenue and product positioning for 4 years. It includes revenue, product sales, customer growth and product sales positioning goals.Presenting Annual Sales Work Schedule For Estimation Of Revenue And Product Positioning Goals Demonstration PDF to dispense important information. This template comprises four stages. It also presents valuable insights into the topics including Revenue Goals, Customer Growth, Sales Positioning. This is a completely customizable PowerPoint theme that can be put to use immediately. So, download it and address the topic impactfully.
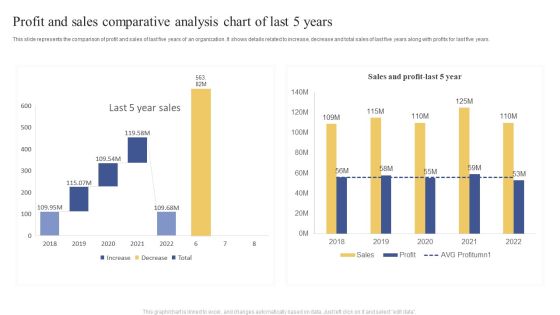
Profit And Sales Comparative Analysis Chart Of Last 5 Years Ppt Visual Aids Example 2015 PDF
This slide represents the comparison of profit and sales of last five years of an organization. It shows details related to increase, decrease and total sales of last five years along with profits for last five years. Showcasing this set of slides titled Profit And Sales Comparative Analysis Chart Of Last 5 Years Ppt Visual Aids Example 2015 PDF. The topics addressed in these templates are Last 5 Year, Sales, 2018 To 2022. All the content presented in this PPT design is completely editable. Download it and make adjustments in color, background, font etc. as per your unique business setting.

5 Years Sales And Profit Growth Comparative Analysis Chart Of Private Banks Infographics PDF
This slide shows the table representing the comparison between sales and profit growth of five years of various private banks. It includes details related to names of private banks and their five years sales growth and profit growth. Pitch your topic with ease and precision using this 5 Years Sales And Profit Growth Comparative Analysis Chart Of Private Banks Infographics PDF. This layout presents information on Private Banks, Sales Growth, Profit Growth. It is also available for immediate download and adjustment. So, changes can be made in the color, design, graphics or any other component to create a unique layout.

New Product Sales Assessment Summary Tips Ppt PowerPoint Presentation Visual Aids Example 2015 PDF
This slide showcase analysis of new product sales report for optimizing sales process. It include product feature, durability, temperature resistance, water resistance, price and consumer rating.Pitch your topic with ease and precision using this New Product Sales Assessment Summary Tips Ppt PowerPoint Presentation Visual Aids Example 2015 PDF. This layout presents information on New Product, Sales Assessment Summary. It is also available for immediate download and adjustment. So, changes can be made in the color, design, graphics or any other component to create a unique layout.

Unit Market And Earnings Share From Brand Product Sales Clipart PDF
This slide covers market share and revenue earned from multi brands. It also includes number of sales along with percentage of revenue market share. Pitch your topic with ease and precision using this Unit Market And Earnings Share From Brand Product Sales Clipart PDF. This layout presents information on Unit Sales, Unit Market Share, Sales Revenue. It is also available for immediate download and adjustment. So, changes can be made in the color, design, graphics or any other component to create a unique layout.

KPI Dashboard To Track Beauty Care Products Sales Performance Ppt Outline Pictures PDF
This slide shows the key performance indicators dashboard which can be used to analyze current financial position of cosmetic business. It includes metrics such as sales, expenses, profit, cash in hand, etc. Showcasing this set of slides titled KPI Dashboard To Track Beauty Care Products Sales Performance Ppt Outline Pictures PDF. The topics addressed in these templates are Sales Number, Total Sales, Total Profit, Cost. All the content presented in this PPT design is completely editable. Download it and make adjustments in color, background, font etc. as per your unique business setting.

Monthly Sales Forecast Projection Of Abc Company Ppt Model Diagrams PDF
This slide shows the monthly sales forecast table of the new business, reorders and their total of ABC company. It shows the sales goal, actual sales taken place in a month and the variance between them. Showcasing this set of slides titled Monthly Sales Forecast Projection Of Abc Company Ppt Model Diagrams PDF. The topics addressed in these templates are New Business, Goal, Actual. All the content presented in this PPT design is completely editable. Download it and make adjustments in color, background, font etc. as per your unique business setting.

Real Estate Business Monthly Sales Forecast Dashboard Ppt Layouts Grid PDF
This slide represents the dashboard showing the data related to sales forecasting for the real estate business. It shows details related to the set target, sales targets won, open and forecasted and also shows the graph representing the sales pipeline for the year. Showcasing this set of slides titled Real Estate Business Monthly Sales Forecast Dashboard Ppt Layouts Grid PDF. The topics addressed in these templates are Next Billing Data, Pipeline, Current Fiscal Year. All the content presented in this PPT design is completely editable. Download it and make adjustments in color, background, font etc. as per your unique business setting.
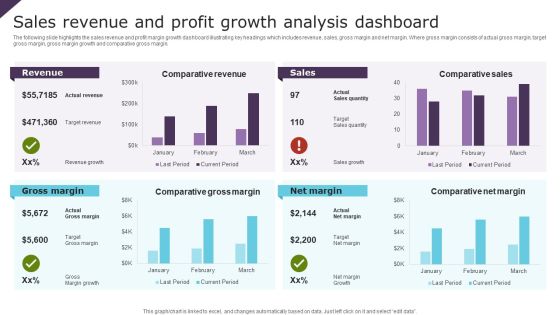
Sales Revenue And Profit Growth Analysis Dashboard Ppt Portfolio Slide PDF
The following slide highlights the sales revenue and profit margin growth dashboard illustrating key headings which includes revenue, sales, gross margin and net margin. Where gross margin consists of actual gross margin, target gross margin, gross margin growth and comparative gross margin. Showcasing this set of slides titled Sales Revenue And Profit Growth Analysis Dashboard Ppt Portfolio Slide PDF. The topics addressed in these templates are Revenue, Sales, Gross Margin, Net Margin. All the content presented in this PPT design is completely editable. Download it and make adjustments in color, background, font etc. as per your unique business setting.

Comparative Analysis Of Major Sales Performance Monitoring Tools Ppt File Infographics PDF
This slide illustrates comparative assessment of major tools for sales tracking. It provides information about automated workflows, sales trend analysis, integrated web tracking, downloadable charts, conversion rates, etc. Pitch your topic with ease and precision using this Comparative Analysis Of Major Sales Performance Monitoring Tools Ppt File Infographics PDF. This layout presents information on Features And Services, Automated Workflows, Sales Trend Analysis. It is also available for immediate download and adjustment. So, changes can be made in the color, design, graphics or any other component to create a unique layout.
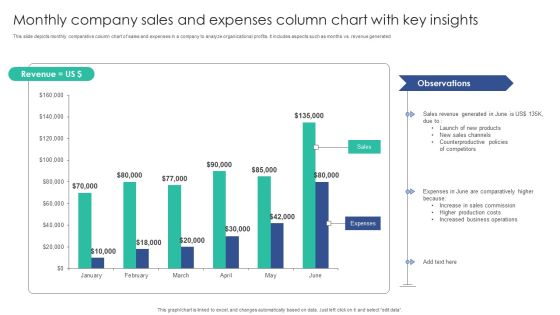
Monthly Company Sales And Expenses Column Chart With Key Insights Mockup PDF
This slide depicts monthly comparative column chart of sales and expenses in a company to analyze organizational profits. It includes aspects such as months vs. revenue generatedPitch your topic with ease and precision using this Monthly Company Sales And Expenses Column Chart With Key Insights Mockup PDF. This layout presents information on Sales Channels, Counterproductive Policies, Sales Commission. It is also available for immediate download and adjustment. So, changes can be made in the color, design, graphics or any other component to create a unique layout.
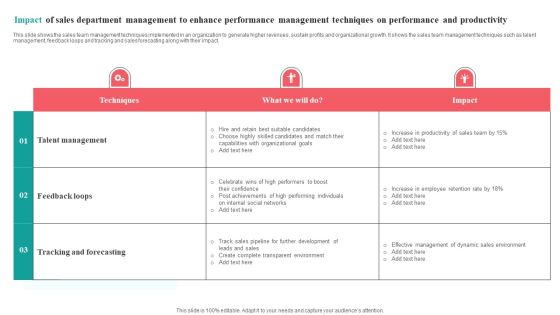
Impact Of Sales Department Management To Enhance Performance Management Techniques On Performance And Productivity Topics PDF
This slide shows the sales team management techniques implemented in an organization to generate higher revenues, sustain profits and organizational growth. It shows the sales team management techniques such as talent management, feedback loops and tracking and sales forecasting along with their impact.Pitch your topic with ease and precision using this Impact Of Sales Department Management To Enhance Performance Management Techniques On Performance And Productivity Topics PDF. This layout presents information on Capabilities Organizational, Performing Individuals, Candidates Match. It is also available for immediate download and adjustment. So, changes can be made in the color, design, graphics or any other component to create a unique layout.
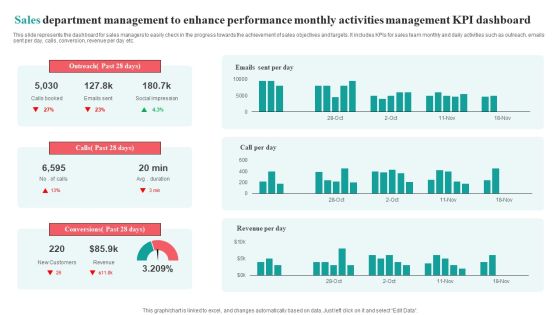
Sales Department Management To Enhance Performance Monthly Activities Management KPI Dashboard Brochure PDF
This slide represents the dashboard for sales managers to easily check in the progress towards the achievement of sales objectives and targets. It includes KPIs for sales team monthly and daily activities such as outreach, emails sent per day, calls, conversion, revenue per day etc.Pitch your topic with ease and precision using this Sales Department Management To Enhance Performance Monthly Activities Management KPI Dashboard Brochure PDF. This layout presents information on Social Impression, Conversions Past, Outreach Past. It is also available for immediate download and adjustment. So, changes can be made in the color, design, graphics or any other component to create a unique layout.

Retail Apparel Online Yearly Sales Of Online Apparel Firm Formats PDF
This slide showcases increase in sales of the company from year 2019 to 2022. It also depicts region wise sales for year 2022. Get a simple yet stunning designed Retail Apparel Online Yearly Sales Of Online Apparel Firm Formats PDF. It is the best one to establish the tone in your meetings. It is an excellent way to make your presentations highly effective. So, download this PPT today from Slidegeeks and see the positive impacts. Our easy-to-edit Retail Apparel Online Yearly Sales Of Online Apparel Firm Formats PDF can be your go-to option for all upcoming conferences and meetings. So, what are you waiting for Grab this template today.
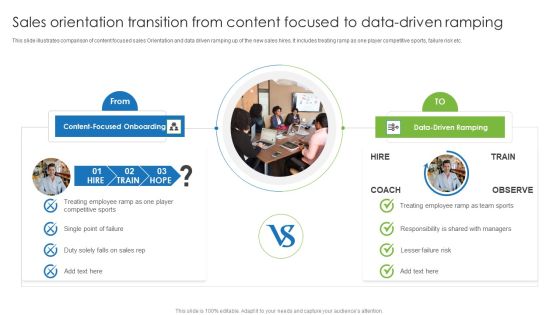
Sales Orientation Transition From Content Focused To Data Driven Ramping Professional PDF
This slide illustrates comparison of content focused sales Orientation and data driven ramping up of the new sales hires. It includes treating ramp as one player competitive sports, failure risk etc. Showcasing this set of slides titled Sales Orientation Transition From Content Focused To Data Driven Ramping Professional PDF. The topics addressed in these templates are Sales Orientation, Transition From Content, Focused Data Driven Ramping. All the content presented in this PPT design is completely editable. Download it and make adjustments in color, background, font etc. as per your unique business setting.

Sales To Cash Process With Shipping And Billing Stages Microsoft PDF
This slide provides diagrammatical representation of order processing stages which take place in an organization. The stages are pre sales, order processing, shipping and post sales billing stage. Showcasing this set of slides titled Sales To Cash Process With Shipping And Billing Stages Microsoft PDF. The topics addressed in these templates are Order Processing, Shipping, Pre Sales. All the content presented in this PPT design is completely editable. Download it and make adjustments in color, background, font etc. as per your unique business setting.

KPI Dashboard To Track Corporate Sales From Various Channels Information PDF
This slide shows KPI dashboard which can be used by organizations to monitor sales performance of various channels. It includes various metrics such as total revenue, total profit, monthly sales revenue, cost breakup, etc. Showcasing this set of slides titled KPI Dashboard To Track Corporate Sales From Various Channels Information PDF. The topics addressed in these templates are Track Corporate Sales, Various Channels. All the content presented in this PPT design is completely editable. Download it and make adjustments in color, background, font etc. as per your unique business setting.

Transition Plan For Business Management Dashboard Depicting Kpis To Track Sales Performance Template PDF
This slide covers the dashboard that depicts metrics to track company sales performance that focuses on number of sales, cost breakdown, accumulated revenues, incremental sales, etc. From laying roadmaps to briefing everything in detail, our templates are perfect for you. You can set the stage with your presentation slides. All you have to do is download these easy-to-edit and customizable templates. Transition Plan For Business Management Dashboard Depicting Kpis To Track Sales Performance Template PDF will help you deliver an outstanding performance that everyone would remember and praise you for. Do download this presentation today.

Boosting Yearly Business Revenue Annual Sales Goals With Previous Year Performance Ideas PDF
This slide represents of previous years organizational sales performance using various metrics along with expected goals for current year. It includes metrics such as sales growth, customer acquisition cost, sales cycle length, etc. If your project calls for a presentation, then Slidegeeks is your go-to partner because we have professionally designed, easy-to-edit templates that are perfect for any presentation. After downloading, you can easily edit Boosting Yearly Business Revenue Annual Sales Goals With Previous Year Performance Ideas PDF and make the changes accordingly. You can rearrange slides or fill them with different images. Check out all the handy templates.

Branches For Visualization Research And Development Sales Performance Dashboard After Infographics PDF
This slide depicts the dashboard for sales performance after the implementation of visualization research based on revenue, quantity, regional sales. Crafting an eye-catching presentation has never been more straightforward. Let your presentation shine with this tasteful yet straightforward Branches For Visualization Research And Development Sales Performance Dashboard After Infographics PDF template. It offers a minimalistic and classy look that is great for making a statement. The colors have been employed intelligently to add a bit of playfulness while still remaining professional. Construct the ideal Branches For Visualization Research And Development Sales Performance Dashboard After Infographics PDF that effortlessly grabs the attention of your audience Begin now and be certain to wow your customers.
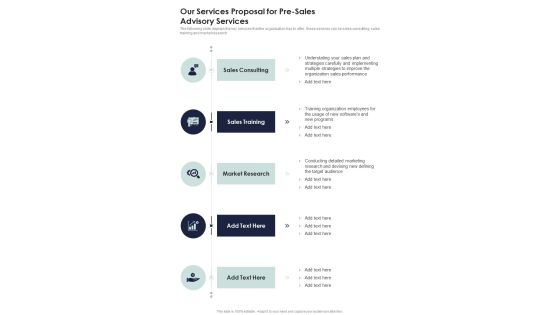
Our Services Proposal For Pre Sales Advisory Services One Pager Sample Example Document
The following slide displays the key services that the organization has to offer, these services can be sales consulting, sales training and market research. Presenting you an exemplary Our Services Proposal For Pre Sales Advisory Services One Pager Sample Example Document. Our one-pager comprises all the must-have essentials of an inclusive document. You can edit it with ease, as its layout is completely editable. With such freedom, you can tweak its design and other elements to your requirements. Download this Our Services Proposal For Pre Sales Advisory Services One Pager Sample Example Document brilliant piece now.

Change Management Process Dashboard Depicting Kpis To Track Sales Performance Introduction PDF
This slide covers the dashboard that depicts metrics to track company sales performance that focuses on number of sales, cost breakdown, accumulated revenues, incremental sales, etc. From laying roadmaps to briefing everything in detail, our templates are perfect for you. You can set the stage with your presentation slides. All you have to do is download these easy-to-edit and customizable templates. Change Management Process Dashboard Depicting Kpis To Track Sales Performance Introduction PDF will help you deliver an outstanding performance that everyone would remember and praise you for. Do download this presentation today.
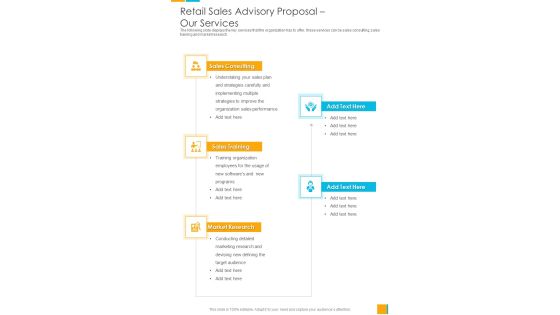
Retail Sales Advisory Proposal Our Services One Pager Sample Example Document
The following slide displays the key services that the organization has to offer, these services can be sales consulting, sales training and market research. Presenting you an exemplary Retail Sales Advisory Proposal Our Services One Pager Sample Example Document. Our one-pager comprises all the must-have essentials of an inclusive document. You can edit it with ease, as its layout is completely editable. With such freedom, you can tweak its design and other elements to your requirements. Download this Retail Sales Advisory Proposal Our Services One Pager Sample Example Document brilliant piece now.
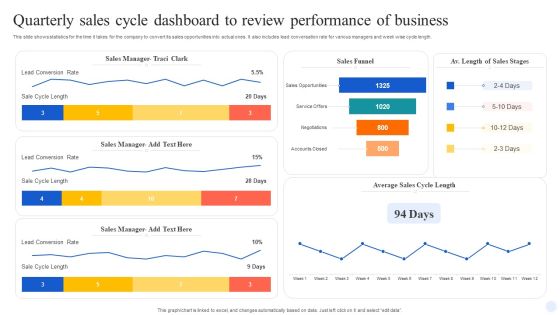
Quarterly Sales Cycle Dashboard To Review Performance Of Business Demonstration PDF
This slide shows statistics for the time it takes for the company to convert its sales opportunities into actual ones. It also includes lead conversation rate for various managers and week wise cycle length. Showcasing this set of slides titled Quarterly Sales Cycle Dashboard To Review Performance Of Business Demonstration PDF. The topics addressed in these templates are Sales Manager, Sales Funnel, Lead Conversion Rate. All the content presented in this PPT design is completely editable. Download it and make adjustments in color, background, font etc. as per your unique business setting.

B2B Sales Employee Representative Performance Scorecard By Different Channels Brochure PDF
This slide provides insight about sales scorecard by various channels which can be used by business to identify best marketing platform for business. It includes channels such as email marketing, event marketing, online marketing and social media marketing. Showcasing this set of slides titled B2B Sales Employee Representative Performance Scorecard By Different Channels Brochure PDF. The topics addressed in these templates are Channels, Description, Website Visit, Conversion, Leads, Sales, Sales Price, Targets . All the content presented in this PPT design is completely editable. Download it and make adjustments in color, background, font etc. as per your unique business setting.

Checklist For Implementation Of Sales And Accounting Control System Professional PDF
The following slide exhibits parameters to consider when assessing internal controls for common business processes. It presents information related to review of sales invoice, order prenumbered, etc. Showcasing this set of slides titled Checklist For Implementation Of Sales And Accounting Control System Professional PDF. The topics addressed in these templates are Sales To Employees, Sales And Account Reporting, Accounting Control System. All the content presented in this PPT design is completely editable. Download it and make adjustments in color, background, font etc. as per your unique business setting.

How Leaders Can Improve Team Effectiveness Sales Team Performance Management KPI Dashboard Infographics PDF
This slide showcases KPI dashboard which can help sales team managers display and review performance rankings. It provides details about weekly sales score, target percentage, total target, sales team members, etc. Unleash your creativity with our How Leaders Can Improve Team Effectiveness Sales Team Performance Management KPI Dashboard Infographics PDF single-slide PPT template. Whether you are a seasoned presenter or a newbie, our editable and visually-stunning template will make your presentations shine. This template is versatile and easy to use. Make your presentations unforgettable with our premium template and leave a lasting impression on your audience.

Financial Feasibility Study Of Business With Sales Break Down Information PDF
This slide showcases financial feasibility that can help organization to access the viability of business venture based upon estimated sales and expenses. Its key components are fixed costs, variable costs and sales breakdown Pitch your topic with ease and precision using this Financial Feasibility Study Of Business With Sales Break Down Information PDF. This layout presents information on Competitor Analysis, Expenses, Estimated Sales. It is also available for immediate download and adjustment. So, changes can be made in the color, design, graphics or any other component to create a unique layout.

Strategic Ecommerce Plan For B2B Enterprises B2b Sales Performance Tracking Dashboard Demonstration PDF
This slide represents metric dashboard to track sales performance on e-commerce website. It cover performance indicators such as sales breakdown, order breakdown, recurring sales etc. Slidegeeks has constructed Strategic Ecommerce Plan For B2B Enterprises B2b Sales Performance Tracking Dashboard Demonstration PDF after conducting extensive research and examination. These presentation templates are constantly being generated and modified based on user preferences and critiques from editors. Here, you will find the most attractive templates for a range of purposes while taking into account ratings and remarks from users regarding the content. This is an excellent jumping-off point to explore our content and will give new users an insight into our top-notch PowerPoint Templates.

Business To Business Digital Channel Management B2B Sales Performance Tracking Dashboard Template PDF
This slide represents metric dashboard to track sales performance on e-commerce website. It cover performance indicators such as sales breakdown, order breakdown, recurring sales etc. Take your projects to the next level with our ultimate collection of Business To Business Digital Channel Management B2B Sales Performance Tracking Dashboard Template PDF. Slidegeeks has designed a range of layouts that are perfect for representing task or activity duration, keeping track of all your deadlines at a glance. Tailor these designs to your exact needs and give them a truly corporate look with your own brand colors they will make your projects stand out from the rest.
E Commerce Operations In B2b B2b Sales Performance Tracking Dashboard Icons PDF
This slide represents metric dashboard to track sales performance on e-commerce website. It cover performance indicators such as sales breakdown, order breakdown, recurring sales etc. Slidegeeks is one of the best resources for PowerPoint templates. You can download easily and regulate E Commerce Operations In B2b B2b Sales Performance Tracking Dashboard Icons PDF for your personal presentations from our wonderful collection. A few clicks is all it takes to discover and get the most relevant and appropriate templates. Use our Templates to add a unique zing and appeal to your presentation and meetings. All the slides are easy to edit and you can use them even for advertisement purposes.

360 Degree Sales Analysis Dashboard After Marketing Plan Implementation Pictures PDF
This template shows the sales analysis dashboard after implementing an effective marketing plan. This slide aims to measure the potential and actual results of the sales target. It includes KPIs such as the number of page views on the website, total sales, subscribers, etc.Pitch your topic with ease and precision using this 360 Degree Sales Analysis Dashboard After Marketing Plan Implementation Pictures PDF. This layout presents information on Lead Generation Life, Conversion Rate. It is also available for immediate download and adjustment. So, changes can be made in the color, design, graphics or any other component to create a unique layout.

Daily Sales Activity Report Format Ppt PowerPoint Presentation Professional Visuals PDF
Presenting this set of slides with name daily sales activity report format ppt powerpoint presentation professional visuals pdf. The topics discussed in these slides are taxable retail, non taxable retail, wholesale, labor, total sales, other income. This is a completely editable PowerPoint presentation and is available for immediate download. Download now and impress your audience.

Corporate Execution And Financial Liability Report Net Sales FY 19 20 Guidelines PDF
Presenting this set of slides with name corporate execution and financial liability report net sales fy 19 20 guidelines pdf. The topics discussed in these slides are net sales, income margin. This is a completely editable PowerPoint presentation and is available for immediate download. Download now and impress your audience.
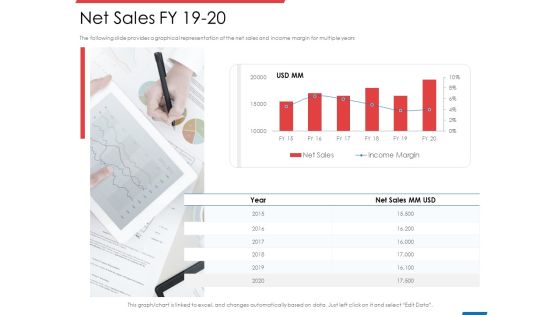
Financial PAR Net Sales FY 19 20 Ppt Styles Grid PDF
Deliver an awe inspiring pitch with this creative financial par net sales fy 19 20 ppt styles grid pdf bundle. Topics like net sales, income margin can be discussed with this completely editable template. It is available for immediate download depending on the needs and requirements of the user.
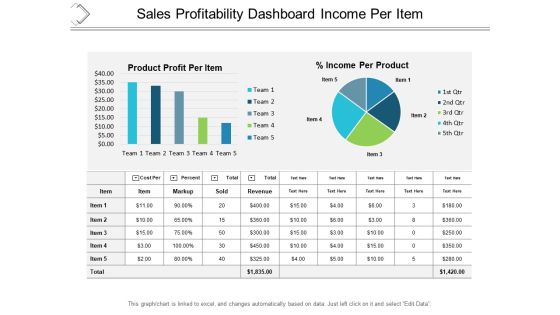
Sales Profitability Dashboard Income Per Item Ppt PowerPoint Presentation Professional Graphic Images
This is a sales profitability dashboard income per item ppt powerpoint presentation professional graphic images. This is a five stage process. The stages in this process are business analytics, ba, organizations data.
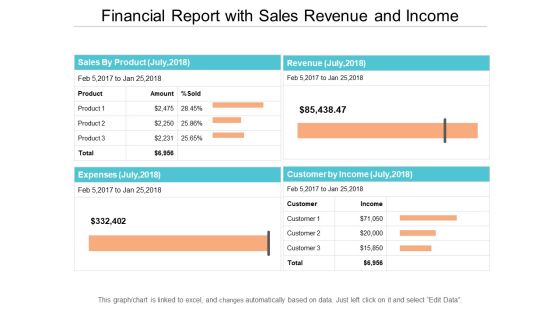
Financial Report With Sales Revenue And Income Ppt PowerPoint Presentation Gallery Brochure
This is a financial report with sales revenue and income ppt powerpoint presentation gallery brochure. This is a four stage process. The stages in this process are accounting review, accounting report, accounting statement.

Company Income Bridge With Sales And Marketing Ppt PowerPoint Presentation Gallery Templates PDF
This slide showcase company revenue bridge with sales and marketing which includes gross revenue, gross income, operating income and taxes. Pitch your topic with ease and precision using this Company Income Bridge With Sales And Marketing Ppt PowerPoint Presentation Gallery Templates PDF. This layout presents information on Gross Revenue, Net Revenue, Rev Adjustments. It is also available for immediate download and adjustment. So, changes can be made in the color, design, graphics or any other component to create a unique layout.

Business Consequences With Lost Sales And Income Ppt PowerPoint Presentation Inspiration Example File PDF
Presenting business consequences with lost sales and income ppt powerpoint presentation inspiration example file pdf to dispense important information. This template comprises six stages. It also presents valuable insights into the topics including lost sales and income, contractual consequences, delay new business plans. This is a completely customizable PowerPoint theme that can be put to use immediately. So, download it and address the topic impactfully.

Commodity Up Selling Product Sales Performance KPI Dashboard Ppt Infographic Template Background PDF
Presenting this set of slides with name commodity up selling product sales performance kpi dashboard ppt infographic template background pdf. The topics discussed in these slides are incremental sales by campaign, cost of goods sold, top product in revenue, online vs in store purchases. This is a completely editable PowerPoint presentation and is available for immediate download. Download now and impress your audience.
 Home
Home