AI PPT Maker
Templates
PPT Bundles
Design Services
Business PPTs
Business Plan
Management
Strategy
Introduction PPT
Roadmap
Self Introduction
Timelines
Process
Marketing
Agenda
Technology
Medical
Startup Business Plan
Cyber Security
Dashboards
SWOT
Proposals
Education
Pitch Deck
Digital Marketing
KPIs
Project Management
Product Management
Artificial Intelligence
Target Market
Communication
Supply Chain
Google Slides
Research Services
 One Pagers
All Categories
-
Home
- Customer Favorites
- Sales Turnover
Sales Turnover
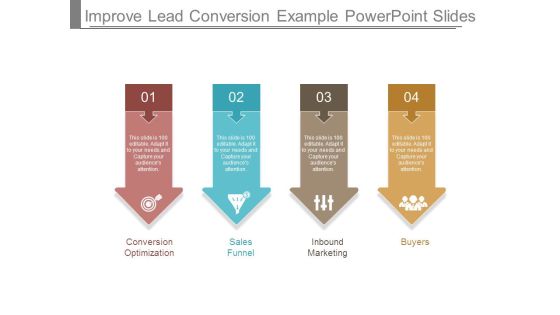
Improve Lead Conversion Example Powerpoint Slides
This is a improve lead conversion example powerpoint slides. This is a four stage process. The stages in this process are conversion optimization, sales funnel, inbound marketing, buyers.

Customer Margin Ppt Presentation Powerpoint
This is a customer margin ppt presentation powerpoint. This is a two stage process. The stages in this process are net sales amt, count per customer.

Interactive Business Intelligence Powerpoint Sample
This is a interactive business intelligence powerpoint sample. This is a three stage process. The stages in this process are sales by category, shipping volume, marketing activity.

Client Review Powerpoint Slide Show
This is a client review powerpoint slide show. This is a two stage process. The stages in this process are john smith, founder ceo, mary smith, sales manager.

Client Recommendations Powerpoint Layout
This is a client recommendations powerpoint layout. This is a two stage process. The stages in this process are john smith founder ceo, mary smith sales manager.
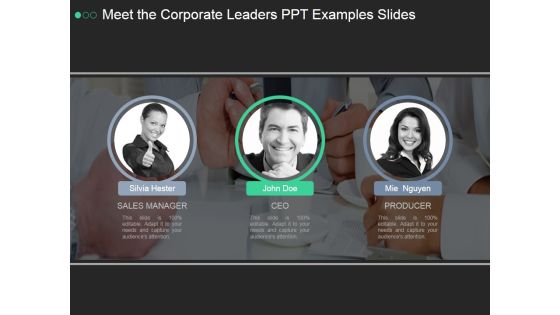
Meet The Corporate Leaders Ppt PowerPoint Presentation Topics
This is a meet the corporate leaders ppt powerpoint presentation topics. This is a three stage process. The stages in this process are sales manager, ceo, producer.

Our Team Ppt PowerPoint Presentation Slides
This is a our team ppt powerpoint presentation slides. This is a four stage process. The stages in this process are busindirector, web designer, sales marketing, editor.

Dashboard Ppt PowerPoint Presentation Files
This is a dashboard ppt powerpoint presentation files. This is a four stage process. The stages in this process are sales rate, progress, profits, safety.
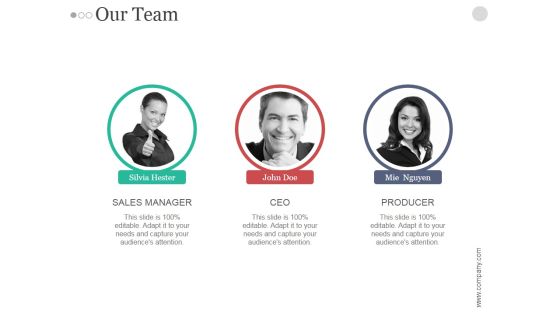
Our Team Ppt PowerPoint Presentation Background Images
This is a our team ppt powerpoint presentation background images. This is a three stage process. The Stages in this process are sales manager, ceo, producer.
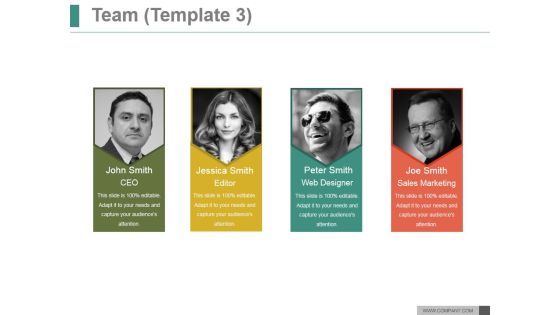
Team Template 3 Ppt PowerPoint Presentation Sample
This is a team template 3 ppt powerpoint presentation sample. This is a four stage process. The stages in this process are ceo, editor, web designer, sales marketing.

Customer Testimonial Ppt PowerPoint Presentation Design Ideas
This is a customer testimonial ppt powerpoint presentation design ideas. This is a two stage process. The stages in this process are sales manager, founder ceo.

Area Trends Ppt PowerPoint Presentation Guidelines
This is a area trends ppt powerpoint presentation guidelines. This is a two stage process. The stages in this process are sales volume, median price, all homes.

Bar Chart Ppt PowerPoint Presentation Microsoft
This is a bar chart ppt powerpoint presentation microsoft. This is a eleven stage process. The stages in this process are sales in percentage, fy, graph, success, business.
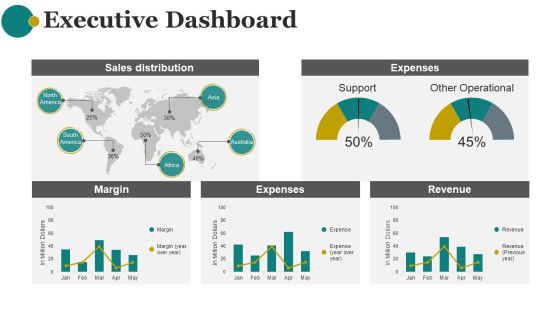
Executive Dashboard Ppt PowerPoint Presentation Graphics
This is a executive dashboard ppt powerpoint presentation graphics. This is a five stage process. The stages in this process are sales distribution, expenses, margin, expenses, revenue.
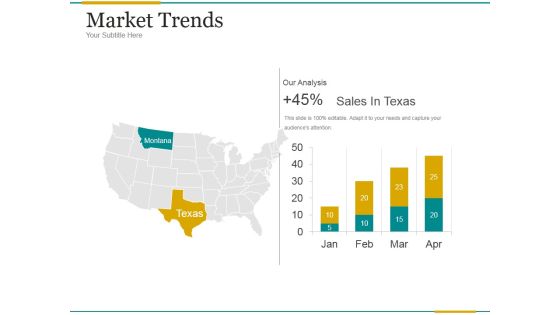
Market Trends Ppt PowerPoint Presentation Samples
This is a market trends ppt powerpoint presentation samples. This is a two stage process. The stages in this process are montana, our analysis, sales in texas.

Area Chart Ppt PowerPoint Presentation Show
This is a area chart ppt powerpoint presentation show. This is a two stage process. The stages in this process are sales in percentage, business, marketing, analysis, success.

Scatter Chart Ppt PowerPoint Presentation Slide Download
This is a scatter chart ppt powerpoint presentation slide download. This is a eight stage process. The stages in this process are dollars, sales in percentage, business, marketing.

Bar Chart Ppt PowerPoint Presentation Styles
This is a bar chart ppt powerpoint presentation styles. This is a nine stage process. The stages in this process are business, management, sales in percentage, growth.
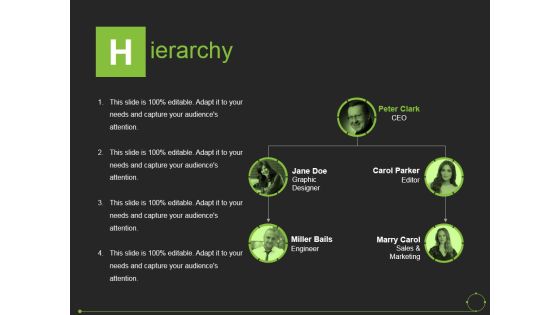
Hierarchy Ppt PowerPoint Presentation Pictures Example
This is a hierarchy ppt powerpoint presentation pictures example. This is a four stage process. The stages in this process are graphic designer, editor, engineer, sales and marketing.

Hierarchy Ppt PowerPoint Presentation Infographics Diagrams
This is a hierarchy ppt powerpoint presentation infographics diagrams. This is a five stage process. The stages in this process are ceo, engineer, sales and marketing, editor, manager.

Customer Testimonials Ppt PowerPoint Presentation Portfolio Demonstration
This is a customer testimonials ppt powerpoint presentation portfolio demonstration. This is a two stage process. The stages in this process are founder ceo, sales manager.
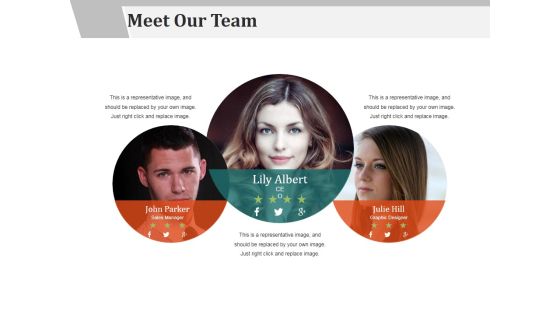
Meet Our Team Ppt PowerPoint Presentation Ideas Shapes
This is a meet our team ppt powerpoint presentation ideas shapes. This is a three stage process. The stages in this process are sales manager, ceo, graphic designer.

Client Testimonials Ppt PowerPoint Presentation Infographics Themes
This is a client testimonials ppt powerpoint presentation infographics themes. This is a two stage process. The stages in this process are sales manager, founder ceo.

Area Chart Ppt PowerPoint Presentation Icon Brochure
This is a area chart ppt powerpoint presentation icon brochure. This is a two stage process. The stages in this process are product, sales in percentage, growth, success.

Bar Graph Ppt PowerPoint Presentation Gallery Inspiration
This is a bar graph ppt powerpoint presentation gallery inspiration. This is a three stage process. The stages in this process are product, sales in percentage, finance, success.

Scatter Chart Ppt PowerPoint Presentation Summary Deck
This is a scatter chart ppt powerpoint presentation summary deck. This is a nine stage process. The stages in this process are product, sales in percentage, growth, success.

Area Chart Ppt PowerPoint Presentation Inspiration Images
This is a area chart ppt powerpoint presentation inspiration images. This is a two stage process. The stages in this process are area chart, product, sales in percentage.
Hierarchy Ppt PowerPoint Presentation Show Example Introduction
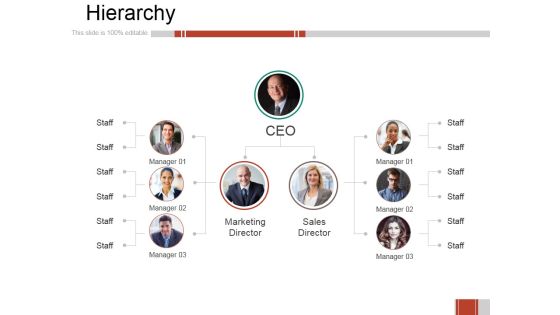
This is a hierarchy ppt powerpoint presentation show example introduction. This is a three stage process. The stages in this process are marketing director, sales director, manager, staff.

Hierarchy Ppt PowerPoint Presentation Inspiration Brochure
This is a hierarchy ppt powerpoint presentation inspiration brochure. This is a three stage process. The stages in this process are ceo, marketing director, sales director, manager, staff.

Area Chart Ppt PowerPoint Presentation Icon Gallery
This is a area chart ppt powerpoint presentation icon gallery. This is a two stage process. The stages in this process are sales in percentage, product, bar graph.

Area Chart Ppt PowerPoint Presentation Pictures Designs
This is a area chart ppt powerpoint presentation pictures designs. This is a two stage process. The stages in this process are product, sales in percentage, growth, success.

Column Chart Ppt PowerPoint Presentation Professional Aids
This is a column chart ppt powerpoint presentation professional aids. This is a two stage process. The stages in this process are product, sales in percentage, financial years.

Line Chart Ppt PowerPoint Presentation Pictures Layout
This is a line chart ppt powerpoint presentation pictures layout. This is a two stage process. The stages in this process are product, financial years, sales in percentage.

Column Chart Ppt PowerPoint Presentation Gallery Layout
This is a column chart ppt powerpoint presentation gallery layout. This is a two stage process. The stages in this process are product, sales in percentage, year.
Line Chart Ppt PowerPoint Presentation Gallery Guide
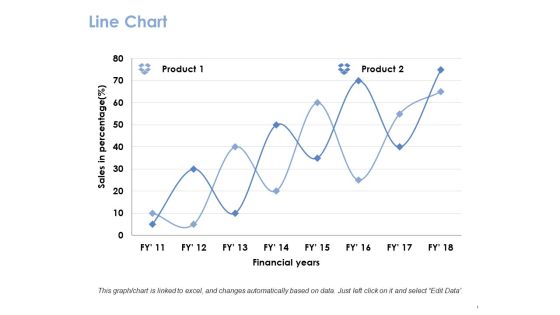
This is a line chart ppt powerpoint presentation gallery guide. This is a two stage process. The stages in this process are product, financial years, sales in percentage.

Area Chart Ppt PowerPoint Presentation Professional Grid
This is a area chart ppt powerpoint presentation professional grid. This is a two stage process. The stages in this process are product, sales in percentage, business.

Bar Graph Ppt PowerPoint Presentation Ideas Display
This is a bar graph ppt powerpoint presentation ideas display. This is a two stage process. The stages in this process are product, sales in percentage, bar graph.

Bubble Chart Ppt PowerPoint Presentation Layouts Demonstration
This is a bubble chart ppt powerpoint presentation icon structure. This is a three stage process. The stages in this process are product, sales in percentage, bubble chart.

Area Graph Ppt PowerPoint Presentation Slides Ideas
This is a area graph ppt powerpoint presentation slides ideas. This is a two stage process. The stages in this process are sales in percentage, financial year, product.

Bar Graph Ppt PowerPoint Presentation Inspiration Slides
This is a bar graph ppt powerpoint presentation inspiration slides. This is a six stage process. The stages in this process are sales in percentage, financial year, product.

Area Chart Ppt PowerPoint Presentation Styles Professional
This is a area chart ppt powerpoint presentation styles professional. This is a two stage process. The stages in this process are sales in percentage, product, area chart.

Area Chart Ppt PowerPoint Presentation Model Guidelines
This is a area chart ppt powerpoint presentation model guidelines. This is a two stage process. The stages in this process are product, area chart, sales in percentage.

Area Chart Ppt PowerPoint Presentation Portfolio Examples
This is a area chart ppt powerpoint presentation portfolio examples. This is a two stage process. The stages in this process are product, area chart, sales in percentage.

Bar Graph Ppt PowerPoint Presentation Infographics Templates
This is a bar graph ppt powerpoint presentation infographics templates. This is a two stage process. The stages in this process are product, financial years, sales in percentage.
Line Chart Ppt PowerPoint Presentation Icon Inspiration
This is a line chart ppt powerpoint presentation icon inspiration. This is a two stage process. The stages in this process are product, financial years, sales in percentage.

Well Being Gymnasium Sector Products And Services Segmentations Pictures PDF
In this slide we are covering gym, health and fitness clubs product and services segments such as membership fees, personal training services, guest admission sales, merchandise sales, spa services and many more. Deliver and pitch your topic in the best possible manner with this well being gymnasium sector products and services segmentations pictures pdf. Use them to share invaluable insights on membership fees, merchandise sales, personal training services, meals and beverages, admission sales and impress your audience. This template can be altered and modified as per your expectations. So, grab it now.

Benefits Of Direct Customer Referral Program To The Company Rules PDF
This slide shows the benefits of implementing Direct Referral Program to the Company such as increased sales revenue, reduced sales expenses, improved lead generation, reduction in sales cycle length, increased ROI etc. Presenting benefits of direct customer referral program to the company rules pdf. to provide visual cues and insights. Share and navigate important information on five stages that need your due attention. This template can be used to pitch topics like refferal program, customer, revenue, reduces sales. In addtion, this PPT design contains high resolution images, graphics, etc, that are easily editable and available for immediate download.

B2B Marketing Content Administration Playbook Prospect Nurturing Content Clipart PDF
This slide provides information regarding sales management activities tracking dashboard to measure closed business, sales pipeline, sales activity by sales rep, month over month growth, forecast by month, etc.Deliver and pitch your topic in the best possible manner with this b2b marketing content administration playbook prospect nurturing content clipart pdf Use them to share invaluable insights on regarding new opportunities, webinar event invitation, local initiatives and impress your audience. This template can be altered and modified as per your expectations. So, grab it now.

Defining Parameters With Our Sdr Checklist Microsoft PDF
Purpose of the following slide is to show the sales development checklist for the organization as it highlights the key parameters and steps that the representative is required to complete while closing the lead. Deliver and pitch your topic in the best possible manner with this defining parameters with our sdr checklist microsoft pdf. Use them to share invaluable insights on lead entry and tag enablement in sales software, completion of sales development document, sales scorecard prepared and impress your audience. This template can be altered and modified as per your expectations. So, grab it now.
Tactics To Achieve Sustainability Pharmaceutical Company Financial Performance For Last Five Years Portrait PDF
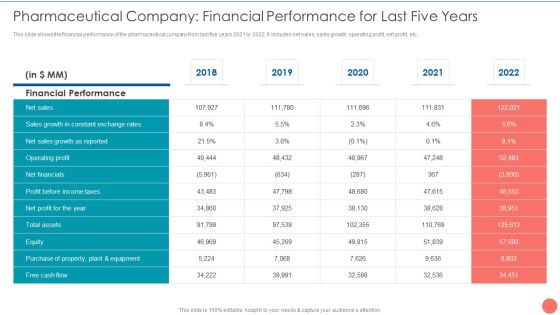
This slide shows the financial performance of the pharmaceutical company from last five years 2021 to 2022. It includes net sales, sales growth, operating profit, net profit, etc. Deliver and pitch your topic in the best possible manner with this Tactics To Achieve Sustainability Pharmaceutical Company Financial Performance For Last Five Years Portrait PDF. Use them to share invaluable insights on Financial Performance Sales, Sales Growth Net, Constant Exchange Rates and impress your audience. This template can be altered and modified as per your expectations. So, grab it now.

Marketing And Operation Planning Dashboard To Drive Better Performance Graphics PDF
This slide covers sales and operations planning dashboard to improve performance. It involves bookings plan, year on year growth, bookings plan per year and total growth and sales made by sales manager. Showcasing this set of slides titled Marketing And Operation Planning Dashboard To Drive Better Performance Graphics PDF. The topics addressed in these templates are Sales Manager, Growth Made, Bookings Plan By Year. All the content presented in this PPT design is completely editable. Download it and make adjustments in color, background, font etc. as per your unique business setting.

Marketing And Operations Dashboard For Distribution Company Guidelines PDF
This slide covers sales and operations dashboard for distribution company. It involves details such as total sales by location, gross margin, monthly sales trends, average revenue and sales by major customers. Pitch your topic with ease and precision using this Marketing And Operations Dashboard For Distribution Company Guidelines PDF. This layout presents information on Gross Margin, Actual Vs Budget, Product. It is also available for immediate download and adjustment. So, changes can be made in the color, design, graphics or any other component to create a unique layout.

Bottom Of The Funnel BOFU Initiatives For B2B Demand Generation Elements PDF
This slide provides information regarding bonus scheme for senior sales management team including VP Sales, Sales Manager, Account Executives, Sales Development Representatives, etc. Presenting Bottom Of The Funnel BOFU Initiatives For B2B Demand Generation Elements PDF to provide visual cues and insights. Share and navigate important information on one stage that need your due attention. This template can be used to pitch topics like Case Studies, Discretionary Offers, Render Comprehensive. In addtion, this PPT design contains high resolution images, graphics, etc, that are easily editable and available for immediate download.

Business Performance Review Dashboard To Measure Overall Business Performance Formats PDF
The following slide highlights a comprehensive quarterly business review QBR dashboard which can be used by the organization to evaluate business performance. The metrics used for review are total revenue, new customers, gross profit, overall costs, sales comparison, sales by different products and top performing channels. Showcasing this set of slides titled Business Performance Review Dashboard To Measure Overall Business Performance Formats PDF. The topics addressed in these templates are Sales Comparison, Sales Product, High Performing. All the content presented in this PPT design is completely editable. Download it and make adjustments in color, background, font etc. as per your unique business setting.

CRM Transformation Toolkit Customer Relationship Business Capability Model Sample PDF
The CRM capability model includes value added functions associated to customer relationship management such as lead management, sales management, sales forecasting, etc. This is a CRM Transformation Toolkit Customer Relationship Business Capability Model Sample PDF template with various stages. Focus and dispense information on six stages using this creative set, that comes with editable features. It contains large content boxes to add your information on topics like Sales Forecasting, Opportunity Management, Sales Management. You can also showcase facts, figures, and other relevant content using this PPT layout. Grab it now.

Org Chart Of Technology Company Ppt PowerPoint Presentation Gallery Slide PDF
Mentioned slide highlights org chart of technology company which can provide details to the management of sales teams, marketing manager, program manager, lead architect, etc. Persuade your audience using this Org Chart Of Technology Company Ppt PowerPoint Presentation Gallery Slide PDF. This PPT design covers three stages, thus making it a great tool to use. It also caters to a variety of topics including Global Sales, Global Sales Director, Sales Teams. Download this PPT design now to present a convincing pitch that not only emphasizes the topic but also showcases your presentation skills.

Quarterly Revenue Analysis And Cost Matrix Of Various E Commerce Products Template PDF
This slide shows the comparison between revenue generated by e-commerce business and cost of sales in each quarter for the financial year 2023. Presenting Quarterly Revenue Analysis And Cost Matrix Of Various E Commerce Products Template PDF to dispense important information. This template comprises two stages. It also presents valuable insights into the topics including Sales Revenue, Cost Sales, Total Sales Revenue. This is a completely customizable PowerPoint theme that can be put to use immediately. So, download it and address the topic impactfully.
Techniques Real Estate Marketing Monitoring Dashboard Guidelines PDF
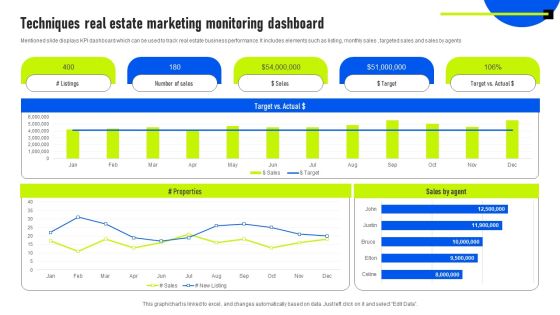
Mentioned slide displays KPI dashboard which can be used to track real estate business performance. It includes elements such as listing, monthly sales , targeted sales and sales by agents. Pitch your topic with ease and precision using this Techniques Real Estate Marketing Monitoring Dashboard Guidelines PDF. This layout presents information on Sales By Agent, Target, Marketing Monitoring Dashboard. It is also available for immediate download and adjustment. So, changes can be made in the color, design, graphics or any other component to create a unique layout.
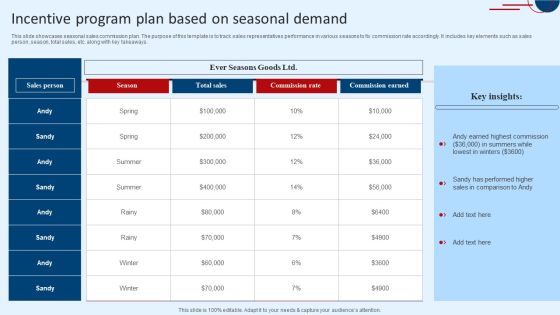
Incentive Program Plan Based On Seasonal Demand Information PDF
This slide showcases seasonal sales commission plan. The purpose of this template is to track sales representatives performance in various seasons to fix commission rate accordingly. It includes key elements such as sales person, season, total sales, etc. along with key takeaways.Showcasing this set of slides titled Incentive Program Plan Based On Seasonal Demand Information PDF. The topics addressed in these templates are Commission Rate, Commission Earned. All the content presented in this PPT design is completely editable. Download it and make adjustments in color, background, font etc. as per your unique business setting.

Commodity Up Selling Financial Highlights Ppt Outline Graphics PDF
Presenting this set of slides with name commodity up selling financial highlights ppt outline graphics pdf. This is a seven stage process. The stages in this process are sales, sales growth, gross margin, operating income, net income, operating cash flow. This is a completely editable PowerPoint presentation and is available for immediate download. Download now and impress your audience.
