Sales Trend
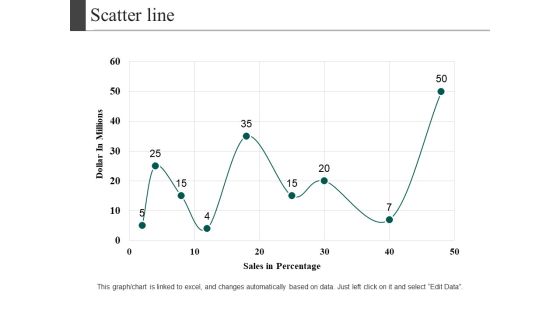
Scatter Line Ppt PowerPoint Presentation Visual Aids Diagrams
This is a scatter line ppt powerpoint presentation visual aids diagrams. This is a one stage process. The stages in this process are dollar in millions, sales in percentage, growth, business, marketing.

Content Ppt PowerPoint Presentation Show Examples
This is a content ppt powerpoint presentation show examples. This is a five stage process. The stages in this process are business overview, sales performance, project updates, competitive analysis, future perspective.

Product Market Share Analysis Powerpoint Presentation Templates
This is a product market share analysis powerpoint presentation templates. This is a four stage process. The stages in this process are increased deal flow, increased sales performance, increased deal visibility, higher deal completion rate, increased market share.
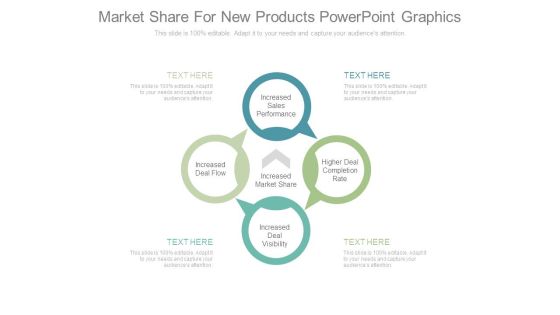
Market Share For New Products Powerpoint Graphics
This is a market share for new products powerpoint graphics. This is a four stage process. The stages in this process are increased sales performance, higher deal completion rate, increased deal visibility, increased deal flow, increased market share.

Market Share Analysis Cycle Ppt Slide Templates
This is a market share analysis cycle ppt slide templates. This is a four stage process. The stages in this process are increased sales performance, higher deal completion rate, increased deal visibility, increased deal flow, increased market share.

Pipeline Quality Template 2 Ppt PowerPoint Presentation Inspiration Show
This is a pipeline quality template 2 ppt powerpoint presentation inspiration show. This is a one stage process. The stages in this process are sales stage, opportunity age, pipeline, quality, line chart.

Bar Graph Ppt PowerPoint Presentation Visual Aids Model
This is a bar graph ppt powerpoint presentation visual aids model. This is a three stage process. The stages in this process are business, strategy, analysis, planning, sales in percentage.
Financial Projection Graph Template 1 Ppt PowerPoint Presentation Icon Summary
This is a financial projection graph template 1 ppt powerpoint presentation icon summary. This is a three stage process. The stages in this process are annual sales forecast, years, business, marketing, management.

Clustered Column Line Ppt PowerPoint Presentation Model Rules
This is a clustered column line ppt powerpoint presentation model rules. This is a four stage process. The stages in this process are financial year, sales in percentage, business, marketing, growth, graph.
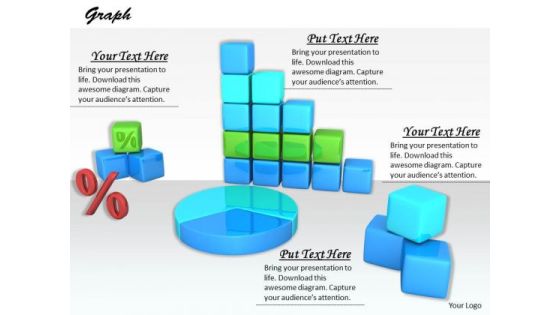
Stock Photo Design For Graphical Representations Of Data PowerPoint Slide
The above image contains a graphic of charts and graphs. Use this professional image in business or sales related presentations. It helps you to explain your plans in all earnest to your colleagues and raise the bar for all.
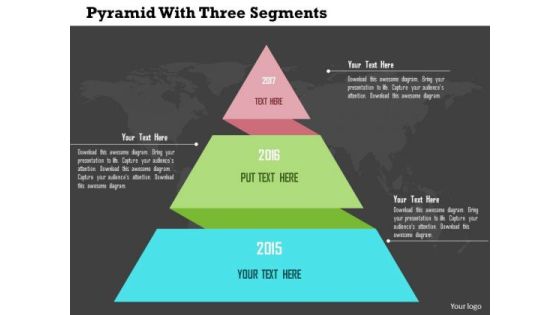
Business Diagram Pyramid With Three Segments Presentation Template
Sales process can be explained with this pyramid diagram. This diagram contains the graphic of pyramid chart with three segments. This diagram provides an effective way of displaying information.

Business Diagram Six Options In Pyramid Presentation Template
Sales process can be explained with this pyramid diagram. This diagram contains the graphic of pyramid chart with six options. This diagram provides an effective way of displaying information.
Five Staged Pyramid With Icons Powerpoint Template
Steps of sales process can be displayed with this business diagram slide. This PowerPoint template contains pyramid chart with business icons. Download this diagram slide to make impressive presentations.
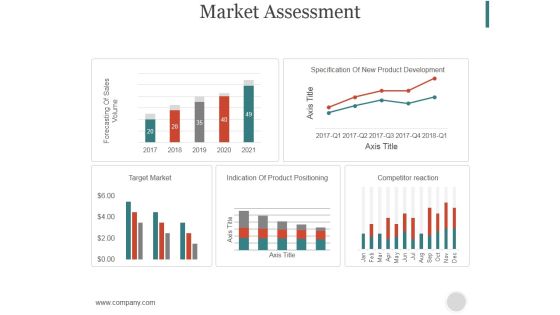
Market Assessment Ppt PowerPoint Presentation Model
This is a market assessment ppt powerpoint presentation model. This is a five stage process. The stages in this process are forecasting of sales volume, specification of new product development, target market, indication of product positioning.

Bar Graph Ppt PowerPoint Presentation Introduction
This is a bar graph ppt powerpoint presentation introduction. This is a eleven stage process. The stages in this process are management, marketing, business, fy, graph, sales in percentage.

Bar Graph Ppt PowerPoint Presentation Portfolio Example
This is a bar graph ppt powerpoint presentation portfolio example. This is a three stage process. The stages in this process are sales in percentage, year, business, product, business, graph.

Clustered Column Ppt PowerPoint Presentation Slides Ideas
This is a clustered column ppt powerpoint presentation slides ideas. This is a two stage process. The stages in this process are sales in percentage, business, marketing, finance, graph.

Stacked Column Ppt PowerPoint Presentation Infographics Samples
This is a stacked column ppt powerpoint presentation infographics samples. This is a two stage process. The stages in this process are product, sales in percentage, business, marketing, graph.

Clustered Column Ppt PowerPoint Presentation Ideas Graphic Tips
This is a clustered column ppt powerpoint presentation ideas graphic tips. This is a two stage process. The stages in this process are financial year, sales in percentage, product, graph, business.
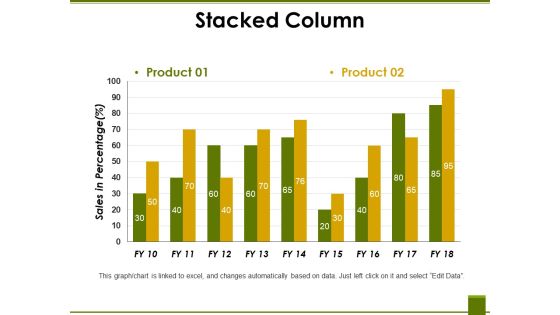
Stacked Column Ppt PowerPoint Presentation Professional Vector
This is a stacked column ppt powerpoint presentation professional vector. This is a two stage process. The stages in this process are product, sales in percentage, business, marketing, graph.

Clustered Column Ppt PowerPoint Presentation Portfolio Smartart
This is a clustered column ppt powerpoint presentation portfolio smartart. This is a two stage process. The stages in this process are financial year, product, sales in percentage, finance, business, graph.

Clustered Column Ppt PowerPoint Presentation Pictures Mockup
This is a clustered column ppt powerpoint presentation pictures mockup. This is a two stage process. The stages in this process are product, sales in percentage, financial year, graph, business.

Clustered Column Ppt PowerPoint Presentation Slides Smartart
This is a clustered column ppt powerpoint presentation slides smartart. This is a two stage process. The stages in this process are product, sales in percentage, financial year, bar graph.

Clustered Column Ppt PowerPoint Presentation File Graphics
This is a clustered column ppt powerpoint presentation file graphics. This is a two stage process. The stages in this process are product, financial year, sales in percentage, graph, growth.

clustered column line ppt powerpoint presentation ideas example
This is a clustered column line ppt powerpoint presentation ideas example. This is a three stage process. The stages in this process are sales in percentage, business, marketing, finance, graph.

Bar Graph Ppt PowerPoint Presentation File Slides
This is a bar graph ppt powerpoint presentation file slides. This is a three stage process. The stages in this process are product, sales in percentage, bar graph, growth, success.

Clustered Column Ppt PowerPoint Presentation Show Graphics
This is a clustered column ppt powerpoint presentation show graphics. This is a two stage process. The stages in this process are financial year, sales in percentage, business, marketing, graph.

Bar Diagram Ppt PowerPoint Presentation Gallery Structure
This is a bar diagram ppt powerpoint presentation gallery structure. This is a three stage process. The stages in this process are financial in years, sales in percentage, bar graph, growth, success.

Bar Diagram Ppt PowerPoint Presentation Pictures Background Image
This is a bar diagram ppt powerpoint presentation pictures background image. This is a three stage process. The stages in this process are financial in years, sales in percentage, bar graph, growth, success.

Clustered Column Ppt PowerPoint Presentation Gallery Format
This is a clustered column ppt powerpoint presentation gallery format. This is a two stage process. The stages in this process are business, marketing, graph, financial year, sales in percentage.

Bar Graph Ppt PowerPoint Presentation Layouts Influencers
This is a bar graph ppt powerpoint presentation layouts influencers. This is a two stage process. The stages in this process are business, marketing, in bar graph, sales in percentage, finance.

Bar Graph Ppt PowerPoint Presentation Portfolio Slide Portrait
This is a bar graph ppt powerpoint presentation portfolio slide portrait. This is a three stage process. The stages in this process are product, sales in percentage, bar graph, growth, success.

Scatter Line Ppt PowerPoint Presentation Styles Graphics Pictures
This is a scatter line ppt powerpoint presentation styles graphics pictures. This is a one stage process. The stages in this process are product, dollar in millions, sales in percentage.

Scatter Line Ppt PowerPoint Presentation Infographics Background Images
This is a scatter line ppt powerpoint presentation infographics background images. This is a one stage process. The stages in this process are dollar in millions, product, sales in percentage.

Brand Development Strategy Roadmap Ppt Powerpoint Presentation Styles Background Designs
This is a brand development strategy roadmap ppt powerpoint presentation styles background designs. This is a two stage process. The stages in this process are trade marketing strategy, trade promotion strategy, trade sales plan.

Formulating Competitive Plan Of Action For Effective Product Leadership Measuring Business Unit Slides PDF
This slide covers dashboard that shows business unit performance such as new customers, average weekly sales revenue, sales revenues, profits, customer lifetime value, etc. Deliver an awe inspiring pitch with this creative formulating competitive plan of action for effective product leadership measuring business unit slides pdf bundle. Topics like average revenue per unit, customer lifetime value, customer acquisition cost can be discussed with this completely editable template. It is available for immediate download depending on the needs and requirements of the user.

Employee Rewards Incentive Programs Chart Slides PDF
This slide represents employee rewards incentive policy charts illustrating cash incentive, performance incentive, sales commission, awards and profit sharing plan. Pitch your topic with ease and precision using this Employee Rewards Incentive Programs Chart Slides PDF. This layout presents information on Sales Commission, Team Performance, Individual Performance. It is also available for immediate download and adjustment. So, changes can be made in the color, design, graphics or any other component to create a unique layout.

Customer Services Ppt Examples Professional
This is a customer services ppt examples professional. This is a five stage process. The stages in this process are customer services, quality control processes, sales marketing, product features And performance, technology and innovation.
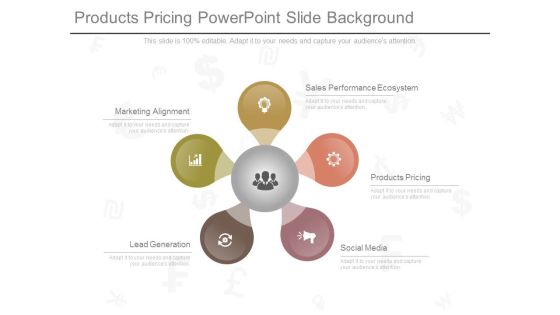
Products Pricing Powerpoint Slide Background
This is a products pricing powerpoint slide background. This is a five stage process. The stages in this process are marketing alignment, sales performance ecosystem, products pricing, social media, lead generation.
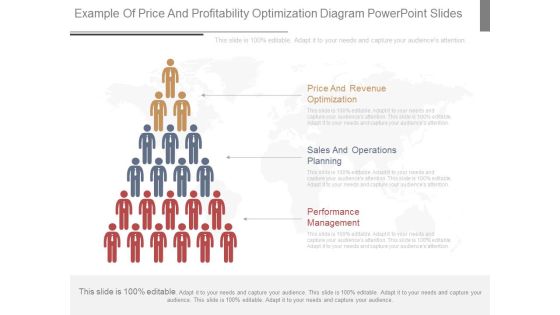
Example Of Price And Profitability Optimization Diagram Powerpoint Slides
This is a example of price and profitability optimization diagram powerpoint slides. This is a three stage process. The stages in this process are price and revenue optimization, sales and operations planning, performance management.

Business Model Canvas Process Ppt PowerPoint Presentation Examples
This is a business model canvas process ppt powerpoint presentation examples. This is a eight stage process. The stages in this process are graceful exit, pitfall avoidance, innovation factor, changing competitive, sales performance model.

Business Model Canvas Ppt PowerPoint Presentation Designs
This is a business model canvas ppt powerpoint presentation designs. This is a three stage process. The stages in this process are profit models, unique value proposition, market attractiveness, sales performance model, sustainability.

Business Model Canvas Template 1 Ppt PowerPoint Presentation Pictures Layouts
This is a business model canvas template 1 ppt powerpoint presentation pictures layouts. This is a eight stage process. The stages in this process are market attractiveness, unique value proposition, profit models, sales performance model, changing competitive.

Competitive Analysis Ppt PowerPoint Presentation Ideas Design Ideas
This is a competitive analysis ppt powerpoint presentation ideas design ideas. This is a three stage process. The stages in this process are competitors market positioning, competitors sales performance, competitor analysis.

Content Ppt PowerPoint Presentation Infographics
This is a content ppt powerpoint presentation infographics. This is a five stage process. The stages in this process are business overview, sales performance, project updates, competitive analysis, future perspective.

Competitive Analysis Ppt PowerPoint Presentation Slides Grid
This is a competitive analysis ppt powerpoint presentation slides grid. This is a three stage process. The stages in this process are competitors market positioning, competitors sales performance, competitor analysis, business, icons.

Competitive Analysis Ppt PowerPoint Presentation Inspiration Elements
This is a competitive analysis ppt powerpoint presentation inspiration elements. This is a three stage process. The stages in this process are competitors market positioning, competitor analysis, competitors sales performance.

Content Ppt PowerPoint Presentation Gallery Influencers
This is a content ppt powerpoint presentation gallery influencers. This is a five stage process. The stages in this process are business overview, sales performance, project updates, competitive analysis, future perspective.

Competitive Analysis Ppt PowerPoint Presentation Styles Grid
This is a competitive analysis ppt powerpoint presentation styles grid. This is a three stage process. The stages in this process are competitors market positioning, competitor analysis, competitors sales performance.

Competitive Analysis Ppt PowerPoint Presentation Professional Skills
This is a competitive analysis ppt powerpoint presentation professional skills. This is a three stage process. The stages in this process are competitors sales performance, competitor analysis, competitors market positioning.

Content Ppt PowerPoint Presentation Infographic Template Objects
This is a content ppt powerpoint presentation infographic template objects. This is a five stage process. The stages in this process are business overview, sales performance, project updates, competitive analysis, future perspective.

Online Product Planning Ecommerce Management KPI Dashboard Ppt Layouts Background Image PDF
Presenting this set of slides with name online product planning ecommerce management kpi dashboard ppt layouts background image pdf. The topics discussed in these slides are total volume sold this month, average purchase value, growth in average purchase value, growth in volume sold this month, growth in sales this month, total sales this month. This is a completely editable PowerPoint presentation and is available for immediate download. Download now and impress your audience.
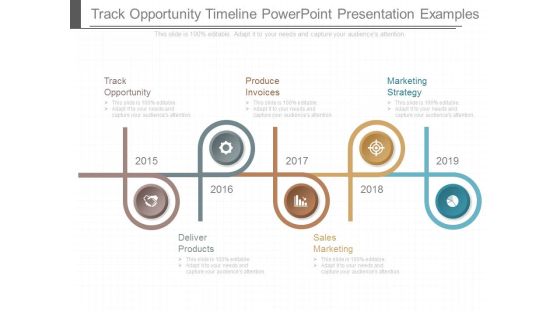
Track Opportunity Timeline Powerpoint Presentation Examples
This is a track opportunity timeline powerpoint presentation examples. This is a five stage process. The stages in this process are track opportunity, produce invoices, marketing strategy, deliver products, sales marketing.
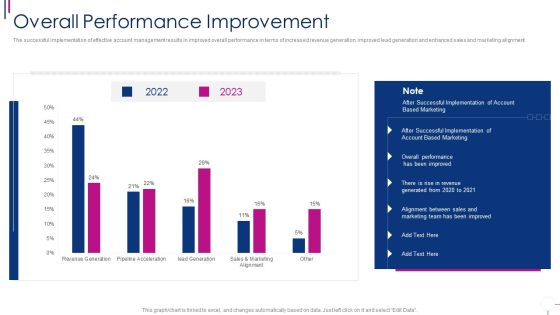
Successful Account Oriented Marketing Techniques Overall Performance Improvement Pictures PDF
The successful implementation of effective account management results in improved overall performance in terms of increased revenue generation, improved lead generation and enhanced sales and marketing alignment. Deliver and pitch your topic in the best possible manner with this successful account oriented marketing techniques overall performance improvement pictures pdf. Use them to share invaluable insights on revenue, marketing, sales, implementation and impress your audience. This template can be altered and modified as per your expectations. So, grab it now.
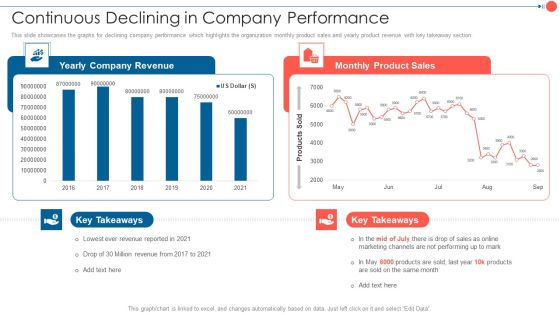
Youtube Advertising Techniques Continuous Declining In Company Performance Slides PDF
This slide showcases the graphs for declining company performance which highlights the organization monthly product sales and yearly product revenue with key takeaway section. Deliver an awe inspiring pitch with this creative Youtube Advertising Techniques Continuous Declining In Company Performance Slides PDF bundle. Topics like Yearly Company Revenue, Monthly Product Sales, 2016 To 2021 can be discussed with this completely editable template. It is available for immediate download depending on the needs and requirements of the user.
Optimizing Logistics Management Process Dashboard To Track Inventory Management Status Icons PDF
This slide focuses on the dashboard to track inventory management status which covers annual stock conversion into sales, inventory turnover, inventory carrying cost and accuracy. Deliver an awe inspiring pitch with this creative optimizing logistics management process dashboard to track inventory management status icons pdf bundle. Topics like inventory carrying cost, inventory turnover, inventory accuracy, stock conversion into sales can be discussed with this completely editable template. It is available for immediate download depending on the needs and requirements of the user.

Clustered Column Ppt PowerPoint Presentation Icon Design Inspiration
This is a clustered column ppt powerpoint presentation icon design inspiration. This is a two stage process. The stages in this process are product, financial year, sales in percentage, clustered column.

Clustered Column Line Ppt PowerPoint Presentation File Examples
This is a clustered column line ppt powerpoint presentation file examples. This is a three stage process. The stages in this process are sales in percentage, product, business, marketing, success.

Bar Graph Ppt PowerPoint Presentation Infographic Template Template
This is a bar graph ppt powerpoint presentation infographic template template. This is a three stage process. The stages in this process are bar graph, sales in percentage, product, planning, business.

Clustered Column Line Ppt PowerPoint Presentation Model Images
This is a clustered column line ppt powerpoint presentation model images. This is a four stage process. The stages in this process are sales in percentage, product, business, marketing, bar graph.

 Home
Home