AI PPT Maker
Templates
PPT Bundles
Design Services
Business PPTs
Business Plan
Management
Strategy
Introduction PPT
Roadmap
Self Introduction
Timelines
Process
Marketing
Agenda
Technology
Medical
Startup Business Plan
Cyber Security
Dashboards
SWOT
Proposals
Education
Pitch Deck
Digital Marketing
KPIs
Project Management
Product Management
Artificial Intelligence
Target Market
Communication
Supply Chain
Google Slides
Research Services
 One Pagers
All Categories
-
Home
- Customer Favorites
- Sales Trend
Sales Trend
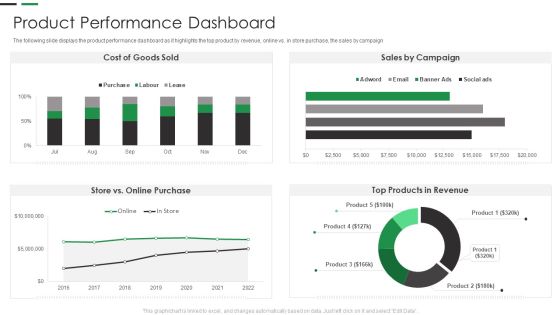
Evaluating New Commodity Impact On Market Product Performance Dashboard Elements PDF
The following slide displays the product performance dashboard as it highlights the top product by revenue, online vs. in store purchase, the sales by campaign Deliver an awe inspiring pitch with this creative Evaluating New Commodity Impact On Market Product Performance Dashboard Elements PDF bundle. Topics like Sales Campaign, Products In Revenue, Online Purchase can be discussed with this completely editable template. It is available for immediate download depending on the needs and requirements of the user.
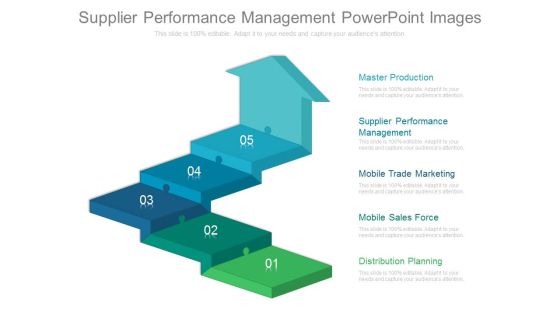
Supplier Performance Management Powerpoint Images
This is a supplier performance management powerpoint images. This is a five stage process. The stages in this process are master production, supplier performance management, mobile trade marketing, mobile sales force, distribution planning.

Online Promotional Techniques To Increase Brand Promotion Metric Dashboard For Performance Evaluation Brochure PDF
This slide represents brand promotion dashboard. It includes sales quantity, return quantity, cost of goods, return amount etc.Deliver an awe inspiring pitch with this creative Online Promotional Techniques To Increase Brand Promotion Metric Dashboard For Performance Evaluation Brochure PDF bundle. Topics like Sales Quantity, Return Quantity, Net Quantity can be discussed with this completely editable template. It is available for immediate download depending on the needs and requirements of the user.

Enterprise Performance Management Powerpoint Slide
This is a enterprise performance management powerpoint slide. This is a five stage process. The stages in this process are enterprise performance management, service management, human capital management, sales management, customer relationship management.

Column Chart Ppt PowerPoint Presentation Outline Styles
This is a column chart ppt powerpoint presentation outline styles. This is a two stage process. The stages in this process are sales in percentage, financial year in, business, marketing, graph.

Line Chart Ppt PowerPoint Presentation Outline Ideas
This is a line chart ppt powerpoint presentation outline ideas. This is a two stage process. The stages in this process are business, marketing, financial years, sales in percentage, strategy.

Bar Chart Ppt PowerPoint Presentation Outline Introduction
This is a bar chart ppt powerpoint presentation outline introduction. This is a one stage process. The stages in this process are sales in percentage, product, business, financial years, graph.
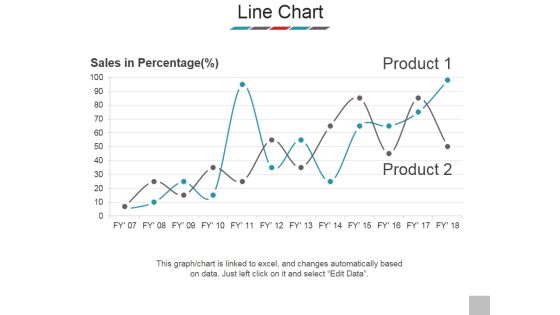
Line Chart Ppt PowerPoint Presentation Outline Samples
This is a line chart ppt powerpoint presentation outline samples. This is a two stage process. The stages in this process are sales in percentage, product, business, marketing, success.
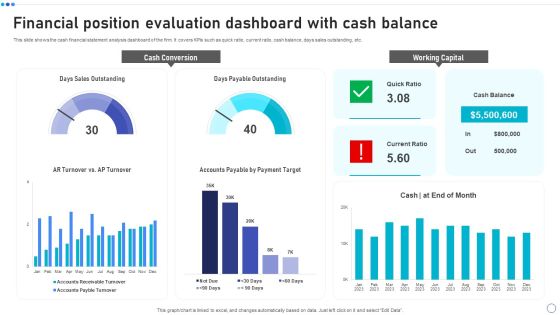
Financial Position Evaluation Dashboard With Cash Balance Rules PDF
This slide shows the cash financial statement analysis dashboard of the firm. It covers KPIs such as quick ratio, current ratio, cash balance, days sales outstanding, etc. Showcasing this set of slides titled Financial Position Evaluation Dashboard With Cash Balance Rules PDF. The topics addressed in these templates are Cash Conversion, Working Capital, Days Sales Outstanding. All the content presented in this PPT design is completely editable. Download it and make adjustments in color, background, font etc. as per your unique business setting.
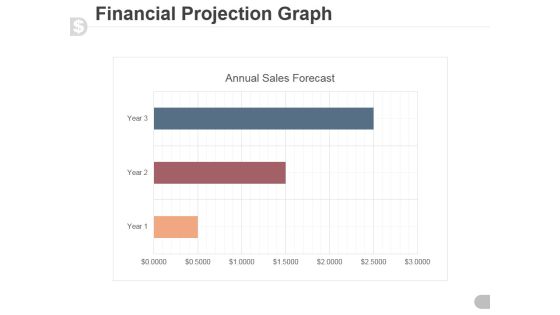
Financial Projection Graph Template 2 Ppt PowerPoint Presentation Samples
This is a financial projection graph template 2 ppt powerpoint presentation samples. This is a three stage process. The stages in this process are annual sales forecast, timeline, marketing, graph, management.

Bar Chart Ppt PowerPoint Presentation Outline Backgrounds
This is a bar chart ppt powerpoint presentation outline backgrounds. This is a one stage process. The stages in this process are sales in percentage, financial years, product, bar graph, finance.
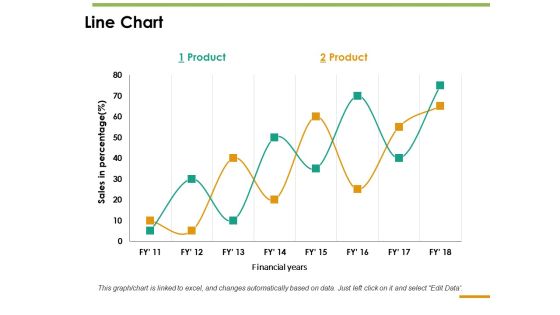
Line Chart Ppt PowerPoint Presentation Inspiration Guide
This is a line chart ppt powerpoint presentation inspiration guide. This is a two stage process. The stages in this process are line chart, sales in percentage, product, financial years.

States Performance Analysis Good Ppt Example
This is a states performance analysis good ppt example. This is a four stage process. The stages in this process are strategy and states performance analysis, sales activity reports, solution design education, customer interaction.

Combo Chart Ppt PowerPoint Presentation Shapes
This is a combo chart ppt powerpoint presentation shapes. This is a eight stage process. The stages in this process are combo chart, business, marketing, sales in percentage, bar graph.
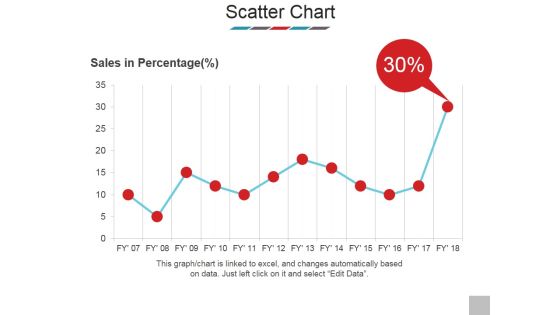
Scatter Chart Ppt PowerPoint Presentation Model Show
This is a scatter chart ppt powerpoint presentation model show. This is a one stage process. The stages in this process are sales in percentage, scatter chart, business, bar graph, marketing.

Column Chart Ppt PowerPoint Presentation Slides Smartart
This is a column chart ppt powerpoint presentation slides smartart. This is a two stage process. The stages in this process are sales in percentage, financial year in, business, growth, strategy.

Combo Chart Ppt PowerPoint Presentation Summary Layouts
This is a combo chart ppt powerpoint presentation summary layouts. This is a eight stage process. The stages in this process are product, sales in percentage, in years, in price, graph.

Scatter Chart Ppt PowerPoint Presentation Slides Summary
This is a scatter chart ppt powerpoint presentation slides summary. This is a nine stage process. The stages in this process are sales in percentage, growth, graph, business, marketing.
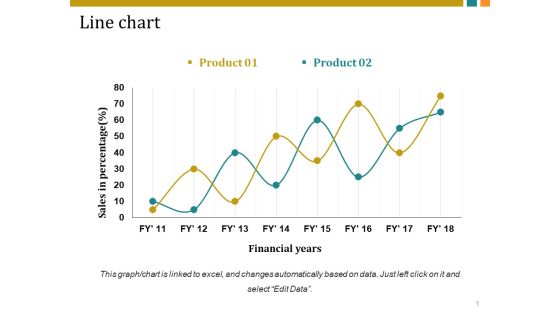
Line Chart Ppt PowerPoint Presentation Inspiration Vector
This is a line chart ppt powerpoint presentation inspiration vector. This is a two stage process. The stages in this process are sales in percentage, financial years, business, marketing, growth.

Line Chart Ppt PowerPoint Presentation Pictures Templates
This is a line chart ppt powerpoint presentation pictures templates. This is a two stage process. The stages in this process are sales in percentage, financial years, business, marketing, growth.

Line Chart Ppt PowerPoint Presentation Styles Themes
This is a line chart ppt powerpoint presentation styles themes. This is a two stage process. The stages in this process are business, marketing, financial years, sales in percentage.

Line Chart Ppt PowerPoint Presentation Ideas Example
This is a line chart ppt powerpoint presentation ideas example. This is a two stage process. The stages in this process are sales in percentage, bar graph, business, marketing, growth.

Bar Chart Ppt PowerPoint Presentation File Slide
This is a bar chart ppt powerpoint presentation file slide. This is a one stage process. The stages in this process are sales in percentage financial years, business, marketing, strategy, graph.
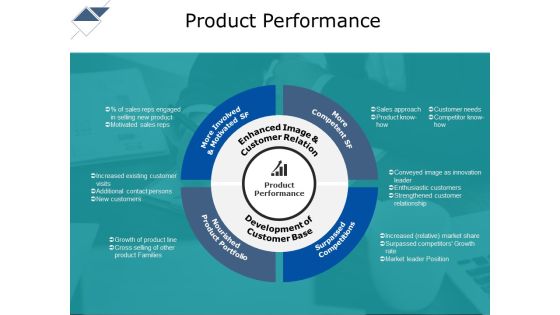
Product Performance Ppt PowerPoint Presentation Styles Pictures
This is a product performance ppt powerpoint presentation styles pictures. This is a four stage process. The stages in this process are product performance, sales approach, product, customer needs.
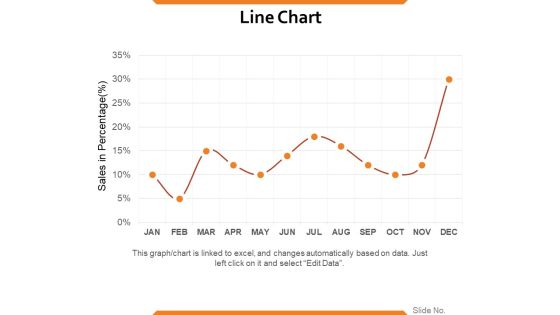
Line Chart Ppt PowerPoint Presentation Summary Samples
This is a line chart ppt powerpoint presentation summary samples. This is a one stage process. The stages in this process are sales in percentage, percentage, business, marketing, strategy.

Content Marketing Performance Ppt PowerPoint Presentation Guidelines
This is a content marketing performance ppt powerpoint presentation guidelines. This is a eight stage process. The stages in this process are conversion rate, quality of leads, number of leads, sales revenue, website traffic.

Bar Chart Ppt PowerPoint Presentation Icon Layout
This is a bar chart ppt powerpoint presentation icon layout. This is a one stage process. The stages in this process are sales in percentage, financial years, bar chart, finance, marketing.

Column Chart Ppt PowerPoint Presentation Ideas Vector
This is a column chart ppt powerpoint presentation ideas vector. This is a two stage process. The stages in this process are column chart, product, financial years, sales in percentage, growth.

Line Chart Ppt PowerPoint Presentation Professional Grid
This is a line chart ppt powerpoint presentation professional grid. This is a two stage process. The stages in this process are sales in percentage, financial years, product, line chart.
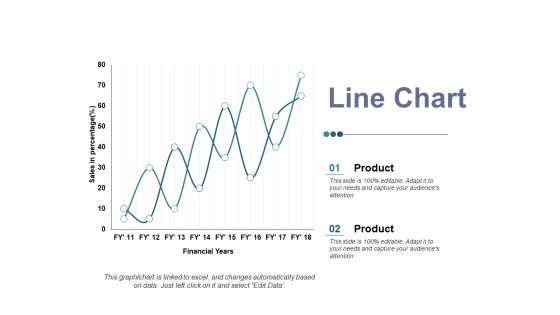
Line Chart Ppt PowerPoint Presentation Ideas Elements
This is a line chart ppt powerpoint presentation ideas elements. This is a two stage process. The stages in this process are product, sales in percentage, financial year, business, line chart.

Bar Chart Ppt PowerPoint Presentation Professional Files
This is a bar chart ppt powerpoint presentation professional files. This is a seven stage process. The stages in this process are bar chart, product, sales in percentage, financial years.

Competitive Analysis Matrix Chart Ppt PowerPoint Presentation Gallery
This is a competitive analysis matrix chart ppt powerpoint presentation gallery. This is a seven stage process. The stages in this process are our business, product quality, product fidelity, after sales service, customer service, price, shipping speed.

Bar Chart Ppt PowerPoint Presentation Layouts Pictures
This is a bar chart ppt powerpoint presentation layouts pictures. This is a three stage process. The stages in this process are bar graph, product, sales in percentage, business, marketing.

Bar Chart Ppt PowerPoint Presentation Styles Outfit
This is a bar chart ppt powerpoint presentation styles outfit. This is a Seven stage process. The stages in this process are sales in percentage, financial years, graph, business.

Bar Chart Ppt PowerPoint Presentation Portfolio Diagrams
This is a bar chart ppt powerpoint presentation portfolio diagrams. This is a three stage process. The stages in this process are sales in percentage, business, marketing, graph, finance.

Column Chart Ppt PowerPoint Presentation Gallery Background
This is a column chart ppt powerpoint presentation gallery background. This is a two stage process. The stages in this process are product, sales in percentage, financial year, graph, success.

Bar Chart Ppt PowerPoint Presentation Icon Information
This is a bar chart ppt powerpoint presentation icon information. This is a one stage process. The stages in this process are product, sales in percentage, financial years, bar graph, growth.

Column Chart Ppt PowerPoint Presentation Layouts Tips
This is a column chart ppt powerpoint presentation layouts tips. This is a six stage process. The stages in this process are sales in percentage, financial year, bar graph, growth, success.

Bar Chart Ppt PowerPoint Presentation Diagram Lists
This is a bar chart ppt powerpoint presentation diagram lists. This is a two stage process. The stages in this process are business, marketing, financial years, sales in percentage, graph.

Column Chart Ppt PowerPoint Presentation Icon Guide
This is a column chart ppt powerpoint presentation icon guide. This is a two stage process. The stages in this process are business, year, sales in percentage, marketing, graph.

Bar Chart Ppt PowerPoint Presentation Model Sample
This is a bar chart ppt powerpoint presentation model sample. This is a two stage process. The stages in this process are sales in percentage, business, marketing, graph, percentage, year.

Column Chart Ppt PowerPoint Presentation Show Structure
This is a column chart ppt powerpoint presentation show structure. This is a two stage process. The stages in this process are business, financial year in, sales in percentage, marketing, graph.

Bar Chart Ppt PowerPoint Presentation Summary Themes
This is a bar chart ppt powerpoint presentation summary themes. This is a three stage process. The stages in this process are financial years, sales in percentage, business, marketing, graph.

Bar Chart Ppt PowerPoint Presentation Layouts Template
This is a bar chart ppt powerpoint presentation layouts template. This is a two stage process. The stages in this process are financial year, sales in percentage, business, marketing, finance.

Scatter Chart Template 1 Ppt PowerPoint Presentation Outline Gridlines
This is a scatter chart template 1 ppt powerpoint presentation outline gridlines. This is a one stage process. The stages in this process are scatter chart, sales in percentage, business, marketing, growth.

Competitive Analysis Matrix Chart Ppt PowerPoint Presentation Inspiration
This is a competitive analysis matrix chart ppt powerpoint presentation inspiration. This is a six stage process. The stages in this process are product quality, product fidelity, after sales service, customer service, price, shipping speed.

Line Chart Ppt PowerPoint Presentation Infographics Infographics
This is a line chart ppt powerpoint presentation infographics infographics. This is a two stage process. The stages in this process are product, sales in percentage, financial year, line chart, finance.

Line Chart Ppt PowerPoint Presentation Gallery Rules
This is a line chart ppt powerpoint presentation gallery rules. This is a two stage process. The stages in this process are financial years, product, sales in percentage, line chart, growth.

Bar Chart Ppt PowerPoint Presentation Inspiration Demonstration
This is a bar chart ppt powerpoint presentation inspiration demonstration. This is a two stage process. The stages in this process are bar chart, financial years, sales in percentage, product, finance.

Line Chart Ppt PowerPoint Presentation Gallery Templates
This is a line chart ppt powerpoint presentation gallery templates. This is a two stage process. The stages in this process are product, financial years, sales in percentage, line chart.

Bar Chart Ppt PowerPoint Presentation Model Picture
This is a bar chart ppt powerpoint presentation model picture. This is a two stage process. The stages in this process are product, sales in percentage, financial years, bar chart.

Column Chart Ppt PowerPoint Presentation Slides Show
This is a column chart ppt powerpoint presentation slides show. This is a two stage process. The stages in this process are column chart, product, sales in percentage, financial year, growth.

Business Telecommunication Process Flow Chart Powerpoint Slides
This is a business telecommunication process flow chart powerpoint slides. This is a eight stage process. The stages in this process are business opportunity, market analysis, new product development, costing and projection, product support, marketing, sales and distribution, product evaluation.
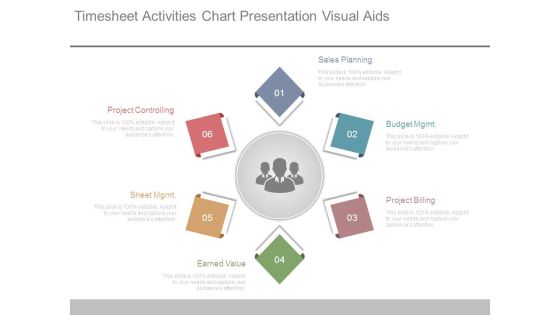
Timesheet Activities Chart Presentation Visual Aids
This is a timesheet activities chart presentation visual aids. This is a six stage process. The stages in this process are sales planning, budget mgmt, project billing, earned value, sheet mgmt, project controlling.
Scatter Chart Ppt PowerPoint Presentation Icon Elements
This is a scatter chart ppt powerpoint presentation icon elements. This is a nine stage process. The stages in this process are dollar in billions, sales in percentage, business, success.

Bar Chart Ppt PowerPoint Presentation Icon Demonstration
This is a bar chart ppt powerpoint presentation icon demonstration. This is a seven stage process. The stages in this process are product, sales in percentage, financial year, graph.

Line Chart Ppt PowerPoint Presentation Layouts Example
This is a line chart ppt powerpoint presentation layouts example. This is a two stage process. The stages in this process are sales in percentage, product, financial years, growth, success.

Line Chart Ppt PowerPoint Presentation Show Guide
This is a line chart ppt powerpoint presentation show guide. This is a two stage process. The stages in this process are product, sales in percentage, financial years, growth, success.
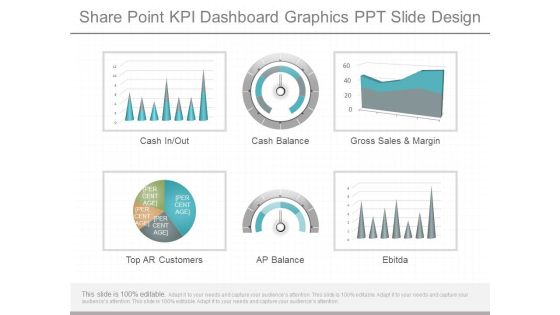
Share Point Kpi Dashboard Graphics Ppt Slide Design
This is a share point kpi dashboard graphics ppt slide design. This is a six stage process. The stages in this process are cash in out, cash balance, gross sales and margin, top ar customers, ap balance, ebitda.

Team Member Professional Skills Dashboard Powerpoint Slide Backgrounds
This is a team member professional skills dashboard powerpoint slide backgrounds. This is a one stage process. The stages in this process are personal skills, sales marketing, business, management, presentation.

Key Performance Indicators Template 2 Ppt Powerpoint Presentation Model Background
This is a key performance indicators template 2 ppt powerpoint presentation model background. This is a five stage process. The stages in this process are day sales outstanding, cost of goods sold, net promoter score.

Customer Awareness Process Flow Chart Ppt Presentation Deck
This is a customer awareness process flow chart ppt presentation deck. This is a seven stage process. The stages in this process are loyalty, public relation, sales promotion, advertising, purchase, preference, awareness.
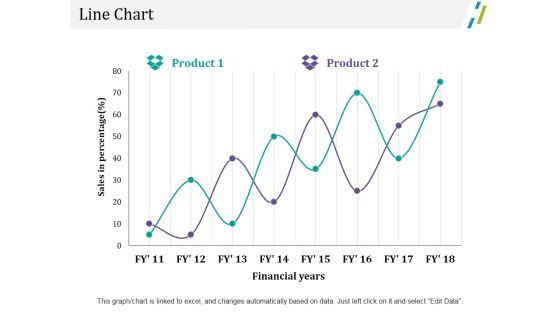
Line Chart Ppt PowerPoint Presentation Outline File Formats
This is a line chart ppt powerpoint presentation outline file formats. This is a two stage process. The stages in this process are business, marketing, sales in percentage, financial years, chart.
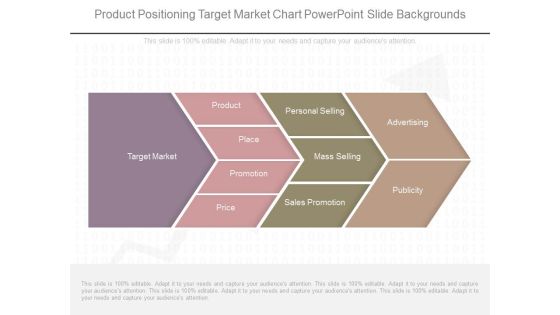
Product Positioning Target Market Chart Powerpoint Slide Backgrounds
This is a product positioning target market chart powerpoint slide backgrounds. This is a four stage process. The stages in this process are target market, product, place, promotion, price, personal selling, mass selling, sales promotion, advertising, publicity.

Content Marketing Performance Template 1 Ppt PowerPoint Presentation Icon Skills
This is a content marketing performance template 1 ppt powerpoint presentation icon skills. This is a eight stage process. The stages in this process are conversion rate, website traffic, number of leads, sales revenue, quality of leads.

Curve Chart For Product Life Cycle Presentation Outline
This is a curve chart for product life cycle presentation outline. This is a five stage process. The stages in this process are sales over time, product extension, introduction, growth, maturity, decline, time.
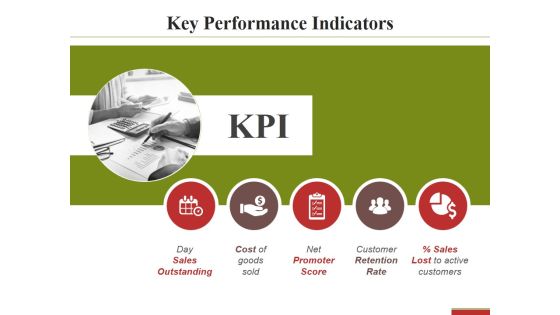
Key Performance Indicators Template 2 Ppt PowerPoint Presentation Pictures Slide
This is a key performance indicators template 2 ppt powerpoint presentation pictures slide. This is a five stage process. The stages in this process are day sales outstanding, cost of goods sold, net promoter score.

Bar Chart Ppt PowerPoint Presentation Ideas Graphic Tips
This is a bar chart ppt powerpoint presentation ideas graphic tips. This is a seven stage process. The stages in this process are sales in percentage, bar chart, growth, business, marketing.

Column Chart Ppt PowerPoint Presentation Gallery Design Inspiration
This is a column chart ppt powerpoint presentation gallery design inspiration. This is a two stage process. The stages in this process are column chart, product, sales in percentage, financial years.
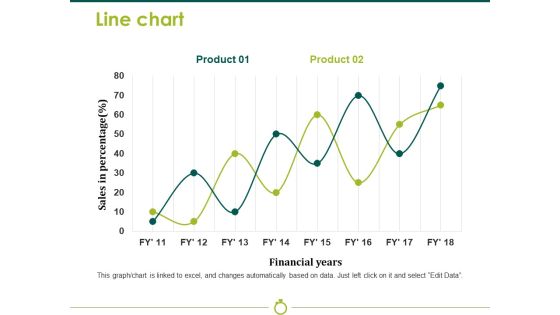
Line Chart Template 2 Ppt PowerPoint Presentation Model Background Image
This is a line chart template 2 ppt powerpoint presentation model background image. This is a two stage process. The stages in this process are sales in percentage, financial years, business, marketing, strategy, graph.
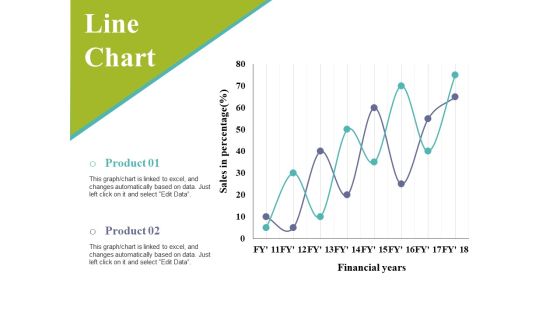
Line Chart Ppt PowerPoint Presentation Infographic Template Slides
This is a line chart ppt powerpoint presentation infographic template slides. This is a two stage process. The stages in this process are sales in percentage, financial years, business, marketing, graph.

Bar Chart Ppt PowerPoint Presentation Icon Design Templates
This is a bar chart ppt powerpoint presentation icon design templates. This is a nine stage process. The stages in this process are sales in percentage, bar graph, business, marketing, growth.

Scatter Chart Template 3 Ppt PowerPoint Presentation Styles Demonstration
This is a scatter chart template 3 ppt powerpoint presentation styles demonstration. This is a one stage process. The stages in this process are sales in percentage, finance, business, marketing, growth.
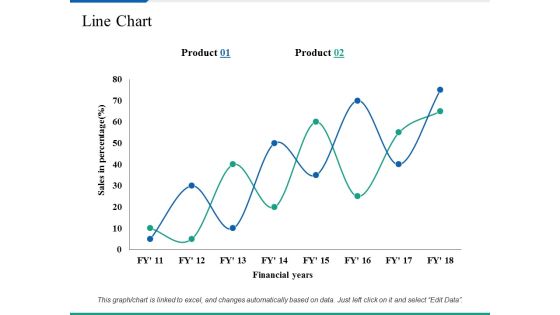
Line Chart Ppt PowerPoint Presentation Summary Clipart Images
This is a line chart ppt powerpoint presentation summary clipart images. This is a two stage process. The stages in this process are business, marketing, sales in percentage, financial years, strategy.

Tools To Measure Event Marketing Chart Powerpoint Slides Deck Template
This is a tools to measure event marketing chart powerpoint slides deck template. This is a six stage process. The stages in this process are cross functional, business intelligence, sales and promotion, going viral, driving roi, growing fans.

Scatter Bubble Chart Ppt PowerPoint Presentation Professional Model
This is a scatter bubble chart ppt powerpoint presentation professional model. This is a six stage process. The stages in this process are sales in profit, financial year, growth, business, marketing, strategy.

Line Chart Ppt PowerPoint Presentation Model Design Templates
This is a line chart ppt powerpoint presentation model design templates. This is a two stage process. The stages in this process are sales in percentage, financial years, product.

Bar Chart Ppt PowerPoint Presentation Infographic Template Skills
This is a bar chart ppt powerpoint presentation infographic template skills. This is a nine stage process. The stages in this process are sales in percentage, finance, business, marketing, strategy, success.

Bar Chart Ppt PowerPoint Presentation Professional Graphics Download
This is a bar chart ppt powerpoint presentation professional graphics download. This is a seven stage process. The stages in this process are sales in percentage, financial years, chart, business.
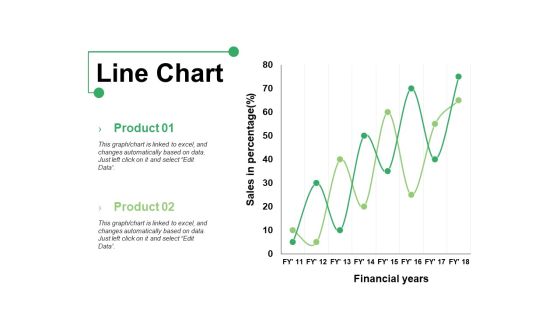
Line Chart Ppt PowerPoint Presentation Show Graphics Example
This is a line chart ppt powerpoint presentation show graphics example. This is a two stage process. The stages in this process are product, line chart, financial years, sales in percentage.
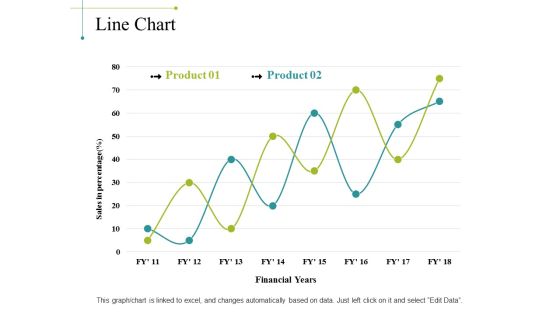
Line Chart Ppt PowerPoint Presentation Portfolio Background Image
This is a line chart ppt powerpoint presentation portfolio background image. This is a two stage process. The stages in this process are sales in percentage, financial years, chart, business, marketing, finance.

Bubble Chart Ppt PowerPoint Presentation Infographic Template Layouts
This is a bubble chart ppt powerpoint presentation infographic template layouts. This is a two stage process. The stages in this process are bubble chart, product, sales in percentage, growth.

Column Chart Ppt PowerPoint Presentation Portfolio Example Topics
This is a column chart ppt powerpoint presentation portfolio example topics. This is a two stage process. The stages in this process are product, financial year, sales in percentage, column chart.

Bubble Chart Ppt PowerPoint Presentation Summary Graphics Tutorials
This is a bubble chart ppt powerpoint presentation summary graphics tutorials. This is a three stage process. The stages in this process are product, sales in percentage, bubble chart.

Business Diagram Pie Chart Octagon Shape Presentation Template
This business plan power point template has been designed with pie chart in octagon shape. This PPT contains the concept of result analysis for any business process. Use this PPT for business and sales related presentations.

Business Diagram Circle Chart For Percentage Ratio Presentation Template
Four staged circular chart has been used to craft this PPT diagram. This PPT contains the concept of result analysis. Use this PPT in your business and sales presentation and display any kind of result analysis in a graphical way.

Bar Chart Ppt PowerPoint Presentation Slides Design Ideas
This is a bar chart ppt powerpoint presentation slides design ideas. This is a six stage process. The stages in this process are product, bar chart, sales in percentage.
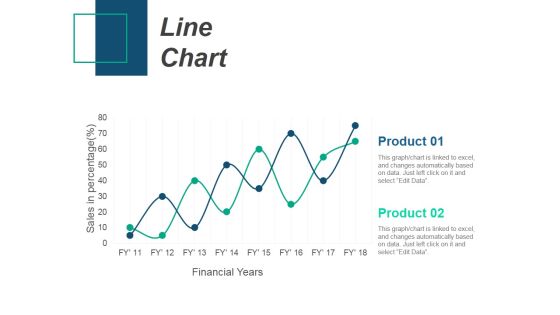
Line Chart Ppt PowerPoint Presentation Infographic Template Introduction
This is a line chart ppt powerpoint presentation infographic template introduction. This is a two stage process. The stages in this process are product, sales in percentage, financial years, line chart.
Line Chart Ppt PowerPoint Presentation Infographic Template Icons
This is a line chart ppt powerpoint presentation infographic template icons. This is a two stage process. The stages in this process are sales in percentage, financial years, product, line chart.
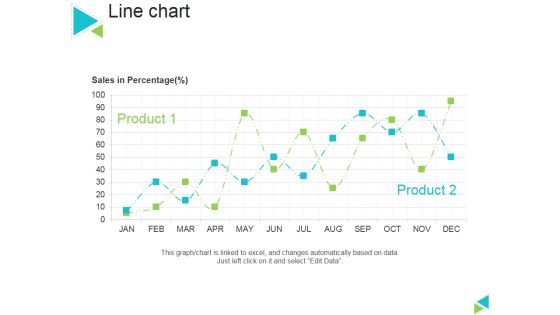
Line Chart Ppt PowerPoint Presentation Gallery Master Slide
This is a line chart ppt powerpoint presentation gallery master slide. This is a two stage process. The stages in this process are sales in percentage, product, line chart.

Measuring Content Marketing Performance Ppt PowerPoint Presentation Design Ideas
This is a measuring content marketing performance ppt powerpoint presentation design ideas. This is a eight stage process. The stages in this process are conversion rate, quality of leads, website traffic, number of leads, sales revenue, subscriber list growth.

Content Marketing Performance Ppt PowerPoint Presentation Slides Model
This is a content marketing performance ppt powerpoint presentation slides model. This is a eight stage process. The stages in this process are conversion rate, quality of leads, number of leads, sales revenue, website traffic.

Key Performance Indicators Ppt PowerPoint Presentation Pictures Design Templates
This is a key performance indicators ppt powerpoint presentation pictures design templates. This is a five stage process. The stages in this process are day sales outstanding, cost of goods sold, customer retention rate.

Competitive Analysis Template 8 Matrix Chart Ppt PowerPoint Presentation Show Outfit
This is a competitive analysis template 8 matrix chart ppt powerpoint presentation show outfit. This is a six stage process. The stages in this process are product quality, product fidelity, after sales service, customer service, price, shipping speed.

Line Chart Ppt PowerPoint Presentation Infographics Graphic Images
This is a line chart ppt powerpoint presentation infographics graphic images. This is a two stage process. The stages in this process are sales in percentage, financial years, growth, business, marketing.

Line Chart Ppt PowerPoint Presentation Professional Graphics Design
This is a line chart ppt powerpoint presentation professional graphics design. This is a two stage process. The stages in this process are financial years, sales in percentage, product, growth, success.
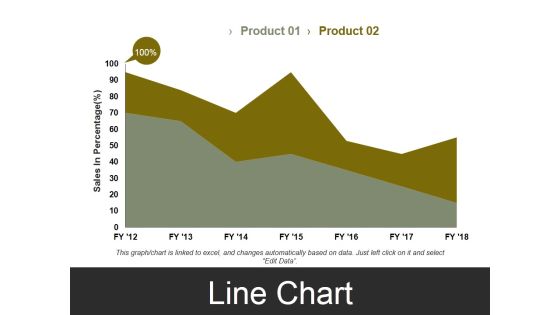
Line Chart Template 3 Ppt PowerPoint Presentation Styles Visual Aids
This is a line chart template 3 ppt powerpoint presentation styles visual aids. This is a two stage process. The stages in this process are sales in percentage, business, marketing, finance, graph.

Clustered Column Chart Ppt PowerPoint Presentation Show Slideshow
This is a clustered column chart ppt powerpoint presentation show slideshow. This is a six stage process. The stages in this process are financial year in, sales in percentage, business, marketing, finance.

Column Chart Ppt PowerPoint Presentation Slides Visual Aids
This is a column chart ppt powerpoint presentation slides visual aids. This is a six stage process. The stages in this process are bar graph, growth, success, sales in percentage, financial year.

Bar Chart Ppt PowerPoint Presentation Visual Aids Diagrams
This is a bar chart ppt powerpoint presentation visual aids diagrams. This is a two stage process. The stages in this process are business, marketing, financial years, sales in percentage, graph.

Column Chart Ppt PowerPoint Presentation Infographic Template Icon
This is a column chart ppt powerpoint presentation infographic template icon. This is a two stage process. The stages in this process are business, marketing, sales in percentage, financial year, graph.

Bar Chart Ppt PowerPoint Presentation Summary File Formats
This is a bar chart ppt powerpoint presentation summary file formats. This is a two stage process. The stages in this process are business, finance, financial years, sales in percentage, graph.

Combo Chart Ppt PowerPoint Presentation Gallery Design Ideas
This is a combo chart ppt powerpoint presentation gallery design ideas. This is a three stage process. The stages in this process are business, financial years, sales in percentage, finance, graph.

Line Chart Ppt PowerPoint Presentation Infographic Template Master Slide
This is a line chart ppt powerpoint presentation infographic template master slide. This is a two stage process. The stages in this process are product, financial years, sales in percentage.

Clustered Column Chart Ppt PowerPoint Presentation Professional Ideas
This is a clustered column chart ppt powerpoint presentation professional ideas. This is a three stage process. The stages in this process are product, sales in percentage, column, years.

Clustered Column Line Chart Ppt PowerPoint Presentation File Pictures
This is a clustered column line chart ppt powerpoint presentation file pictures. This is a four stage process. The stages in this process are clustered bar, product, planning, business, sales in percentage.

Column Chart Ppt PowerPoint Presentation Layouts Design Inspiration
This is a column chart ppt powerpoint presentation layouts design inspiration. This is a two stage process. The stages in this process are sales in percentage, financial year in, graph, business, finance, marketing.
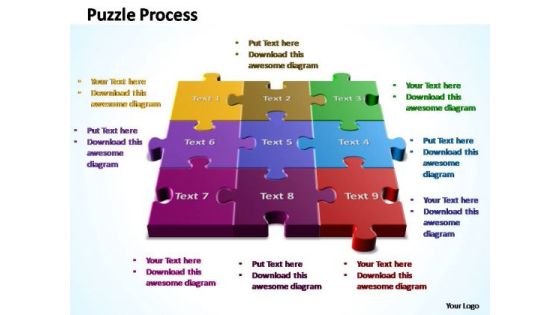
PowerPoint Templates Chart 3d Puzzle Process Ppt Slide
PowerPoint templates Chart 3D Puzzle Process PPT Slide-Puzzle diagram is a visual tool that allows you to create and visualize a sales process. -PowerPoint templates Chart 3D Puzzle Process PPT Slide

Stock Photo Graphics For Business Reports And Charts PowerPoint Slide
This image contains graphics of business reports and charts. Download this image for business and sales presentations where you have to focus on financial growth. Dazzle the audience with your thoughts.
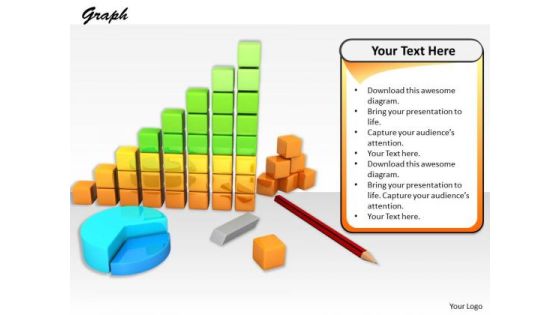
Stock Photo Design Of Business Reports And Charts PowerPoint Slide
This image slide has been professionally designed to give complete look to your business presentations. This image is designed with graphics of business reports and charts. Use this image in marketing and sales related presentations.
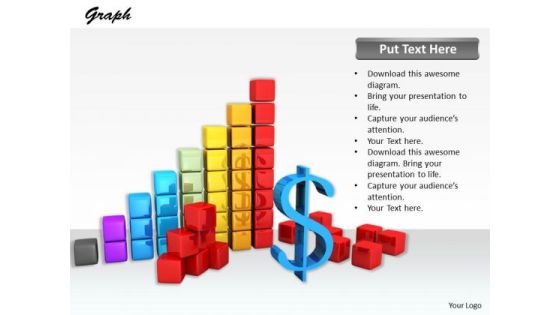
Stock Photo Design Of Financial Charts And Reports PowerPoint Slide
This image slide has been professionally designed to give complete look to your business presentations. This image is designed with graphics of business reports and charts. Use this image in marketing and sales related presentations.
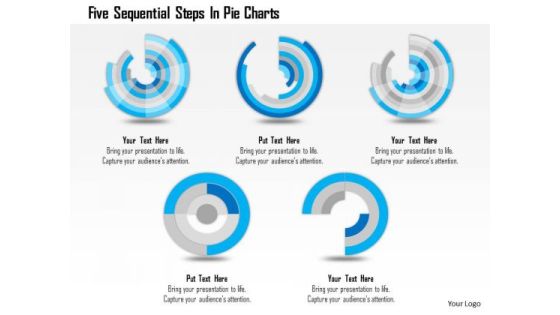
Business Diagram Five Sequential Steps In Pie Charts Presentation Template
Five sequential pie charts are used to craft this power point template. This PPT contains the concept of process flow and result analysis. Use this PPT for your business and sales related presentations and build quality presentation for your viewers.
Four Pie Charts With Business Icons Powerpoint Templates
This PowerPoint template has been designed with four pie charts and icons. This diagram is suitable for sales and marketing presentations. This professional slide helps in making an instant impact on viewers.

Competitive Analysis Template 8 Matrix Chart Ppt PowerPoint Presentation Templates
This is a competitive analysis template 8 matrix chart ppt powerpoint presentation templates. This is a six stage process. The stages in this process are our business, product quality, product fidelity, after sales service, customer service, price, shipping speed, competitor.

Competitive Analysis Matrix Chart Ppt PowerPoint Presentation Portfolio Format Ideas
This is a competitive analysis matrix chart ppt powerpoint presentation portfolio format ideas. This is a six stage process. The stages in this process are our business, product quality, product fidelity, after sales service, customer service.

Organization Chart Ppt PowerPoint Presentation Model Graphic Images
This is a organization chart ppt powerpoint presentation model graphic images. This is a six stage process. The stages in this process are editor, sales marketing, assistant manager, manager, web designer.

Bar Chart Ppt PowerPoint Presentation Pictures Background Image
This is a bar chart ppt powerpoint presentation pictures background image. This is a seven stage process. The stages in this process are financial years, sales in percentage, graph, business.

Column Chart Ppt PowerPoint Presentation Model Graphics Download
This is a column chart ppt powerpoint presentation model graphics download. This is a two stage process. The stages in this process are product, financial year, sales in percentage, bar graph, success.
Scatter Line Chart Ppt PowerPoint Presentation Icon Files
This is a scatter line chart ppt powerpoint presentation icon files. This is a one stage process. The stages in this process are dollar in millions, product, sales in percentage.

Column Chart Ppt PowerPoint Presentation Gallery Slide Portrait
This is a column chart ppt powerpoint presentation gallery slide portrait. This is a two stage process. The stages in this process are sales in percentage, financial year, product, bar graph, growth.

Bar Chart Ppt PowerPoint Presentation Infographics Format Ideas
This is a bar chart ppt powerpoint presentation infographics format ideas. This is a two stage process. The stages in this process are bar graph, product, financial year, sales in percentage.

Bar Chart Ppt PowerPoint Presentation Slides Example File
This is a bar chart ppt powerpoint presentation slides example file. This is a two stage process. The stages in this process are product, financial years, sales in percentage.

Competitive Analysis Template 8 Matrix Chart Ppt PowerPoint Presentation Designs Download
This is a competitive analysis template 8 matrix chart ppt powerpoint presentation designs download. This is a six stage process. The stages in this process are product quality, product fidelity, after sales service, customer service, price, shipping speed.
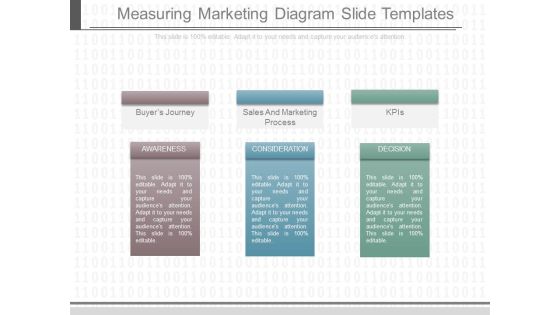
Measuring Marketing Diagram Slide Templates
This is a measuring marketing diagram slide templates. This is a three stage process. The stages in this process are buyer journey, sales and marketing process, kpis, awareness, consideration, decision.
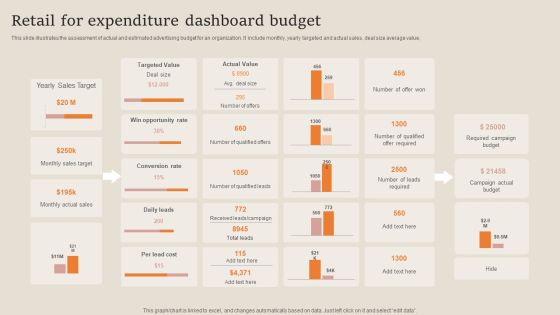
Retail For Expenditure Dashboard Budget Designs PDF
This slide illustrates the assessment of actual and estimated advertising budget for an organization. It include monthly, yearly targeted and actual sales, deal size average value, Showcasing this set of slides titled Retail For Expenditure Dashboard Budget Designs PDF. The topics addressed in these templates are Sales Target, Opportunity Rate, Required Campaign Budget. All the content presented in this PPT design is completely editable. Download it and make adjustments in color, background, font etc. as per your unique business setting.
Kpis Deriving Demand Driven Manufacturing Operations Icons PDF
This slide represents the metrics which drive actions for demand driven manufacturing operations. It includes details related to operations, supplier, customer sales and quality. Showcasing this set of slides titled Kpis Deriving Demand Driven Manufacturing Operations Icons PDF. The topics addressed in these templates are Operations, Supplier, Customer Or Sales, Quality. All the content presented in this PPT design is completely editable. Download it and make adjustments in color, background, font etc. as per your unique business setting.

Maslow Pyramid For Online Marketing Kpis Structure PDF
The slide shows Maslow pyramid for online marketing KPIs. It highlights Loyalty , Sales, online advertising and traffic KPIs. Presenting Maslow Pyramid For Online Marketing Kpis Structure PDF to dispense important information. This template comprises four stages. It also presents valuable insights into the topics including Loyalty Kpis, Sales Kpis, Online Advertising Kpis. This is a completely customizable PowerPoint theme that can be put to use immediately. So, download it and address the topic impactfully.

Lead Nurturing Flowchart Ppt Infographics
This is a lead nurturing flowchart ppt infographics. This is a three stage process. The stages in this process are content marketing, up selling and cross selling, driving awareness, analyst relation, lead nurturing, lead generation, sales enablement, search engine.

Food Production Plant Management Dashboard Clipart PDF
This slide illustrates food production factory management dashboard. It provides information such as total production, active machines, sales revenue, shifts, expenses, manpower, rejected products, etc.Pitch your topic with ease and precision using this food production plant management dashboard clipart pdf This layout presents information on total production, active machines, sales revenue It is also available for immediate download and adjustment. So, changes can be made in the color, design, graphics or any other component to create a unique layout.
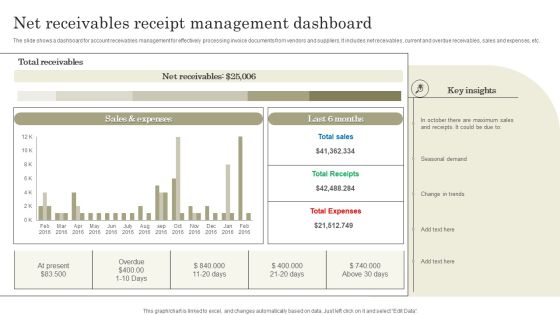
Net Receivables Receipt Management Dashboard Information PDF
The slide shows a dashboard for account receivables management for effectively processing invoice documents from vendors and suppliers. It includes net receivables, current and overdue receivables, sales and expenses, etc. Showcasing this set of slides titled Net Receivables Receipt Management Dashboard Information PDF. The topics addressed in these templates are Total sales, Total Receipts, Total Expenses. All the content presented in this PPT design is completely editable. Download it and make adjustments in color, background, font etc. as per your unique business setting.
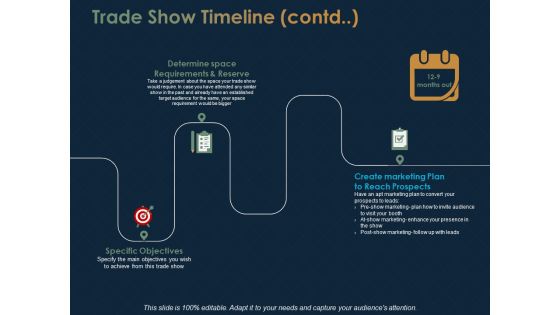
Trade Show Timeline Specific Objectives Ppt PowerPoint Presentation Portfolio Outfit
This is a trade show timeline specific objectives ppt powerpoint presentation portfolio outfit. This is a two stage process. The stages in this process are sales message, business, planning, strategy, marketing.

Company Department Cultural Dashboard Formats PDF
The purpose of this slide is to provide a graph showing the production and sales over the last 4 years in the organization, also defining the rationale behind the decrease in production and sales within the company. Deliver an awe inspiring pitch with this creative company department cultural dashboard formats pdf bundle. Topics like average per department, company culture can be discussed with this completely editable template. It is available for immediate download depending on the needs and requirements of the user.
Strategic Promotion Plan Implementation Analytics Dashboard Icons PDF
This slide illustrates graphical representation of implementation data of promotional strategy. It includes sales revenue, ad expenditure, profit etc. Showcasing this set of slides titled Strategic Promotion Plan Implementation Analytics Dashboard Icons PDF. The topics addressed in these templates are Profit, Sales Revenue, Expenditure. All the content presented in this PPT design is completely editable. Download it and make adjustments in color, background, font etc. as per your unique business setting.

Instant Snacks And Food Firm Details Competitor Comparison Formats PDF
The slide highlights the competitor comparison for top competitors. It compares companies on the basis of global market share, revenue, employee count, service area, number of brands and total sales.Deliver and pitch your topic in the best possible manner with this Instant Snacks And Food Firm Details Competitor Comparison Formats PDF Use them to share invaluable insights on Employees Count, Service Area, Total Sales and impress your audience. This template can be altered and modified as per your expectations. So, grab it now.
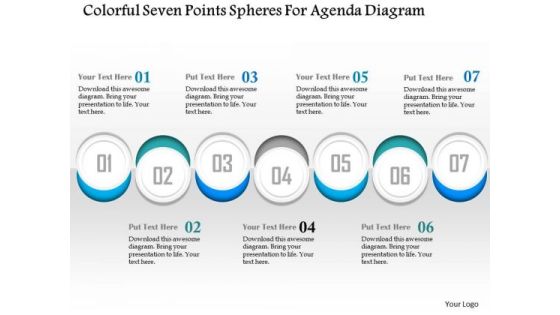
Business Diagram Colorful Seven Points Spheres For Agenda Diagram Presentation Template
Seven staged sphere diagram has been used to design this Power Point template. This diagram displays the concept of business and sales agenda. Use this info graphic in your business presentations and explain business agendas.

Enterprise Statistic Model Ppt Layout Presentation Outline
This is a Enterprise Statistic Model Ppt Layout Presentation Outline. This is a five stage process. The stages in this process are interactive marketing, sales forecasting, market research, marketing intelligence, distributing information.

PowerPoint Templates Diagram 3d Puzzle Process Ppt Slide
PowerPoint templates Diagram 3D Puzzle Process PPT Slide-Puzzle diagram is a visual tool that allows you to create and visualize a sales process. -PowerPoint templates Diagram 3D Puzzle Process PPT Slide

Selling Forecasts Dashboard With Revenue Predictions Elements PDF
This slide covers estimated sales projections based on different regions. It includes elements such as potential revenue and predicted revenue, predicted risks, sales forecasted by agents , etc. Showcasing this set of slides titled Selling Forecasts Dashboard With Revenue Predictions Elements PDF. The topics addressed in these templates are Forecasted Value, Potential Revenue, Predicted Risk. All the content presented in this PPT design is completely editable. Download it and make adjustments in color, background, font etc. as per your unique business setting.

CRM System Deployment Plan Post Implementation Impacts On Business Aspects Background PDF
This slide covers major improvements after CRM software implementation. It includes major impact on areas such as customer retention, customer satisfaction, sales revenue, and upselling or cross-selling. Deliver an awe inspiring pitch with this creative CRM System Deployment Plan Post Implementation Impacts On Business Aspects Background PDF bundle. Topics like Sales Revenue, Customer Satisfaction, Customer Retention can be discussed with this completely editable template. It is available for immediate download depending on the needs and requirements of the user.
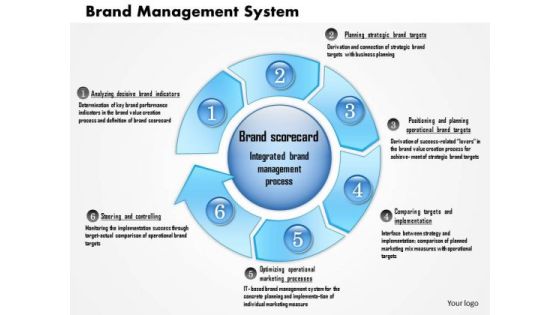
Business Framework Brand Management System PowerPoint Presentation
Explain the concept of brand management in any business presentation with this exclusive power point slide. We have used circular flow chart with multiple stages for displaying this system. This image may be used for sales and finance related presentations.

Deploying House Flipping Business Plan Strategy And Implementation For House Flipping Business Plan Designs PDF
This slide represents key strategies for property flipping business plan developed by flippers. It covers sales forecast by different generations, sales strategy and marketing initiatives to increase property sales. Slidegeeks is here to make your presentations a breeze with Deploying House Flipping Business Plan Strategy And Implementation For House Flipping Business Plan Designs PDF With our easy to use and customizable templates, you can focus on delivering your ideas rather than worrying about formatting. With a variety of designs to choose from, you are sure to find one that suits your needs. And with animations and unique photos, illustrations, and fonts, you can make your presentation pop. So whether you are giving a sales pitch or presenting to the board, make sure to check out Slidegeeks first.

Web Based Client Management Ppt Powerpoint Images
This is a web based client management ppt powerpoint images. This is a eight stage process. The stages in this process are campaigns, help desk, quotes and sales orders, product management, clients, email marketing, lead management .
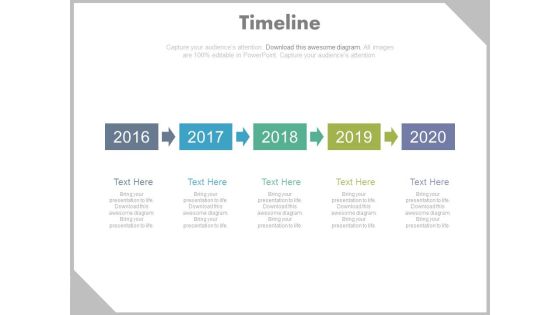
Year Tags Timeline Sequence Diagram Powerpoint Slides
This PowerPoint timeline slide design can be used to display progress steps. It contains sequential timeline tags. This timeline template can be used in presentations where you need to display sales planning and analysis.
Business Diagram People Spinning Plates On Sticks Presentation Template
This power point template has been crafted with graphic of 3d business men in line. This PPT contains the concept of strategy and target selection. Use this PPT for your business and sales related presentations.
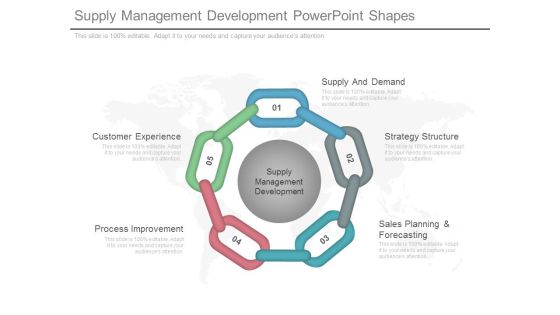
Supply Management Development Powerpoint Shapes
This is a supply management development powerpoint shapes. This is a five stage process. The stages in this process are supply and demand, strategy structure, sales planning and forecasting, process improvement, customer experience.
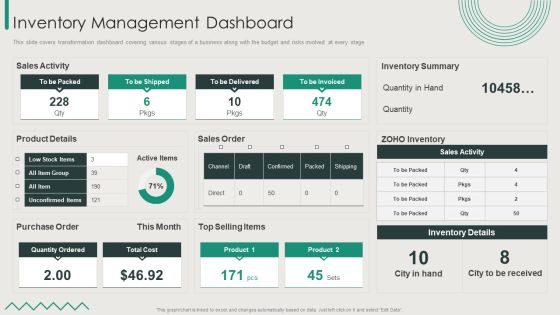
Organization Transition Inventory Management Dashboard Ppt Layouts Tips PDF
This slide covers transformation dashboard covering various stages of a business along with the budget and risks involved at every stage. Deliver and pitch your topic in the best possible manner with this Organization Transition Inventory Management Dashboard Ppt Layouts Tips PDF. Use them to share invaluable insights on Sales Activity, Product Details, Sales Order, Purchase Order and impress your audience. This template can be altered and modified as per your expectations. So, grab it now.

B2B Demand Generation Best Practices Addressing B2B Account Based Marketing Management Clipart PDF
This slide provides information regarding B2B account-based marketing management dashboard catering KPIs related to opportunities, sales activities, average engagement score. Deliver an awe inspiring pitch with this creative b2b demand generation best practices addressing b2b account based marketing management clipart pdf bundle. Topics like pipeline value account, account details, pipeline value, opportunities, engaged contacts, sales activities can be discussed with this completely editable template. It is available for immediate download depending on the needs and requirements of the user.

Improving Lead Generation Addressing B2B Account Based Marketing Management Information PDF
This slide provides information regarding B2B account-based marketing management dashboard catering KPIs related to opportunities, sales activities, average engagement score. Deliver an awe inspiring pitch with this creative improving lead generation addressing b2b account based marketing management information pdf bundle. Topics like account details, pipeline value by account, sales activities by account, engagement score by account can be discussed with this completely editable template. It is available for immediate download depending on the needs and requirements of the user.
Interpreting Market Kinetics Influence Customer Purchasing KPI Dashboard To Monitor Icons PDF
Mentioned slide shows the KPI dashboard that can be used to track win and lost sales opportunities. It includes metrics namely won opportunities, lost opportunities, pipeline by territory, total opportunities. Deliver an awe inspiring pitch with this creative interpreting market kinetics influence customer purchasing kpi dashboard to monitor icons pdf bundle. Topics like kpi dashboard to monitor sales opportunities can be discussed with this completely editable template. It is available for immediate download depending on the needs and requirements of the user.
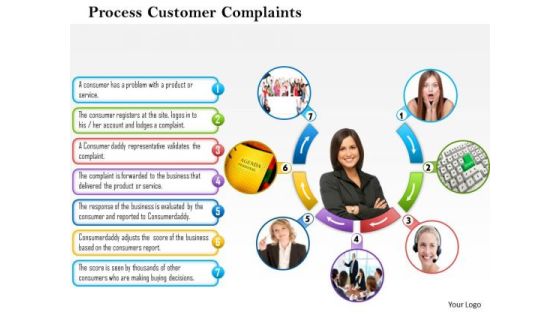
Business Framework Process Customer Complaints PowerPoint Presentation
This Power Point template diagram slide has been designed with graphic of customer care center. This PPT slide contains the concept of process of resolving customer complaints. Use this PPT slide for your marketing and sales service related topics.
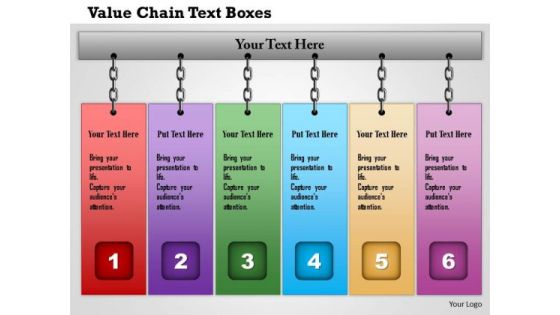
Business Framework Value Chain Text Boxes PowerPoint Presentation
This business diagram displays framework for value chain. This slide contains graphic of colorful tags in linear order. This editable diagram may be used for business and sales related presentations.
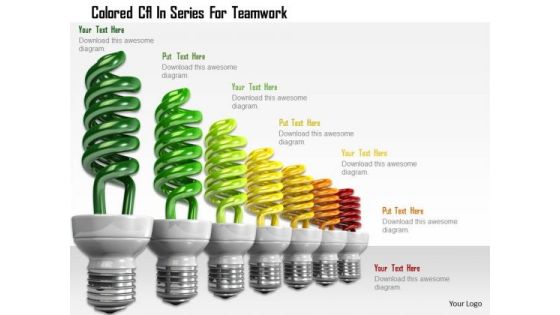
Stock Photo Colored Cfl In Series For Teamwork PowerPoint Slide
This power point image template has been designed with graphic of colored CFL in series. This image template contains the concept of teamwork. Use this PPT for your business and sales related presentations.
Business Diagram Seven Icons With Circle Diagram Presentation Template
Seven staged circle diagram has been used to craft this power point template diagram. This PPT contains the concept of process flow. Use this PPT and build an innovative presentation for business and sales process related topics.
Business Diagram Six Icons With Circle Diagram Presentation Template
Six staged circle diagram has been used to craft this power point template diagram. This PPT contains the concept of process flow. Use this PPT and build an excellent presentation for business and sales process related topics.

Demand Chain Management Ppt Powerpoint Guide
This is a demand chain management ppt powerpoint guide. This is a three stage process. The stages in this process are supply chain management, crm management, sales force automation.

Order Fulfillment Process Ppt PowerPoint Presentation Styles Graphics Tutorials
This is a order fulfillment process ppt powerpoint presentation styles graphics tutorials. This is a four stage process. The stages in this process are customer, sales department, credit and billing, shipping, check inventory.
Order Fulfillment Process Ppt PowerPoint Presentation Icon Demonstration
This is a order fulfillment process ppt powerpoint presentation icon demonstration. This is a four stage process. The stages in this process are customer, sales department, credit and billing, shipping, submit order.
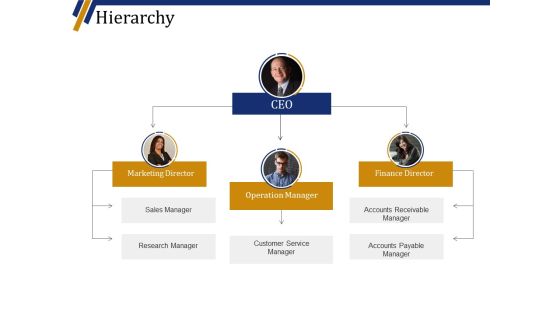
Hierarchy Ppt PowerPoint Presentation Layouts Visuals
This is a hierarchy ppt powerpoint presentation layouts visuals. This is a three stage process. The stages in this process are marketing director, operation manager, finance director, sales manager, research manager.

Hierarchy Ppt PowerPoint Presentation Professional Display
This is a hierarchy ppt powerpoint presentation professional display. This is a three stage process. The stages in this process are ceo, manager, graphic designer, sales and marketing, hierarchy.

Marketing Timeline Template Presentation Background Images
This is a marketing timeline template presentation background images. This is a five stage process. The stages in this process are sales enablement, promotion strategy, distribution plan, offers, conversion strategy.

Marketing Timeline Graphics Design Presentation Backgrounds
This is a marketing timeline graphics design presentation backgrounds. This is a five stage process. The stages in this process are sales enablement, promotion strategy, distribution plan, offers, conversion strategy.

Affiliate Marketing KPI Dashboard With Click Through Rate Slides PDF
The following slide showcases a comprehensive affiliate marketing KPI dashboard. Information covered in this slide is related to total sales , commission, clicks, sessions, click through rate, etc. Showcasing this set of slides titled Affiliate Marketing KPI Dashboard With Click Through Rate Slides PDF. The topics addressed in these templates are Sales, Dashboard, Commission. All the content presented in this PPT design is completely editable. Download it and make adjustments in color, background, font etc. as per your unique business setting.
Year Tags Sequential Timeline With Icons Powerpoint Slides
This PowerPoint timeline slide design can be used to display progress steps. It contains sequential timeline tags. This timeline template can be used in presentations where you need to display sales planning and analysis.

Dashboards Related To The Patients Of Pharmaceutical Company Infographics PDF
This slide shows the dashboard or KPI related to pharmaceutical company which includes sales summary, number of units sold, status for latest month, etc.Deliver an awe inspiring pitch with this creative dashboards related to the patients of pharmaceutical company infographics pdf bundle. Topics like pharmaceutical sales summary, pharmaceutical data broker, quartipine injection can be discussed with this completely editable template. It is available for immediate download depending on the needs and requirements of the user.

Credit Administration Dashboard With Administration Details Formats PDF
This slide illustrates credit management dashboard with administration details. It also provides information on debtors, invoices, current payment plans, says sales outstanding, credit maturity analysis, outstanding amount, etc. Pitch your topic with ease and precision using this Credit Administration Dashboard With Administration Details Formats PDF. This layout presents information on Sales, Payment, Plans. It is also available for immediate download and adjustment. So, changes can be made in the color, design, graphics or any other component to create a unique layout.
Merchandise Playbook Essential Merchandise Store Activities Tracking Dashboard Formats PDF
This slide provides details regarding the dashboard for tracking retail store activities in terms of sales, conversion rate, traffic, average transaction value, recommendations, etc. Deliver an awe inspiring pitch with this creative Merchandise Playbook Essential Merchandise Store Activities Tracking Dashboard Formats PDF bundle. Topics like Sales Traffic Out, Rate Avg Transaction, Value Traffic Today can be discussed with this completely editable template. It is available for immediate download depending on the needs and requirements of the user.

Executive Marketing And Operations Dashboard For Inventory Management Template PDF
This slide covers executive sales and operations dashboard for inventory management. It involves total number of accounts, monthly recuring revenue, conversion rate and monthly recurring revenue retention rate. Showcasing this set of slides titled Executive Marketing And Operations Dashboard For Inventory Management Template PDF. The topics addressed in these templates are Product, Marketing, Sales. All the content presented in this PPT design is completely editable. Download it and make adjustments in color, background, font etc. as per your unique business setting.
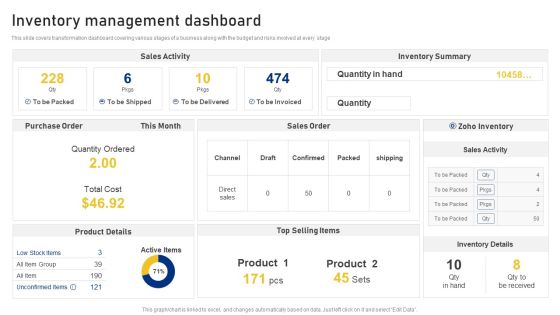
Reshaping Business In Digital Inventory Management Dashboard Mockup PDF
This slide covers transformation dashboard covering various stages of a business along with the budget and risks involved at every stage Deliver and pitch your topic in the best possible manner with this Reshaping Business In Digital Inventory Management Dashboard Mockup PDF. Use them to share invaluable insights on Sales Activity, Inventory Summary, Quantity, Sales Order and impress your audience. This template can be altered and modified as per your expectations. So, grab it now.

KPI Dashboard Of Projected Vs Actual Business Budget Pictures PDF
This slide shows the comparison between actual and Projected Budget dashboard of different departments. It includes sales, HR, marketing, research and development budget. Showcasing this set of slides titled KPI Dashboard Of Projected Vs Actual Business Budget Pictures PDF. The topics addressed in these templates are Marketing Budget, Development Budget, Sales Budget. All the content presented in this PPT design is completely editable. Download it and make adjustments in color, background, font etc. as per your unique business setting.

Content Ppt PowerPoint Presentation Outline Guide
This is a content ppt powerpoint presentation outline guide. This is a five stage process. The stages in this process are business overview, sales performance, project updates, competitive analysis, future perspective.

Business Operations Assessment Business Management Dashboards Product Ppt Ideas PDF
Deliver and pitch your topic in the best possible manner with this business operations assessment business management dashboards product ppt ideas pdf. Use them to share invaluable insights on top ten products by profit margin, revenue and sales last 12 months, customers by region, new customers signups, sales by product category and impress your audience. This template can be altered and modified as per your expectations. So, grab it now.

Market Research Summary Dashboard Of Fmcg Industry Pictures PDF
The following slide highlights the market research report of FMCG which includes the sales by location, units per transaction and products sold. Showcasing this set of slides titled Market Research Summary Dashboard Of Fmcg Industry Pictures PDF. The topics addressed in these templates are Revenues, Net Profit, Sales. All the content presented in this PPT design is completely editable. Download it and make adjustments in color, background, font etc. as per your unique business setting.

Departmental Goals And Progress Status Dashboard Ppt Portfolio Samples PDF
This slide illustrates statistics and graphical representation of team progress. It includes testing team, sales team, development team, members and progress status graphs etc. Pitch your topic with ease and precision using this Departmental Goals And Progress Status Dashboard Ppt Portfolio Samples PDF. This layout presents information on Testing Team, Sales Team, Development Team. It is also available for immediate download and adjustment. So, changes can be made in the color, design, graphics or any other component to create a unique layout.

Earning Potential And Financial Forecasting Dashboard Summary PDF
This slide illustrates facts and figures related to sales figures. It includes data of monthly revenue generation FY23, yearly revenue, expected revenue generation FY23 etc. Pitch your topic with ease and precision using this Earning Potential And Financial Forecasting Dashboard Summary PDF. This layout presents information on Sales Revenue, Expected Revenue, Product. It is also available for immediate download and adjustment. So, changes can be made in the color, design, graphics or any other component to create a unique layout.

Agile Team Member Customer Relationship Management Dashboard With Deals Funnel Mockup PDF
This slide illustrates graphical representation of CRM sales team member data. It includes pipeline, business components and activity level, categories etc. Pitch your topic with ease and precision using this Agile Team Member Customer Relationship Management Dashboard With Deals Funnel Mockup PDF. This layout presents information on Funnel Of Deals, Sent Campaigns Emails, Sales Chart. It is also available for immediate download and adjustment. So, changes can be made in the color, design, graphics or any other component to create a unique layout.
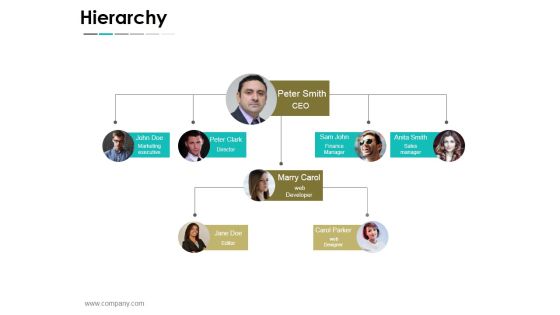
Hierarchy Ppt PowerPoint Presentation Summary Background
This is a hierarchy ppt powerpoint presentation summary background. This is a four stage process. The stages in this process are marketing executive, director, finance manager, sales manager, web developer, editor.

Bar Graph Ppt PowerPoint Presentation Outline Layout
This is a bar graph ppt powerpoint presentation outline layout. This is a four stage process. The stages in this process are sales in percentage, product, bar graph, business, marketing.
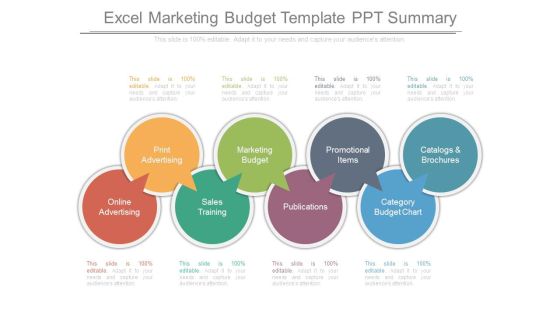
Excel Marketing Budget Template Ppt Summary
This is a excel marketing budget template ppt summary. This is a eight stage process. The stages in this process are print advertising, online advertising, marketing budget, sales training, promotional items, publications, catalogs and brochures, category budget chart.
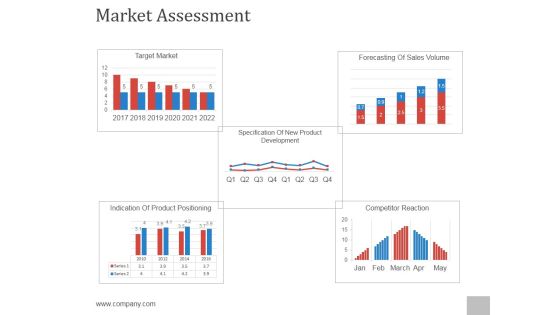
Market Assessment Ppt PowerPoint Presentation Files
This is a market assessment ppt powerpoint presentation files. This is a five stage process. The stages in this process are target market, forecasting of sales volume, indication of product positioning, competitor reaction, specification of new product development.

Clustered Column Ppt PowerPoint Presentation Infographic Template Background Designs
This is a clustered column ppt powerpoint presentation infographic template background designs. This is a two stage process. The stages in this process are sales in percentage, bar, business, marketing, planning.
