Sales Trend

Competitor Analysis Ppt PowerPoint Presentation Layouts Background Images
This is a competitor analysis ppt powerpoint presentation layouts background images. This is a four stage process. The stages in this process are sales development of industry, revenue, performance indicators, sales development.

Competitor Analysis Ppt PowerPoint Presentation File Influencers
This is a competitor analysis ppt powerpoint presentation file influencers. This is a four stage process. The stages in this process are revenue, sales, placeholder, performance indicators, sales development.

Competitor Analysis Ppt PowerPoint Presentation Professional Designs
This is a competitor analysis ppt powerpoint presentation professional designs. This is a four stage process. The stages in this process are sales development of industry, sales development, performance indicators, revenue.

Business Model Opening Restaurant Coffee Shop Business Dashboard Inspiration PDF
This slide shows the coffee shop business dashboard which includes profit by state, average sales by month, profit, sales by product type, etc. Deliver and pitch your topic in the best possible manner with this business model opening restaurant coffee shop business dashboard inspiration pdf. Use them to share invaluable insights on profit v budgeted, average sales, sales by product and impress your audience. This template can be altered and modified as per your expectations. So, grab it now.
Lead Management Powerpoint Slide Information
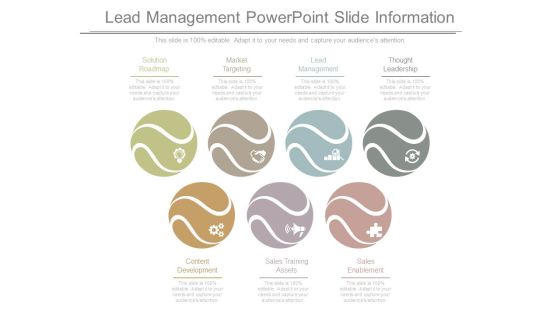
This is a lead management powerpoint slide information. This is a seven stage process. The stages in this process are solution roadmap, market targeting, lead management, thought leadership, content development, sales training assets, sales enablement.

Business Model Opening Restaurant Coffee Shop Business Dashboard Plan Icons PDF
This slide shows the coffee shop business dashboard which includes sales month, gross margin by category, sales and profit details, etc. Deliver an awe inspiring pitch with this creative business model opening restaurant coffee shop business dashboard plan icons pdf bundle. Topics like gross margin, plan sales, sales and profit can be discussed with this completely editable template. It is available for immediate download depending on the needs and requirements of the user.

Forecasting And Replenishment Diagram Powerpoint Show
This is a forecasting and replenishment diagram powerpoint show. This is a sixteen stage process. The stages in this process are finance and accounting, field sales collaboration, distribution planning, customer collaboration, advanced planning and scheduling, master production scheduling, forecasting and planning, budgeting, purchasing, supplier collaboration, product development engineering, capacity planning, waterfall charts, sales and operations planning, enterprise system, marketing and sales.

Table Of Contents For Marketing Playbook To Maximize Roi Elements PDF
Presenting table of contents for marketing playbook to maximize roi elements pdf to provide visual cues and insights. Share and navigate important information on seven stages that need your due attention. This template can be used to pitch topics like sales pitching through content, managing sales workforce, selecting effective sales methodology, metrics and dashboard for sales performance tracking. In addtion, this PPT design contains high resolution images, graphics, etc, that are easily editable and available for immediate download.
Export Trade Report Of Different Countries Infographics PDF
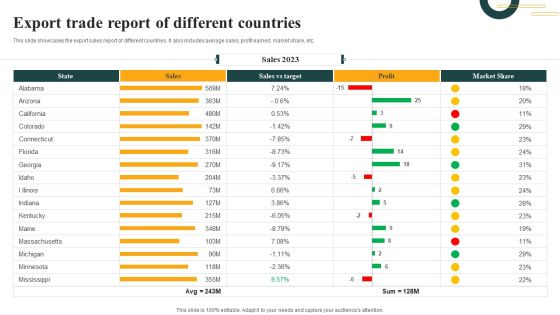
This slide showcases the export sales report of different countries. It also includes average sales, profit earned, market share, etc. Showcasing this set of slides titled Export Trade Report Of Different Countries Infographics PDF. The topics addressed in these templates are Sales Vs Target, Sales, Market Share. All the content presented in this PPT design is completely editable. Download it and make adjustments in color, background, font etc. as per your unique business setting.

B2B Marketing KPI Dashboard INSIGHT Ppt Ideas Information PDF
Deliver an awe-inspiring pitch with this creative b2b marketing kpi dashboard insight ppt ideas information pdf bundle. Topics like revenue breakdown, leads region, sales reps leads, sales representatives leads actual, sales results identify individual performance can be discussed with this completely editable template. It is available for immediate download depending on the needs and requirements of the user.

Indirect Channel Marketing Initiatives Impact Of Partner Enablement Tools Elements PDF
This slide covers the impact of partner enablement tools on sellers such as sales training services, sales tools, sales process improvements, coaching, etc. Deliver and pitch your topic in the best possible manner with this indirect channel marketing initiatives impact of partner enablement tools elements pdf. Use them to share invaluable insights on sales, training, process, service, coaching and impress your audience. This template can be altered and modified as per your expectations. So, grab it now.

Distributor Entitlement Initiatives Impact Of Partner Enablement Tools Guidelines PDF
This slide covers the impact of partner enablement tools on sellers such as sales training services, sales tools, sales process improvements, coaching, etc. Deliver and pitch your topic in the best possible manner with this distributor entitlement initiatives impact of partner enablement tools guidelines pdf. Use them to share invaluable insights on sales, training, process, service, coaching and impress your audience. This template can be altered and modified as per your expectations. So, grab it now.
Investor Pitch Deck For Food Startup We Are Growing Rapidly Every Month Brochure PDF
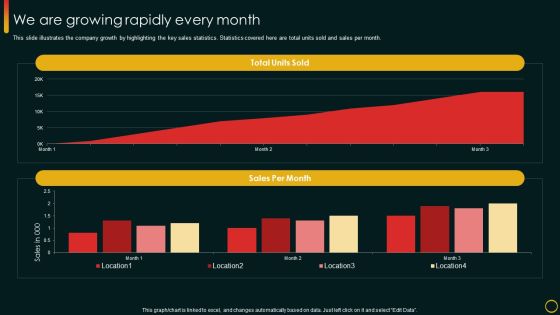
This slide illustrates the company growth by highlighting the key sales statistics. Statistics covered here are total units sold and sales per month. Deliver and pitch your topic in the best possible manner with this Investor Pitch Deck For Food Startup We Are Growing Rapidly Every Month Brochure PDF. Use them to share invaluable insights on Total Units Sold, Sales Per Month, Sales and impress your audience. This template can be altered and modified as per your expectations. So, grab it now.

B2B Conversion Velocity Dashboard Ppt Outline Slide Portrait PDF
This slide covers the conversion velocity dashboard wherein the lead count is calculated based on marketing qualified and sales qualified lead.Deliver an awe-inspiring pitch with this creative B2B conversion velocity dashboard ppt outline slide portrait pdf. bundle. Topics like trending conversion rates, trending leads and cpl can be discussed with this completely editable template. It is available for immediate download depending on the needs and requirements of the user.

Dashboard Ppt PowerPoint Presentation Ideas Graphics Pictures
Presenting this set of slides with name dashboard ppt powerpoint presentation ideas graphics pictures. The topics discussed in these slides are ytd sales vs yr sm, net sales vs last yr sm, net sales vs last yr sm. This is a completely editable PowerPoint presentation and is available for immediate download. Download now and impress your audience.
Startup Pitch To Raise Capital From Crowdfunding Financial Summary Of The Company Microsoft PDF
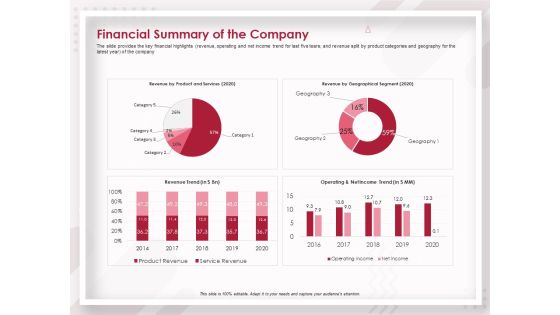
Deliver and pitch your topic in the best possible manner with this startup pitch to raise capital from crowdfunding financial summary of the company microsoft pdf. Use them to share invaluable insights on revenue by product and services 2020, revenue by geographical segment 2020, revenue trend, operating and net income trend and impress your audience. This template can be altered and modified as per your expectations. So, grab it now.
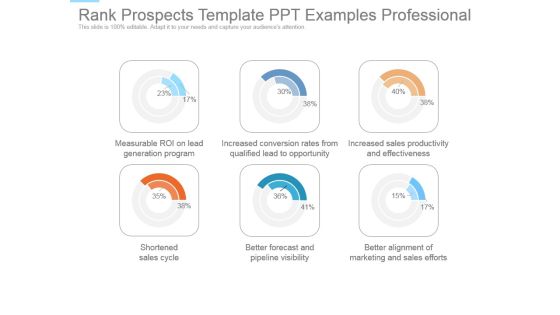
Rank Prospects Template Ppt Examples Professional
This is a rank prospects template ppt examples professional. This is a six stage process. The stages in this process are measurable roi on lead generation program, increased conversion rates from qualified lead to opportunity, increased sales productivity and effectiveness, shortened sales cycle, better forecast and pipeline visibility, better alignment of marketing and sales efforts.

Pie Charts For Lead Scoring Ppt Background Template
This is a pie charts for lead scoring ppt background template. This is a six stage process. The stages in this process are measurable roi on lead generation program, increased conversion rates from qualified lead to opportunity, increased sales productivity and effectiveness, better alignment of marketing and sales efforts, better forecast and pipeline visibility, shortened sales cycle.

Client Impact Evaluation And Management Chart With Severity Level Ppt Layouts Deck PDF
Showcasing this set of slides titled client impact evaluation and management chart with severity level ppt layouts deck pdf. The topics addressed in these templates are sales operations, system sales operations, sales analyst, department, it engineering. All the content presented in this PPT design is completely editable. Download it and make adjustments in colour, background, font etc. as per your unique business setting.

Execution And Delivery Powerpoint Slides Themes
This is a execution and delivery powerpoint slides themes. This is a eight stage process. The stages in this process are sales activity management system, needs analysis and solution design, execution and delivery, support and maintenance, task coordination, sales performance analysis, sales activity reports, solution design education.
SFA Dashboard To Track Performance Ppt PowerPoint Presentation Icon Example File PDF
This Slide visually represents sales force automation dashboard to track performance which can be utilized by marketing managers to streamline the process of automated selling. It includes information about sales pipeline, competitors, opportunities, key competitors, etc. Pitch your topic with ease and precision using this sfa dashboard to track performance ppt powerpoint presentation icon example file pdf. This layout presents information on sales pipeline, sales pipeline by sales rep, key competitors, forecast by month, key opportunities. It is also available for immediate download and adjustment. So, changes can be made in the color, design, graphics or any other component to create a unique layout.

Team Selling Forecasts And Deal Conversion Report Themes PDF
This slide covers sales projections for multiple employees in a team. It includes elements such employee names, sales progress bars, closed sales revenue, planned and projected sales revenue. Pitch your topic with ease and precision using this Team Selling Forecasts And Deal Conversion Report Themes PDF. This layout presents information on Sales Progress, Employee, Team Selling Forecasts. It is also available for immediate download and adjustment. So, changes can be made in the color, design, graphics or any other component to create a unique layout.

Product Distribution Strategy Action Plan For Cosmetics Industry Mockup PDF
Following slide illustrates sales and distribution plan utilized by cosmetics industry to improve business position and successfully drive sales. This slide provides data regarding sales channels, products and services, budgeted costs, projected sales, etc. Pitch your topic with ease and precision using this Product Distribution Strategy Action Plan For Cosmetics Industry Mockup PDF. This layout presents information on Performance Indicators, Distribution Strategy, Projected Sales. It is also available for immediate download and adjustment. So, changes can be made in the color, design, graphics or any other component to create a unique layout.
Performance Analysis Of New Product Development Product Performance Dashboards Icons PDF
The following slide displays the dashboard which highlights the performance of the product, multiple metrics such as Revenues, New customer, gross profit, customer satisfaction and global sales breakdown. Deliver and pitch your topic in the best possible manner with this performance analysis of new product development product performance dashboards icons pdf. Use them to share invaluable insights on revenue, sales comparison, customer satisfaction, gross profit, new customers, sale by product category and impress your audience. This template can be altered and modified as per your expectations. So, grab it now.

Brand Engagement Promotional Campaign Implementation Technique 6 Bogo Advertising For Brand Promotion Guidelines PDF
This slide represents BOGO advertising technique. It showcase a sales tactics that enables organization in lead generation, boost sales, enhance customer engagement etc. The Brand Engagement Promotional Campaign Implementation Technique 6 Bogo Advertising For Brand Promotion Guidelines PDF is a compilation of the most recent design trends as a series of slides. It is suitable for any subject or industry presentation, containing attractive visuals and photo spots for businesses to clearly express their messages. This template contains a variety of slides for the user to input data, such as structures to contrast two elements, bullet points, and slides for written information. Slidegeeks is prepared to create an impression.
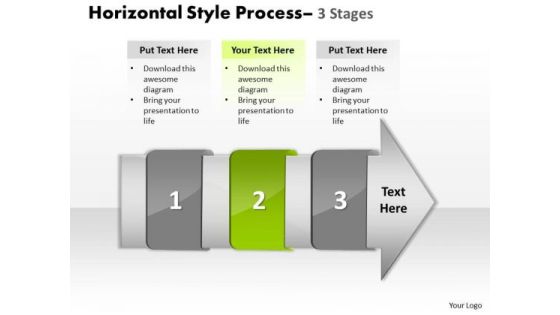
Ppt Theme Horizontal To Vertical Text Steps Working With Slide Numbers Demonstration 3 Graphic
We present our PPT Theme horizontal to vertical text steps working with slide numbers demonstration 3 Graphic. Use our Arrows PowerPoint Templates because, they help to lay the base of your trend of thought. Use our Shapes PowerPoint Templates because, Core Diagram: - Explore the various hues and layers existing in you are in your plans and processes. Use our Finance PowerPoint Templates because, Many a core idea has various enveloping layers. Use our Business PowerPoint Templates because, Marketing Strategy Business Template: - Maximizing sales of your product is the intended destination. Use our Process and Flows PowerPoint Templates because, are the stepping stones of our journey till date. Use these PowerPoint slides for presentations relating to accent, advertisement, arrow, badge, banner, business, button, collection, color, decoration, design, direction, element, financial, flow, graph, horizontal, instruction, isolated, label, manual, message, process, sale, set, shape, steps, symbol, template. The prominent colors used in the PowerPoint template are Green, Gray, and Black

Comprehensive Guide To Ecommerce Old Supply Chain Planning Approach With Key Graphics PDF
This slide showcases the old supply planning approach which involves historical sales, sales budget or budget and market intelligence which includes multiple scenarios for real demand analysis. The Comprehensive Guide To Ecommerce Old Supply Chain Planning Approach With Key Graphics PDF is a compilation of the most recent design trends as a series of slides. It is suitable for any subject or industry presentation, containing attractive visuals and photo spots for businesses to clearly express their messages. This template contains a variety of slides for the user to input data, such as structures to contrast two elements, bullet points, and slides for written information. Slidegeeks is prepared to create an impression.

Supply Network Planning And Administration Tactics Old Supply Chain Planning Approach Professional PDF
This slide showcases the old supply planning approach which involves historical sales, sales budget or budget and market intelligence which includes multiple scenarios for real demand analysis. The Supply Network Planning And Administration Tactics Old Supply Chain Planning Approach Professional PDF is a compilation of the most recent design trends as a series of slides. It is suitable for any subject or industry presentation, containing attractive visuals and photo spots for businesses to clearly express their messages. This template contains a variety of slides for the user to input data, such as structures to contrast two elements, bullet points, and slides for written information. Slidegeeks is prepared to create an impression.

Insurance Sector Obstacles Opportunities Rural Areas Business Case Competition Dashboard Download PDF
This slide shows the dashboard related to insurance company which includes sales per broker, avg time to settle by policy type, sales growth etc. Deliver and pitch your topic in the best possible manner with this insurance sector obstacles opportunities rural areas business case competition dashboard download pdf. Use them to share invaluable insights on sales growth, cost per claim, 2017 to 2022 and impress your audience. This template can be altered and modified as per your expectations. So, grab it now.

Brand Development Manual Business Performance KPI Dashboard Background PDF
Following slide covers business performance dashboard of the firm. It include KPIs such as average weekly sales revenue, above sales target, sales revenue and profit generated.Deliver an awe inspiring pitch with this creative Brand Development Manual Business Performance KPI Dashboard Background PDF bundle. Topics like Business Performance KPI Dashboard can be discussed with this completely editable template. It is available for immediate download depending on the needs and requirements of the user.
Successful Brand Development Plan Business Performance Measuring KPI Dashboard Icons PDF
Following slide covers business performance dashboard of the firm. It include KPIs such as average weekly sales revenue, above sales target, sales revenue and profit generated.Deliver and pitch your topic in the best possible manner with this successful brand development plan business performance measuring kpi dashboard icons pdf Use them to share invaluable insights on average revenue, customer lifetime value, customer acquisition cost and impress your audience. This template can be altered and modified as per your expectations. So, grab it now.

Establishing Successful Brand Strategy To Captivate Consumers Business Performance Dashboard Microsoft PDF
Following slide covers business performance dashboard of the firm. It include KPIs such as average weekly sales revenue, above sales target, sales revenue and profit generated. Deliver an awe inspiring pitch with this creative establishing successful brand strategy to captivate consumers business performance dashboard microsoft pdf bundle. Topics like customer acquisition cost, customer lifetime value, average revenue per unit can be discussed with this completely editable template. It is available for immediate download depending on the needs and requirements of the user.

Introducing A New Product To The Market Business Performance KPI Dashboard Brochure PDF
Following slide covers business performance dashboard of the firm. It include KPIs such as average weekly sales revenue, above sales target, sales revenue and profit generated.Deliver and pitch your topic in the best possible manner with this Introducing A New Product To The Market Business Performance KPI Dashboard Brochure PDF Use them to share invaluable insights on Business Performance KPI Dashboard and impress your audience. This template can be altered and modified as per your expectations. So, grab it now.

Area Chart Ppt PowerPoint Presentation Styles Professional
This is a area chart ppt powerpoint presentation styles professional. This is a two stage process. The stages in this process are sales in percentage, product, area chart.

Area Chart Ppt PowerPoint Presentation Portfolio Examples
This is a area chart ppt powerpoint presentation portfolio examples. This is a two stage process. The stages in this process are product, area chart, sales in percentage.

Area Chart Ppt PowerPoint Presentation Inspiration Images
This is a area chart ppt powerpoint presentation inspiration images. This is a two stage process. The stages in this process are area chart, product, sales in percentage.

Area Chart Ppt PowerPoint Presentation Samples
This is a area chart ppt powerpoint presentation samples. This is a two stage process. The stages in this process are financial year, sales in percentage, jan, feb.

Area Chart Ppt PowerPoint Presentation Outline Objects
This is a area chart ppt powerpoint presentation outline objects. This is a two stage process. The stages in this process are product, sales in percentage, financial year.

Area Chart Ppt PowerPoint Presentation Show
This is a area chart ppt powerpoint presentation show. This is a two stage process. The stages in this process are sales in percentage, business, marketing, analysis, success.

Area Chart Ppt PowerPoint Presentation Icon Gallery
This is a area chart ppt powerpoint presentation icon gallery. This is a two stage process. The stages in this process are sales in percentage, product, bar graph.

Area Chart Ppt PowerPoint Presentation Model Guidelines
This is a area chart ppt powerpoint presentation model guidelines. This is a two stage process. The stages in this process are product, area chart, sales in percentage.

Area Chart Ppt PowerPoint Presentation Infographics
This is a area chart ppt powerpoint presentation infographics. This is a one stage process. The stages in this process are sales in percentage, jan, feb, mar, apr.

Area Chart Ppt PowerPoint Presentation Summary Deck
This is a area chart ppt powerpoint presentation summary deck. This is a two stage process. The stages in this process are sales in percentage, financial year.

Deliver Efficiency Innovation Measuring Business Unit Performance Dashboard Background PDF
This slide covers dashboard that shows business unit performance such as new customers, average weekly sales revenue, sales revenues, profits, customer lifetime value, etc. Deliver an awe inspiring pitch with this creative Deliver Efficiency Innovation Measuring Business Unit Performance Dashboard Background PDF bundle. Topics like Customer Lifetime Value, Customer Acquisition Cost, Average Revenue Per Unit, Above Sales Target YTD can be discussed with this completely editable template. It is available for immediate download depending on the needs and requirements of the user.

Area Chart Ppt PowerPoint Presentation Icon Brochure
This is a area chart ppt powerpoint presentation icon brochure. This is a two stage process. The stages in this process are product, sales in percentage, growth, success.

Area Chart Ppt PowerPoint Presentation Pictures Designs
This is a area chart ppt powerpoint presentation pictures designs. This is a two stage process. The stages in this process are product, sales in percentage, growth, success.

Area Chart Ppt PowerPoint Presentation Professional Grid
This is a area chart ppt powerpoint presentation professional grid. This is a two stage process. The stages in this process are product, sales in percentage, business.

Brand Promotion Metric Dashboard For Performance Evaluation Introduce Promotion Plan Guidelines PDF
This slide represents brand promotion dashboard. It includes sales quantity, return quantity, cost of goods, return amount etc.Deliver an awe inspiring pitch with this creative Brand Promotion Metric Dashboard For Performance Evaluation Introduce Promotion Plan Guidelines PDF bundle. Topics like Average Sales, Net Quantity, Sales Amount can be discussed with this completely editable template. It is available for immediate download depending on the needs and requirements of the user.

Assuring Management In Product Innovation To Enhance Processes Measuring Business Unit Performance Dashboard Inspiration PDF
This slide covers dashboard that shows business unit performance such as new customers, average weekly sales revenue, sales revenues, profits, customer lifetime value, etc.Deliver an awe inspiring pitch with this creative assuring management in product innovation to enhance processes measuring business unit performance dashboard inspiration pdf bundle. Topics like average weekly sales revenue, customer lifetime value, customer acquisition cost can be discussed with this completely editable template. It is available for immediate download depending on the needs and requirements of the user.

Restaurant Monthly Selling Forecasts Based On Past Performance Microsoft PDF
This slide covers restaurant monthly sales forecast based on point of sales data. It includes elements such month, sales for past two years, variances, variance percentages along with future sales projections. Showcasing this set of slides titled Restaurant Monthly Selling Forecasts Based On Past Performance Microsoft PDF. The topics addressed in these templates are Restaurant Monthly Selling Forecasts, Past Performance. All the content presented in this PPT design is completely editable. Download it and make adjustments in color, background, font etc. as per your unique business setting.

Tactical Planning And Analyzing Organizational Goals Icon Infographics PDF
This slide defines the dashboard for analyzing the sales key performance indicators KPIs. It includes information related to the number of sales, revenue, profit, and cost. Showcasing this set of slides titled Tactical Planning And Analyzing Organizational Goals Icon Infographics PDF. The topics addressed in these templates are Cost Breakdown, Sales Revenue, Accumulated Revenue. All the content presented in this PPT design is completely editable. Download it and make adjustments in color, background, font etc. as per your unique business setting.
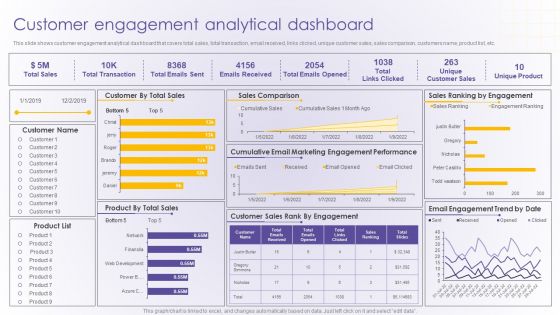
Customer Engagement Analytical Dashboard Developing Online Consumer Engagement Program Professional PDF
This slide shows customer engagement analytical dashboard that covers total sales, total transaction, email received, links clicked, unique customer sales, sales comparison, customers name, product list, etc.Deliver and pitch your topic in the best possible manner with this Customer Engagement Analytical Dashboard Developing Online Consumer Engagement Program Professional PDF. Use them to share invaluable insights on Cumulative Email, Marketing Engagement, Performance and impress your audience. This template can be altered and modified as per your expectations. So, grab it now.

Key Performance Indicators For Smarketing Ppt Icon Graphic Images PDF
This slide shows various KPIs which can be used to measure marketing and sales alignment. These are overall revenue, sales cycle length, marketing qualified leads, etc. Presenting Key Performance Indicators For Smarketing Ppt Icon Graphic Images PDF to dispense important information. This template comprises one stages. It also presents valuable insights into the topics including KPIs, Overall Revenue, Sales Cycle Length. This is a completely customizable PowerPoint theme that can be put to use immediately. So, download it and address the topic impactfully.

Marketing Promotion Analysis And Analysis Dashboard Brochure PDF
This slide defines the dashboard for assessment and analysis of promotion marketing. It includes information related to the sales, return, quantity and profits. Showcasing this set of slides titled Marketing Promotion Analysis And Analysis Dashboard Brochure PDF. The topics addressed in these templates are Sales Amount, Sales Quantity, Return Quantity. All the content presented in this PPT design is completely editable. Download it and make adjustments in color, background, font etc. as per your unique business setting.
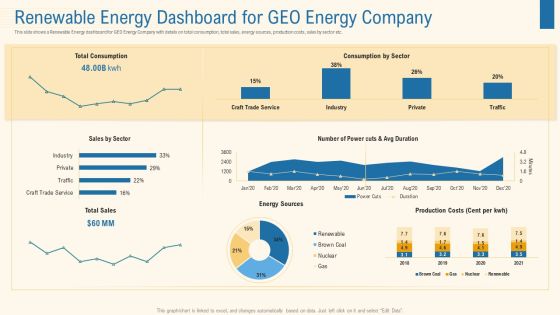
Renewable Energy Dashboard For Geo Energy Company Professional PDF
This slide shows a Renewable Energy dashboard for GEO Energy Company with details on total consumption, total sales, energy sources, production costs, sales by sector etc. Deliver and pitch your topic in the best possible manner with this renewable energy dashboard for geo energy company professional pdf. Use them to share invaluable insights on sales, industry, sources, costs, services and impress your audience. This template can be altered and modified as per your expectations. So, grab it now.

Monthly Marketing And Operation Planning Dashboard Rules PDF
This slide covers monthly sales and operations planning dashboard. It involves details such as inventory, supply, sales, CS target etc. Showcasing this set of slides titled Monthly Marketing And Operation Planning Dashboard Rules PDF. The topics addressed in these templates are Target, Sales, Supply. All the content presented in this PPT design is completely editable. Download it and make adjustments in color, background, font etc. as per your unique business setting.

Retail Store Marketing And Operations Dashboard Mockup PDF
This slide covers retail store sales and operation dashboard. It involves revenue by sales, number if customers, average transaction price, average units per consumer etc. Pitch your topic with ease and precision using this Retail Store Marketing And Operations Dashboard Mockup PDF. This layout presents information on Revenue By Sales, Customer, Average Transaction Price. It is also available for immediate download and adjustment. So, changes can be made in the color, design, graphics or any other component to create a unique layout.

Customer Engagement And Experience Customer Engagement Analytical Dashboard Slides PDF
This slide shows customer engagement analytical dashboard that covers total sales, total transaction, email received, links clicked, unique customer sales, sales comparison, customers name, product list, etc.Deliver an awe inspiring pitch with this creative Customer Engagement And Experience Customer Engagement Analytical Dashboard Slides PDF bundle. Topics like Total Transaction, Emails Received, Unique Customer can be discussed with this completely editable template. It is available for immediate download depending on the needs and requirements of the user.

Analytical Incrementalism Business Performance Measurement Metrics Download PDF
The purpose of this slide is to provide a glimpse about the business marketing performance measurement metrics after logical incrementalism approach. Deliver an awe-inspiring pitch with this creative analytical incrementalism business performance measurement metrics download pdf bundle. Topics like sales revenue, new customer, sales growth, sales region performance, profit can be discussed with this completely editable template. It is available for immediate download depending on the needs and requirements of the user.
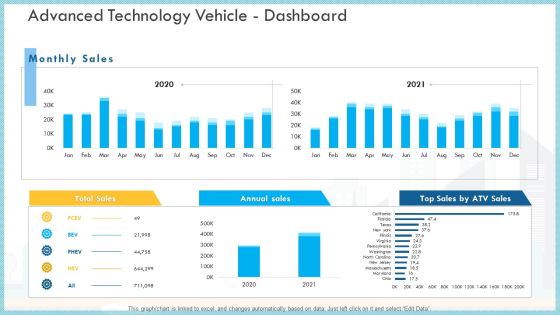
Loss Of Income And Financials Decline In An Automobile Organization Case Study Advanced Technology Vehicle Dashboard Infographics PDF
This graph or chart is linked to excel, and changes automatically based on data. Just left click on it and select Edit Data.Deliver an awe inspiring pitch with this creative loss of income and financials decline in an automobile organization case study advanced technology vehicle dashboard infographics pdf bundle. Topics like total sales, annual sales, monthly sales can be discussed with this completely editable template. It is available for immediate download depending on the needs and requirements of the user.

 Home
Home