Sales Trend

Business Diagram Ring Chart Diagram 5 Stages Sales Diagram
Doll Up Your Thoughts With Our Business_Diagram_Ring_Chart_Diagram_5_Stages_Sales_Diagram Powerpoint Templates. They Will Make A Pretty Picture.

Business Cycle Diagram Ring Chart Diagram 6 Stages Sales Diagram
Get Out Of The Dock With Our Business_Cycle_Diagram_Ring_Chart_Diagram_6_Stages_Sales_Diagram Powerpoint Templates. Your Mind Will Be Set Free.
Business Charts PowerPoint Templates Singing Smiley Emoticon With Mike Sales
Business Charts PowerPoint templates singing smiley emoticon with mike Sales-BORED!!Want some Entertainment in Life? Here it is
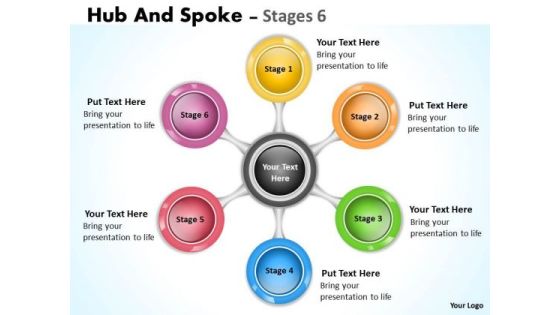
Consulting Diagram Diverging Flow Chart Business 6 Sales Diagram
Our Consulting_Diagram_Diverging_Flow_Chart_Business_6_Sales_Diagram Powerpoint Templates Team Are A Dogged Lot. They Keep At It Till They Get It Right.

Business Charts PowerPoint Templates Continuing Sequence Of Stages Sales
Business Charts PowerPoint templates continuing sequence of stages Sales-This Flower Based PowerPoint Diagram shows the continuous sequence of stages which may be used in Sales, Marketing, and Finance etc. It shows the description of each stage one by one that is by Highlighting one Petal at a time.
Business Charts PowerPoint Templates Bored Emoticon Illustration Picture Sales
Business Charts PowerPoint templates bored emoticon illustration picture Sales-This PowerPoint Diagram shows you the many types of bored emoticons expressing your feelings. This Diagram signifies disinterest, dull, fatigue, inattentive, sick and tired, spiritless, tired, turned off.
Business Charts PowerPoint Templates 3d Emoticon Showing Hyper Face Sales
Business Charts PowerPoint templates 3d emoticon showing hyper face Sales-This 3D Emoticon PowerPoint Diagram Shows you the Ferocious and annoyed face. You can use this Diagram to express your views in different situations. With this many other emoticons are attached.

Business Charts PowerPoint Templates An Illustration Of Angry Emotion Sales
Business Charts PowerPoint templates an illustration of angry emotion Sales-This PowerPoint Diagram Illustrates all the Angry Emoticons which will help you to express exasperation, irritability, antagonism etc. .You can change color, size and orientation of any icon to your liking.
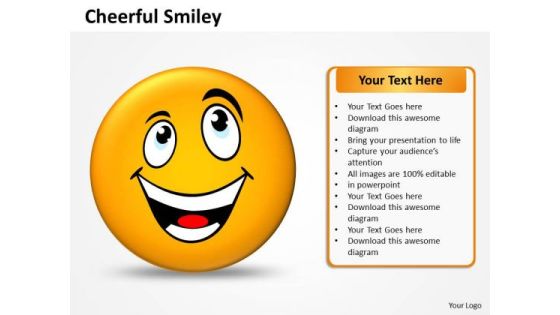
Business Charts PowerPoint Templates Design Of Cheerful Smiley Sales
Business Charts PowerPoint templates design of cheerful smiley Sales-Use this Astonishing 3D PowerPoint Diagram to express the Cheerful Situation. This Diagram symbolizes Victory, Happiness, enjoyment, joviality, joy, jubilation, laughter, lightheartedness, merriment, mirth, optimism, paradise, peace of mind.
Business Charts PowerPoint Templates Emoticon Showing Angry Face Sales
Business Charts PowerPoint templates emoticon showing angry face Sales-This 3D Emoticon PowerPoint Diagram Shows you the Ferocious and annoyed face. You can use this Diagram to express your views in resentful situations. Many other emoticons are also attached.

Flow Chart Implementation Business Plans Ppt Sales Template PowerPoint Templates
We present our flow_chart_implementation_business_plans_ppt_sales_template_PowerPoint_templates.Present our Process and Flows PowerPoint Templates because Our PowerPoint Templates and Slides will let your ideas bloom. Create a bed of roses for your audience. Present our Circle Charts PowerPoint Templates because Timeline crunches are a fact of life. Meet all deadlines using our PowerPoint Templates and Slides. Present our Business PowerPoint Templates because Our PowerPoint Templates and Slides will Embellish your thoughts. They will help you illustrate the brilliance of your ideas. Use our Shapes PowerPoint Templates because Our PowerPoint Templates and Slides are created by a hardworking bunch of busybees. Always flitting around with solutions gauranteed to please. Use our Marketing PowerPoint Templates because You canTake a leap off the starting blocks with our PowerPoint Templates and Slides. They will put you ahead of the competition in quick

Business Charts PowerPoint Templates Circle Process Time Line Editable Sales
Business Charts PowerPoint templates circle process time line editable Sales-Use this Time Line Chart Diagram to represent steps included in process. This PowerPoint Diagram shows the circles in the Arrow which is pointing towards East Direction. You can use these circles to symbolize step by step Execution.
Business Charts PowerPoint Templates Angry Emoticon Pointing Accusing Finger Sales
Business Charts PowerPoint templates angry emoticon pointing accusing finger Sales-Use this PowerPoint Diagram in which Angry emoticon pointing an accusing finger is shown. This Diagram formulates acrimony, animosity, annoyance etc. You can use this Diagram to express your views in different situations.
Business Charts PowerPoint Templates Shiney Emoticon Thinking Face Sales
Business Charts PowerPoint templates shiney emoticon thinking face Sales-Use this Thinking Face to make your PowerPoint Presentation more informative and Expressive. It imitates the concept of gleam, glimmer, glisten, glitter, glow, envision, esteem, estimate, expect, fancy, feature, feel, foresee, gather, guess, hold, image, imagine, judge, plan for, presume, project, realize, vision, visualize.
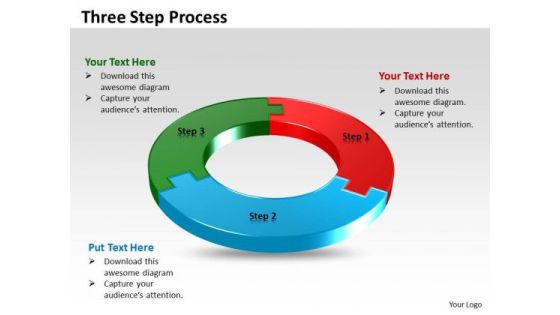
Business Charts PowerPoint Templates Three Step Circular Process Editable Sales
Business Charts PowerPoint templates three step circular process editable Sales-Use this Appealing 3D PowerPoint Diagram to explain three step in Circular Process. This Diagram symbolizes Business, Victory, Happiness, laughter, lightheartedness, merriment, mirth, optimism, paradise, peace of mind. This is an animated Diagram.
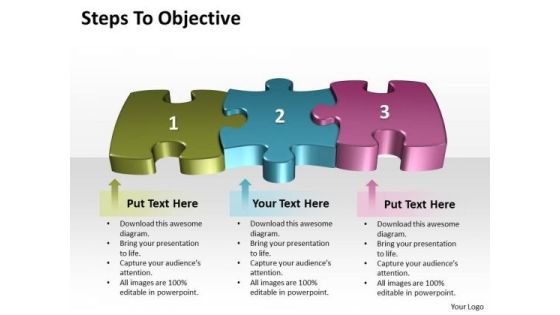
Business Charts PowerPoint Templates Steps To Objective Editable Sales
Business Charts PowerPoint templates steps to objective editable Sales-This Animated PowerPoint Diagram shows the three colorful Puzzle Pieces connected to each other. This Signifies the steps to be followed to reach the target. It shows the single color appearance in single slide.
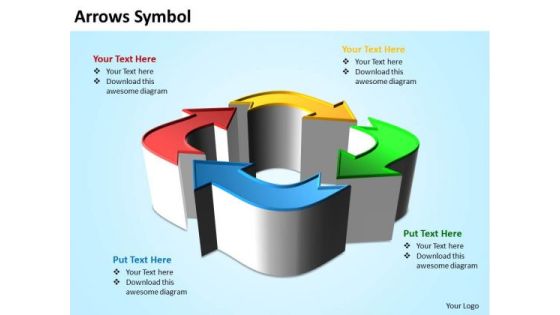
Business Charts PowerPoint Templates 3d Arrows Symbol Sales
Business Charts PowerPoint templates 3d arrows symbol Sales-This PowerPoint Diagram Shows 3D Arrows making Square like Object. This Colorful 3D Arrow Diagram will let you explain four different paths to reach the Destination. It signifies the Concept of Recycling, Reuse, Environment etc.

Business Charts PowerPoint Templates 4 Step Table Diagram Editable Sales
Business Charts PowerPoint templates 4 step table diagram editable Sales-Use this PowerPoint Diagram for step by step explanation of a Process. This diagram consists of step Table having four Steps. Each slide shows only one step with the highlighted color so that it looks more impressive and attracting.

Business Charts PowerPoint Templates Cores Issues Of Topic Editable Sales
Business Charts PowerPoint templates cores issues of topic editable Sales-This PowerPoint Diagram shows the 3D bricks placed upon one another. It consists of some red bricks which represent the Core Issues of topic about which you want to Discuss. This Powerpoint Diagram will fit for Business Presentations.
Business Charts PowerPoint Templates Design Of Confused Emoticon Sales
Business Charts PowerPoint templates design of confused emoticon Sales-This PowerPoint Diagram shows you the Designs of Confused emoticons expressing their Situation. This Diagram signifies the concept of frustration, fuddle, mess up, mislead, mortify, muddle, mystify, obscure, perplex, perturb, puzzle, shame, stir up, trouble, unhinge, unsettle, upset, and worry.
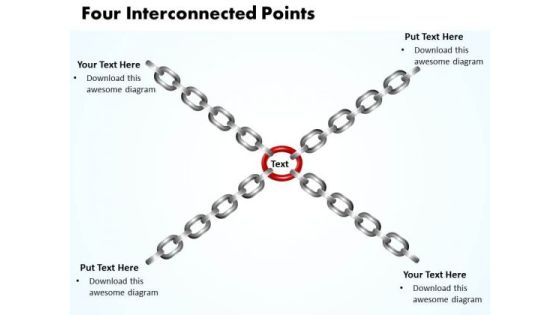
Business Charts PowerPoint Templates Four Interconnected Points Editable Sales
Business Charts PowerPoint templates four interconnected points editable Sales-This Powerpoint Diagram consists of four points connected to each other through a red Ring in the Middle. It can be used to symbolize four different Approaches which are inter-related to each other. This diagram will fit for Business Presentation
Business Charts PowerPoint Templates Naughty Emoticon Showing His Tongue Sales
Business Charts PowerPoint templates naughty emoticon showing his tongue Sales-Use this Naughty Emoticon PowerPoint Diagram to express beam, friendliness, tenderness, grin, laugh, amusement, delightful nature, happiness, pleasing nature, simper, and smirk. You can change color, size and orientation of any icon to your liking.
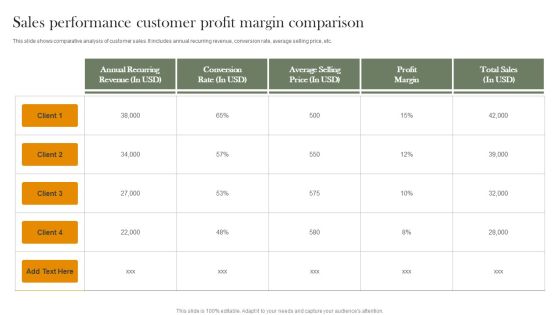
Sales Performance Customer Profit Margin Comparison Demonstration PDF
This slide shows comparative analysis of customer sales. It includes annual recurring revenue, conversion rate, average selling price, etc. Showcasing this set of slides titled SSales Performance Customer Profit Margin Comparison Demonstration PDF. The topics addressed in these templates are Annual Recurring Revenue, Conversion Rate, Average Selling Price. All the content presented in this PPT design is completely editable. Download it and make adjustments in color, background, font etc. as per your unique business setting.
Business Charts PowerPoint Templates Music Smiley Emoticon With Guitar Sales
Business Charts PowerPoint templates music smiley emoticon with guitar Sales-BORED!!Want some Entertainment in Life? Here it is Use this Music based Smiley PowerPoint Diagram to give a new start. This Diagram can be used for the following purposes: cappella, acoustic, bop, chamber, classical, folk, fusion, hard rock, harmony, hymn, instrumental, jazz, measure, melody, modern, opera, piece, plainsong, popular, ragtime, rap, refrain, rock, rock and roll, singing, song, soul, swing, tune.
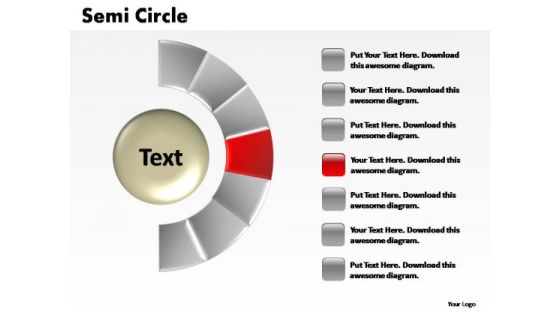
PowerPoint Designs Sales Semi Circle Ppt Slide Designs
PowerPoint_Designs_Sales_Semi_Circle_PPT_Slide_Designs.pptx-The Circle of Life - a concept emmbedded in our minds and hence easy to comprehend. Life and Business is made up of processes comprising stages that flow from one to another. An excellent graphic to attract the attention of and understanding by your audience to improve earnings.
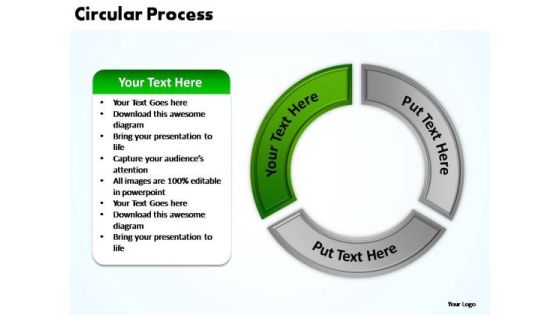
PowerPoint Slide Layout Sales Circular Process Ppt Themes
PowerPoint_Slide_layout_Sales_Circular_Process_PPT_Themes Business Power Points-Highlight the key components of your entire manufacturing/ business process. Illustrate how each element flows seamlessly onto the next stage. Emphasise on any critical or key factors within them. Demonstrate how they all combine to form the final product.-PowerPoint_Slide_layout_Sales_Circular_Process_PPT_Themes Business Power Points

PowerPoint Slide Designs Sales Circular Chart Ppt Slide Designs
PowerPoint_Slide_Designs_Sales_circular_chart_PPT_Slide_DesignsBusiness Power Points-The Circle of Life - a concept emmbedded in our minds and hence easy to comprehend. Life and Business is made up of processes comprising stages that flow from one to another. An excellent graphic to attract the attention of and understanding by your audience to improve earnings.-
Stock Charts Sales PowerPoint Templates And PowerPoint Backgrounds 0211
Microsoft PowerPoint Template and Background with three different stock chart 3d abstract render
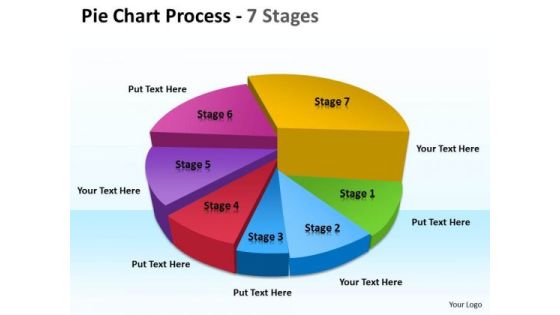
Sales Diagram Pie Chart Mba Models And Frameworks
Get The Domestics Right With Our MBA Models And Frameworks Step By Step Growth Consulting Diagram Powerpoint Templates. Create The Base For Thoughts To Grow.

Business Calculations Sales PowerPoint Templates And PowerPoint Backgrounds 0411
Microsoft PowerPoint Template and Background with business still life with coffee and chart showing success
Business Calculations Sales PowerPoint Themes And PowerPoint Slides 0411
Microsoft PowerPoint Theme and Slide with business still life with coffee and chart showing success
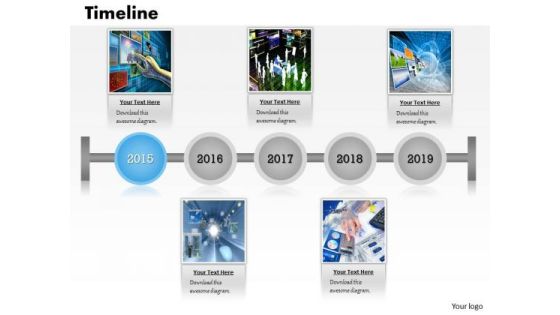
Business Diagram Data Display Business Timeline Roadmap Sales Diagram
Get Out Of The Dock With Our Business Diagram Annual Data On Timeline Roadmap Diagram Marketing Diagram Powerpoint Templates. Your Mind Will Be Set Free.
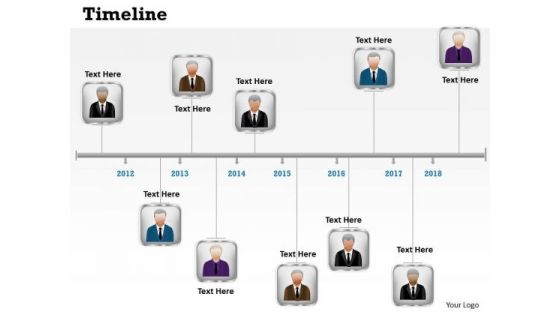
Strategic Management Linear Timeline Roadmap Business Process Diagram Sales Diagram
Rake In The Dough With
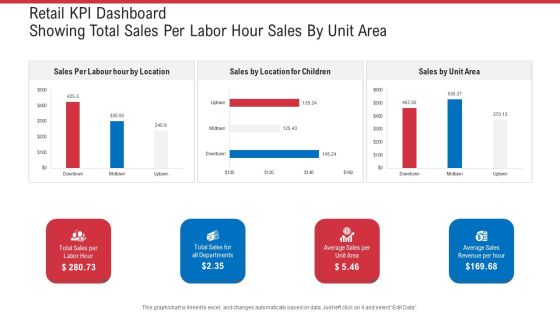
Retail KPI Dashboard Showing Total Sales Per Labor Hour Sales By Unit Area Ppt Summary Microsoft PDF
Deliver and pitch your topic in the best possible manner with this retail KPI dashboard showing total sales per labor hour sales by unit area ppt summary microsoft . Use them to share invaluable insights on total sales for all departments, average sales per unit area, average sales revenue per hour and impress your audience. This template can be altered and modified as per your expectations. So, grab it now.
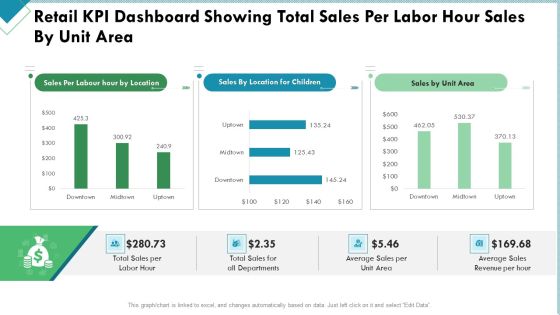
Market Analysis Of Retail Sector Retail KPI Dashboard Showing Total Sales Per Labor Hour Sales By Unit Area Themes PDF
Deliver an awe inspiring pitch with this creative market analysis of retail sector retail kpi dashboard showing total sales per labor hour sales by unit area themes pdf bundle. Topics like sales, revenue, average, departments can be discussed with this completely editable template. It is available for immediate download depending on the needs and requirements of the user.
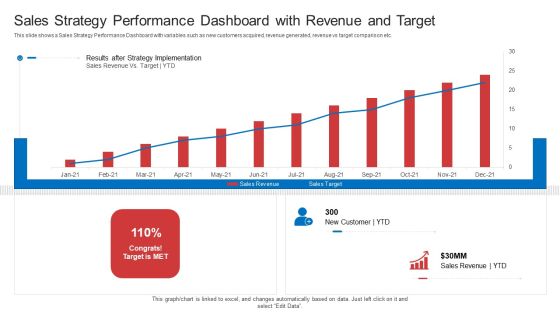
Strategic Plan To Increase Sales Volume And Revenue Sales Strategy Performance Dashboard With Revenue And Target Summary PDF
This slide shows a Sales Strategy Performance Dashboard with variables such as new customers acquired, revenue generated, revenue vs target comparison etc. Deliver and pitch your topic in the best possible manner with this strategic plan to increase sales volume and revenue sales strategy performance dashboard with revenue and target summary pdf. Use them to share invaluable insights on sales, revenue, target and impress your audience. This template can be altered and modified as per your expectations. So, grab it now.
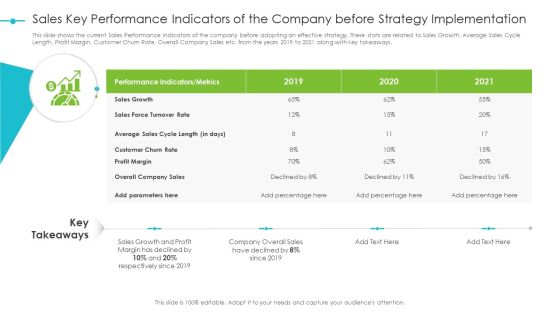
Tools For Improving Sales Plan Effectiveness Sales Key Performance Indicators Of The Company Before Strategy Implementation Topics PDF
This slide shows the current Sales Performance Indicators of the company before adopting an effective strategy. These stats are related to Sales Growth, Average Sales Cycle Length, Profit Margin, Customer Churn Rate, Overall Company Sales etc. from the years 2019 to 2021 along with key takeaways. Deliver and pitch your topic in the best possible manner with this tools for improving sales plan effectiveness sales key performance indicators of the company before strategy implementation topics pdf. Use them to share invaluable insights on sales, growth, profit margin, performance and impress your audience. This template can be altered and modified as per your expectations. So, grab it now.

Strategic Plan To Increase Sales Volume And Revenue Sales Key Performance Indicators Of The Company Before Strategy Implementation Download PDF
This slide shows the current Sales Performance Indicators of the company before adopting an effective strategy. These stats are related to Sales Growth, Average Sales Cycle Length, Profit Margin, Customer Churn Rate, Overall Company Sales etc. from the years 2019 to 2021 along with key takeaways. Deliver and pitch your topic in the best possible manner with this strategic plan to increase sales volume and revenue sales key performance indicators of the company before strategy implementation download pdf. Use them to share invaluable insights on sales, growth, profit margin, performance and impress your audience. This template can be altered and modified as per your expectations. So, grab it now.
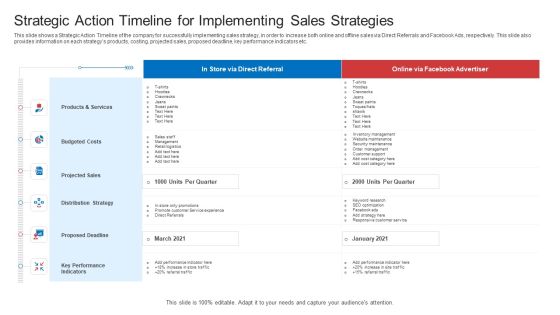
Strategic Plan To Increase Sales Volume And Revenue Strategic Action Timeline For Implementing Sales Strategies Introduction PDF
This slide shows a Strategic Action Timeline of the company for successfully implementing sales strategy, in order to increase both online and offline sales via Direct Referrals and Facebook Ads, respectively. This slide also provides information on each strategys products, costing, projected sales, proposed deadline, key performance indicators etc. Deliver an awe inspiring pitch with this creative strategic plan to increase sales volume and revenue strategic action timeline for implementing sales strategies introduction pdf bundle. Topics like products and services, budgeted costs, projected sales, distribution strategy, proposed deadline can be discussed with this completely editable template. It is available for immediate download depending on the needs and requirements of the user.
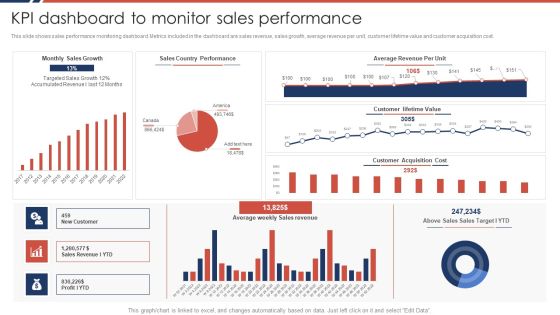
Effective Sales Plan For New Product Introduction In Market KPI Dashboard To Monitor Sales Performance Portrait PDF
This slide shows sales performance monitoring dashboard. Metrics included in the dashboard are sales revenue, sales growth, average revenue per unit, customer lifetime value and customer acquisition cost.Deliver an awe inspiring pitch with this creative Effective Sales Plan For New Product Introduction In Market KPI Dashboard To Monitor Sales Performance Portrait PDF bundle. Topics like Average Revenue, Country Performance, Customer Lifetime can be discussed with this completely editable template. It is available for immediate download depending on the needs and requirements of the user.

Cross Selling Initiatives For Online And Offline Store Sales Dashboard For FMCG Cross Selling Sales Elements PDF
Deliver an awe inspiring pitch with this creative cross selling initiatives for online and offline store sales dashboard for fmcg cross selling sales elements pdf bundle. Topics like sales dashboard for fmcg cross selling can be discussed with this completely editable template. It is available for immediate download depending on the needs and requirements of the user.

Competitive Sales Strategy Development Plan For Revenue Growth Effect On Sales Volume And Cycle Length Clipart PDF
This slide focuses on effect of competitive sales strategy on sales volume and sales cycle length time that will directly impact company revenue. Deliver and pitch your topic in the best possible manner with this Competitive Sales Strategy Development Plan For Revenue Growth Effect On Sales Volume And Cycle Length Clipart PDF. Use them to share invaluable insights on Implementation, Customer Centric Strategies, Optimizing Sales Process and impress your audience. This template can be altered and modified as per your expectations. So, grab it now.
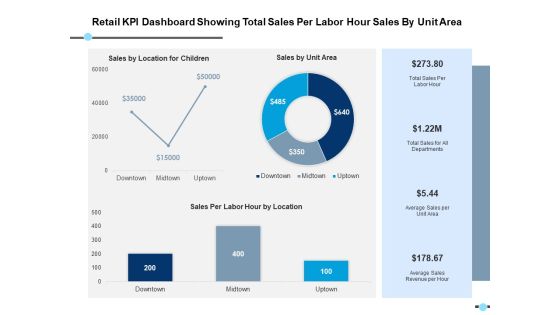
Retail Kpi Dashboard Showing Total Sales Per Labor Hour Sales By Unit Area Ppt PowerPoint Presentation Model Format
This is a retail kpi dashboard showing total sales per labor hour sales by unit area ppt powerpoint presentation model format. This is a three stage process. The stages in this process are finance, strategy, analysis, marketing.

Retail Kpi Dashboard Showing Total Sales Per Labor Hour Sales By Unit Area Ppt PowerPoint Presentation Styles Influencers
This is a retail kpi dashboard showing total sales per labor hour sales by unit area ppt powerpoint presentation styles influencers. This is a three stage process. The stages in this process are finance, marketing, management, investment, analysis.
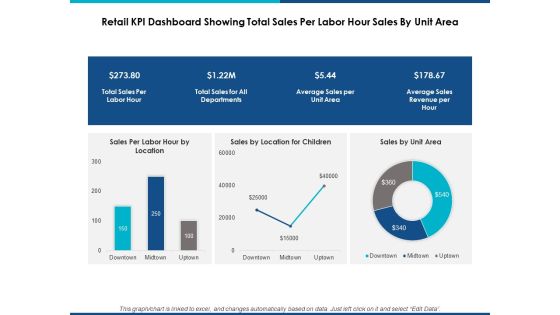
Retail Kpi Dashboard Showing Total Sales Per Labor Hour Sales By Unit Area Ppt Powerpoint Presentation Show Graphic Tips
This is a retail kpi dashboard showing total sales per labor hour sales by unit area ppt powerpoint presentation show graphic tips. This is a three stage process. The stages in this process are finance, marketing, management, investment, analysis.
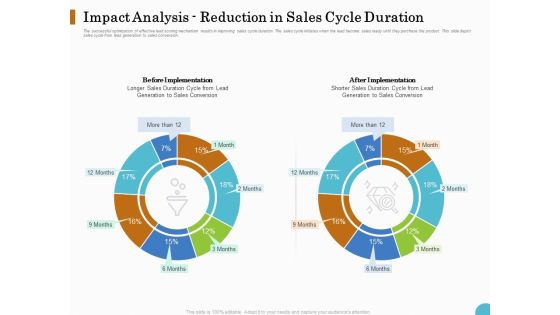
Lead Ranking Sales Methodology Model Impact Analysis Reduction In Sales Cycle Duration Ppt PowerPoint Presentation Slides Layout PDF
Presenting this set of slides with name lead ranking sales methodology model impact analysis reduction in sales cycle duration ppt powerpoint presentation slides layout pdf. The topics discussed in these slides are before implementation, after implementation, sales conversion, lead generation. This is a completely editable PowerPoint presentation and is available for immediate download. Download now and impress your audience.

Key Challenges Faced By The Company At Each Stage Sales Funnel Management Strategies To Increase Sales Background PDF
This slide shows the major challenges faced by the company ate different stages of sales funnel. Key challenges mentioned in the slide are lengthy sales cycle, lack of qualified leads, low closing rate etc.Deliver an awe inspiring pitch with this creative Key Challenges Faced By The Company At Each Stage Sales Funnel Management Strategies To Increase Sales Background PDF bundle. Topics like Percentage Challenges, Faced Stage, Sales Pipeline can be discussed with this completely editable template. It is available for immediate download depending on the needs and requirements of the user.
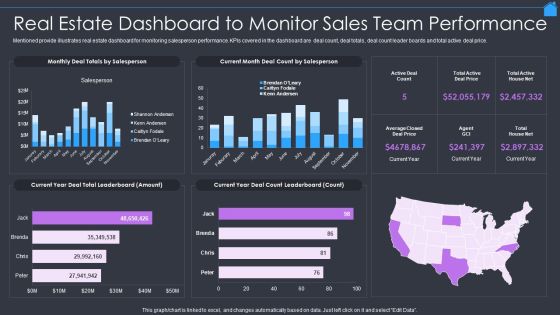
Marketing Strategy To Enhance Real Estate Sales Real Estate Dashboard To Monitor Sales Team Performance Infographics PDF
Mentioned provide illustrates real estate dashboard for monitoring salesperson performance. KPIs covered in the dashboard are deal count, deal totals, deal count leader boards and total active deal price. Deliver an awe inspiring pitch with this creative Marketing Strategy To Enhance Real Estate Sales Real Estate Dashboard To Monitor Sales Team Performance Infographics PDF bundle. Topics like Real Estate Dashboard, Monitor Sales Team Performance can be discussed with this completely editable template. It is available for immediate download depending on the needs and requirements of the user.

Sales Optimization Best Practices To Close More Deals Net Sales Business Segment Geographic Region Market Maturity Inspiration PDF
The purpose of this slide is to provide relevant information regarding the net sales generated by different business segment, net sales generated in different geographic locations and by the market maturity. Deliver an awe inspiring pitch with this creative sales optimization best practices to close more deals net sales business segment geographic region market maturity inspiration pdf bundle. Topics like business, segment, sales, geographic, maturity can be discussed with this completely editable template. It is available for immediate download depending on the needs and requirements of the user.

Process Enhancement Plan To Boost Sales Performance Problems In Sales Prospecting Methods Used By Business Graphics PDF
This slide showcases issues business is facing with existing sales prospecting methods. It includes problems such as unable to nurture deeper relationships with clients, build brand awareness among target audience and slowed sales process. Do you have to make sure that everyone on your team knows about any specific topic I yes, then you should give Process Enhancement Plan To Boost Sales Performance Problems In Sales Prospecting Methods Used By Business Graphics PDF a try. Our experts have put a lot of knowledge and effort into creating this impeccable Process Enhancement Plan To Boost Sales Performance Problems In Sales Prospecting Methods Used By Business Graphics PDF. You can use this template for your upcoming presentations, as the slides are perfect to represent even the tiniest detail. You can download these templates from the Slidegeeks website and these are easy to edit. So grab these today.
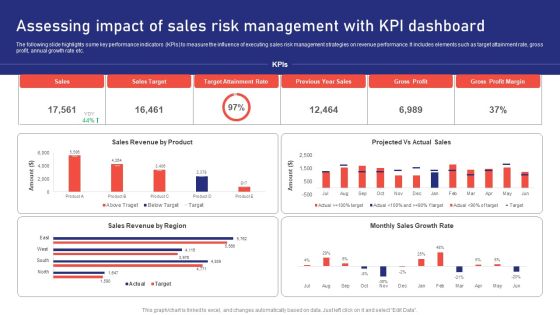
Sales Risk Assessment For Profit Maximization Assessing Impact Of Sales Risk Management With Kpi Dashboard Inspiration PDF
The following slide highlights some key performance indicators KPIs to measure the influence of executing sales risk management strategies on revenue performance. It includes elements such as target attainment rate, gross profit, annual growth rate etc. Find a pre designed and impeccable Sales Risk Assessment For Profit Maximization Assessing Impact Of Sales Risk Management With Kpi Dashboard Inspiration PDF. The templates can ace your presentation without additional effort. You can download these easy to edit presentation templates to make your presentation stand out from others. So, what are you waiting for Download the template from Slidegeeks today and give a unique touch to your presentation.

Sales Optimization Best Practices To Close More Deals Daily Reports Analysis Of Various Sales Representatives Client Professional PDF
The daily sales reports provides an overview of the state of sales activities within a firm. It helps in analyzing the performance of different sales executives or representatives. They help in tracking sales metrics that are relevant on daily basis such as number of calls, meetings set up by representatives, number of leads created, etc. This is a sales optimization best practices to close more deals daily reports analysis of various sales representatives client professional pdf template with various stages. Focus and dispense information on three stages using this creative set, that comes with editable features. It contains large content boxes to add your information on topics like cross sell rates, opportunities, sales, representatives, parameters. You can also showcase facts, figures, and other relevant content using this PPT layout. Grab it now.

Mitigating Sales Risks With Strategic Action Planning Key Metrics To Assess Effectiveness Of Sales Risk Analysis Rules PDF
The following slide highlights some key performance indicators to measure the effectiveness of sales risk evaluation on revenue performance. It includes elements such as opportunities, win rate, average time to win, sales velocity along with key insights etc. Create an editable Mitigating Sales Risks With Strategic Action Planning Key Metrics To Assess Effectiveness Of Sales Risk Analysis Rules PDF that communicates your idea and engages your audience. Whether youre presenting a business or an educational presentation, pre designed presentation templates help save time. Mitigating Sales Risks With Strategic Action Planning Key Metrics To Assess Effectiveness Of Sales Risk Analysis Rules PDF is highly customizable and very easy to edit, covering many different styles from creative to business presentations. Slidegeeks has creative team members who have crafted amazing templates. So, go and get them without any delay.
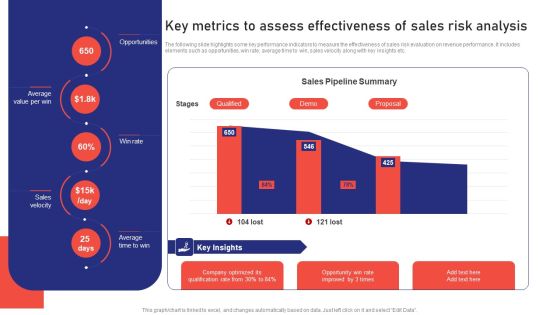
Sales Risk Assessment For Profit Maximization Key Metrics To Assess Effectiveness Of Sales Risk Analysis Ideas PDF
The following slide highlights some key performance indicators to measure the effectiveness of sales risk evaluation on revenue performance. It includes elements such as opportunities, win rate, average time to win, sales velocity along with key insights etc. Get a simple yet stunning designed Sales Risk Assessment For Profit Maximization Key Metrics To Assess Effectiveness Of Sales Risk Analysis Ideas PDF. It is the best one to establish the tone in your meetings. It is an excellent way to make your presentations highly effective. So, download this PPT today from Slidegeeks and see the positive impacts. Our easy to edit Sales Risk Assessment For Profit Maximization Key Metrics To Assess Effectiveness Of Sales Risk Analysis Ideas PDF can be your go to option for all upcoming conferences and meetings. So, what are you waiting for Grab this template today.
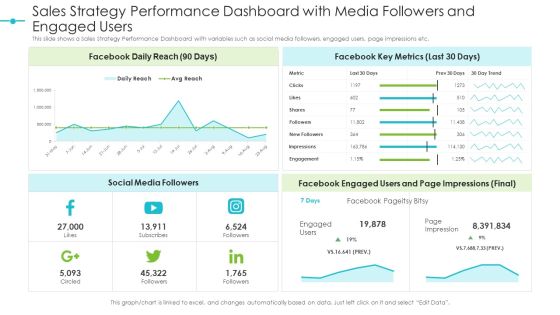
Tools For Improving Sales Plan Effectiveness Sales Strategy Performance Dashboard With Media Followers And Engaged Users Topics PDF
This slide shows a Sales Strategy Performance Dashboard with variables such as social media followers, engaged users, page impressions etc. Deliver an awe inspiring pitch with this creative tools for improving sales plan effectiveness sales strategy performance dashboard with media followers and engaged users topics pdf bundle. Topics like facebook daily reach, facebook key metrics, facebook engaged users and page impressions, social media followers can be discussed with this completely editable template. It is available for immediate download depending on the needs and requirements of the user.
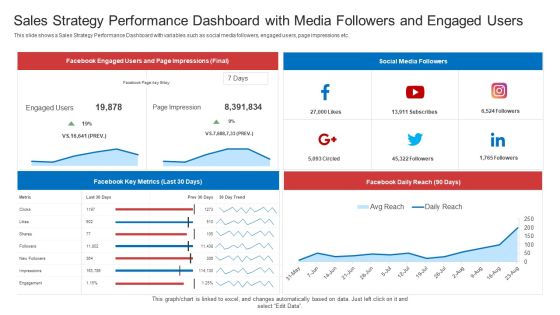
Strategic Plan To Increase Sales Volume And Revenue Sales Strategy Performance Dashboard With Media Followers And Engaged Users Topics PDF
This slide shows a Sales Strategy Performance Dashboard with variables such as social media followers, engaged users, page impressions etc. Deliver an awe inspiring pitch with this creative strategic plan to increase sales volume and revenue sales strategy performance dashboard with media followers and engaged users topics pdf bundle. Topics like facebook daily reach, facebook key metrics, facebook engaged users and page impressions, social media followers can be discussed with this completely editable template. It is available for immediate download depending on the needs and requirements of the user.

Sales Optimization Best Practices To Close More Deals What Are The Concerns Faced By Sales Department Formats PDF
The sales department needs to optimize its operations in order to improve its sales figures. But the department is facing some serious concerns that are creating hurdles in achieving it. The concerns are Bad sales team performance, high salesforce turnover, high customer churn rate. This is a sales optimization best practices to close more deals what are the concerns faced by sales department formats pdf template with various stages. Focus and dispense information on three stages using this creative set, that comes with editable features. It contains large content boxes to add your information on topics like performance, sales, salesforce, management. You can also showcase facts, figures, and other relevant content using this PPT layout. Grab it now.
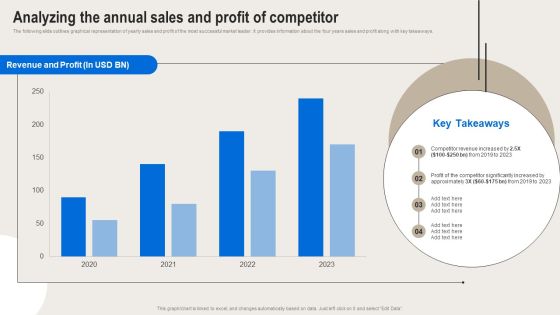
Formulating Branding Strategy To Enhance Revenue And Sales Analyzing The Annual Sales And Profit Of Competitor Mockup PDF
The following slide outlines graphical representation of yearly sales and profit of the most successful market leader. It provides information about the four years sales and profit along with key takeaways. Find a pre designed and impeccable Formulating Branding Strategy To Enhance Revenue And Sales Analyzing The Annual Sales And Profit Of Competitor Mockup PDF. The templates can ace your presentation without additional effort. You can download these easy to edit presentation templates to make your presentation stand out from others. So, what are you waiting for Download the template from Slidegeeks today and give a unique touch to your presentation.
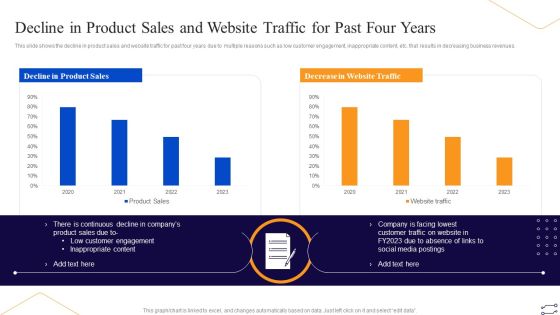
Online Marketing Tactics To Enhance Sales Decline In Product Sales And Website Traffic For Past Background PDF
This slide shows the decline in product sales and website traffic for past four years due to multiple reasons such as low customer engagement, inappropriate content, etc. that results in decreasing business revenues. Deliver an awe inspiring pitch with this creative Online Marketing Tactics To Enhance Sales Decline In Product Sales And Website Traffic For Past Background PDF bundle. Topics like Decline Product Sales, Decrease Website Traffic, 2020 To 2023 can be discussed with this completely editable template. It is available for immediate download depending on the needs and requirements of the user.
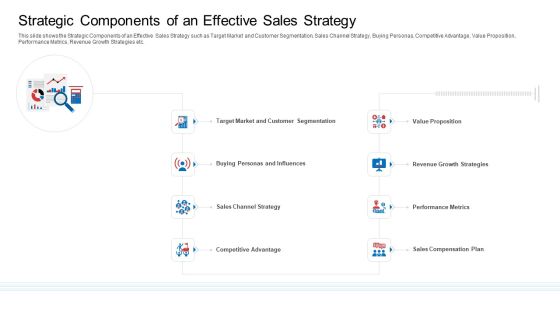
Strategic Plan To Increase Sales Volume And Revenue Strategic Components Of An Effective Sales Strategy Microsoft PDF
This slide shows the Strategic Components of an Effective Sales Strategy such as Target Market and Customer Segmentation, Sales Channel Strategy, Buying Personas, Competitive Advantage, Value Proposition, Performance Metrics, Revenue Growth Strategies etc. Presenting strategic plan to increase sales volume and revenue strategic components of an effective sales strategy microsoft pdf to provide visual cues and insights. Share and navigate important information on eight stages that need your due attention. This template can be used to pitch topics like value proposition, performance metrics, growth strategies, compensation plan, competitive advantage. In addtion, this PPT design contains high resolution images, graphics, etc, that are easily editable and available for immediate download.

 Home
Home