AI PPT Maker
Templates
PPT Bundles
Design Services
Business PPTs
Business Plan
Management
Strategy
Introduction PPT
Roadmap
Self Introduction
Timelines
Process
Marketing
Agenda
Technology
Medical
Startup Business Plan
Cyber Security
Dashboards
SWOT
Proposals
Education
Pitch Deck
Digital Marketing
KPIs
Project Management
Product Management
Artificial Intelligence
Target Market
Communication
Supply Chain
Google Slides
Research Services
 One Pagers
All Categories
-
Home
- Customer Favorites
- Sales Trend
Sales Trend

Business Organizational Chart Powerpoint Templates Download
This is a business organizational chart powerpoint templates download. This is a four stage process. The stages in this process are marketing, sales, production, finance.

Hiring Planning Process Chart Powerpoint Slide Show
This is a hiring planning process chart powerpoint slide show. This is a five stage process. The stages in this process are finance, support, product, marketing, sales, engineering.

Combo Chart Ppt PowerPoint Presentation Icon Rules
This is a combo chart ppt powerpoint presentation icon rules. This is a ten stage process. The stages in this process are cumulative, value, sales, graph, business.

Campaign Performance Ppt Powerpoint Presentation Visual Aids Layouts
This is a campaign performance ppt powerpoint presentation visual aids layouts. This is a four stage process. The stages in this process are brand, leads, sales, loyalty.

Bar Chart Marketing Ppt PowerPoint Presentation Outline Deck
This is a bar chart marketing ppt powerpoint presentation outline deck. This is a two stage process. The stages in this process are business, management, marketing, financial, sales.

Combo Chart Product Ppt PowerPoint Presentation Slides Aids
This is a combo chart product ppt powerpoint presentation slides aids. This is a three stage process. The stages in this process are business, management, marketing, strategy, sales.

Bubble Chart Product Ppt PowerPoint Presentation Infographics Backgrounds
This is a bubble chart product ppt powerpoint presentation infographics backgrounds. This is a two stage process. The stages in this process are business, management, strategy, marketing, sales.

Deployment Of Marketing Tools Chart Powerpoint Slide Designs
This is a deployment of marketing tools chart powerpoint slide designs. This is a three stage process. The stages in this process are sales, customer service, marketing.

Hierarchy Chart Ppt PowerPoint Presentation Model Graphics Pictures
This is a hierarchy chart ppt powerpoint presentation model graphics pictures. This is a four stage process. The stages in this process are ceo, accountant, sales, developer, designer.
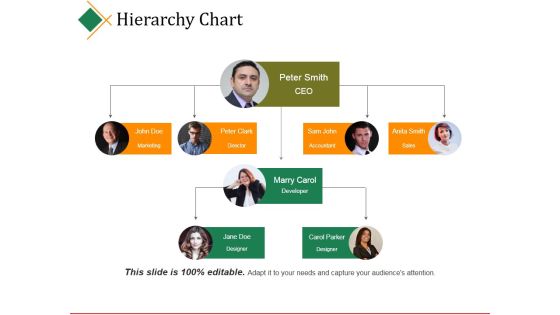
Hierarchy Chart Ppt PowerPoint Presentation Infographic Template Graphics
This is a hierarchy chart ppt powerpoint presentation infographic template graphics. This is a four stage process. The stages in this process are ceo, director, accountant, sales, developer.
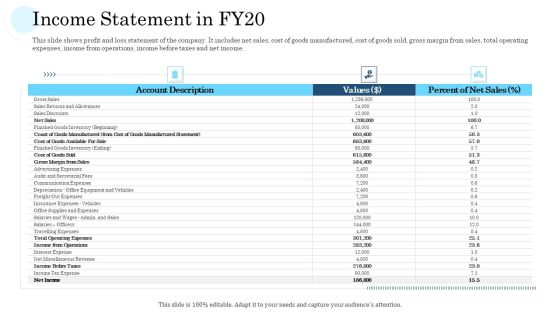
Mass Producing Firm Performance Assessment Income Statement In FY20 Information PDF
This slide shows profit and loss statement of the company. It includes net sales, cost of goods manufactured, cost of goods sold, gross margin from sales, total operating expenses, income from operations, income before taxes and net income.Deliver an awe-inspiring pitch with this creative mass producing firm performance assessment income statement in fy20 information pdf. bundle. Topics like net sales, gross sales, values can be discussed with this completely editable template. It is available for immediate download depending on the needs and requirements of the user.

Capital Investment Options Financial Ratios Defining Project Feasibility Guidelines PDF
Mentioned slide provides details about project feasibility financial ratio along with graphical representation. Ratios covered in the slide are net profit sales, quick ratio, debt equity ratio and gross profit sales. Deliver an awe inspiring pitch with this creative Capital Investment Options Financial Ratios Defining Project Feasibility Guidelines PDF bundle. Topics like Net Profit Sales, Quick Ratio, Debt Equity Ratio can be discussed with this completely editable template. It is available for immediate download depending on the needs and requirements of the user.
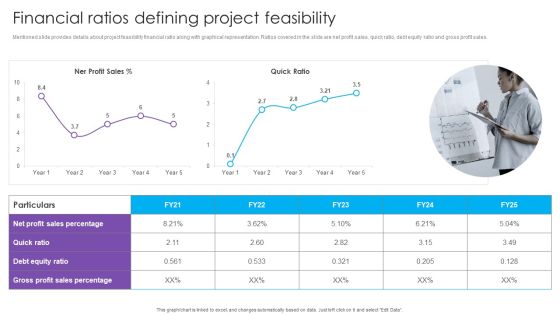
Financial Ratios Defining Project Feasibility Real Estate Project Funding Clipart PDF
Mentioned slide provides details about project feasibility financial ratio along with graphical representation. Ratios covered in the slide are net profit sales, quick ratio, debt equity ratio and gross profit sales.Deliver an awe inspiring pitch with this creative Financial Ratios Defining Project Feasibility Real Estate Project Funding Clipart PDF bundle. Topics like Profit Sales, Debt Equity, Gross Profit can be discussed with this completely editable template. It is available for immediate download depending on the needs and requirements of the user.

Brand Performance Dashboard Ppt PowerPoint Presentation Professional Grid
This is a brand performance dashboard ppt powerpoint presentation professional grid. This is a three stage process. The stages in this process are customer recognition, enhanced sales, competitive edge, dashboard, business.

Brand Performance Dashboard Ppt PowerPoint Presentation Layouts Summary
This is a brand performance dashboard ppt powerpoint presentation layouts summary. This is a three stage process. The stages in this process are customer recognition, enhanced sales, competitive edge, dashboard, business.

Brand Performance Dashboard Ppt PowerPoint Presentation Show Graphic Tips
This is a brand performance dashboard ppt powerpoint presentation show graphic tips. This is a three stage process. The stages in this process are customer recognition, enhanced sales, competitive edge, dashboard, business, percentage.

Brand Performance Dashboard Ppt PowerPoint Presentation Infographics Shapes
This is a brand performance dashboard ppt powerpoint presentation infographics shapes. This is a three stage process. The stages in this process are customer recognition, enhanced sales, competitive edge.

Brand Performance Dashboard Ppt PowerPoint Presentation Icon Microsoft
This is a brand performance dashboard ppt powerpoint presentation icon microsoft. This is a three stage process. The stages in this process are customer recognition, enhanced sales, competitive edge.

Brand Performance Dashboard Ppt PowerPoint Presentation Infographic Template Designs
This is a brand performance dashboard ppt powerpoint presentation infographic template designs. This is a three stage process. The stages in this process are customer recognition, enhanced sales, competitive edge.
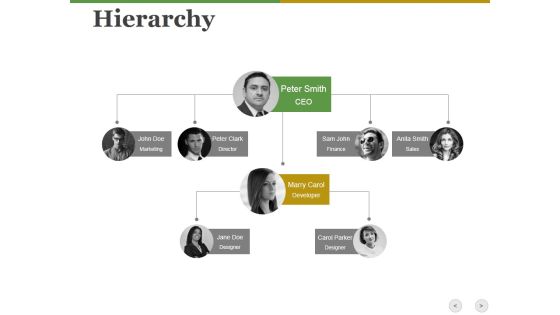
Hierarchy Ppt PowerPoint Presentation Gallery Elements
This is a hierarchy ppt powerpoint presentation gallery elements. This is a four stage process. The stages in this process are marketing, director, ceo, finance, sales, developer, designer.

Organizational Structure Ppt PowerPoint Presentation Show Slides
This is a organizational structure ppt powerpoint presentation show slides. This is a three stage process. The stages in this process are director marketing, director sales, ceo, manager.
Organizational Structure Ppt PowerPoint Presentation File Icon
This is a organizational structure ppt powerpoint presentation file icon. This is a two stage process. The stages in this process are manager, director marketing, director sales, employee.

Optimizing Media Budget Ppt PowerPoint Presentation Inspiration
This is a optimizing media budget ppt powerpoint presentation inspiration. This is a three stage process. The stages in this process are media spend, traffic, sales.
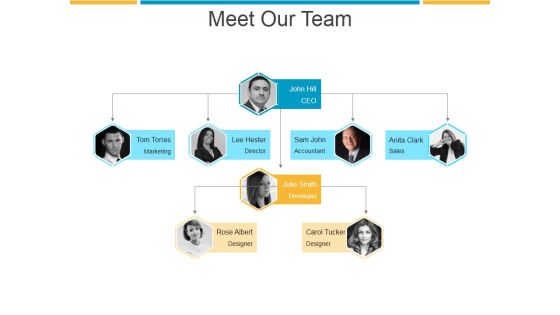
Meet Our Team Ppt PowerPoint Presentation Professional
This is a meet our team ppt powerpoint presentation professional. This is a three stage process. The stages in this process are marketing, director, accountant, sales, designer.
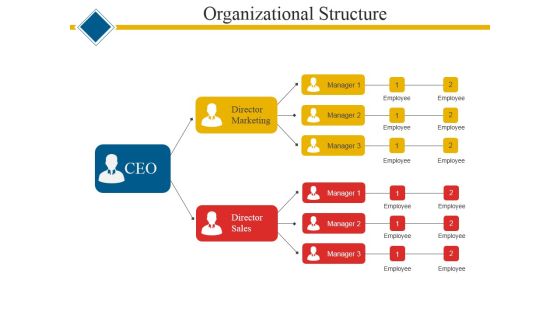
Organizational Structure Ppt PowerPoint Presentation Ideas Samples
This is a organizational structure ppt powerpoint presentation ideas samples. This is a two stage process. The stages in this process are director marketing, director sales, employee, manager.

Closed Loop Supply Chain Management Reverse Logistics Dashboard Ppt File Demonstration PDF
Presenting this set of slides with name closed loop supply chain management reverse logistics dashboard ppt file demonstration pdf. The topics discussed in these slides are sales, sales, order, need attention, product. This is a completely editable PowerPoint presentation and is available for immediate download. Download now and impress your audience.

Hiring Plan Ppt PowerPoint Presentation Graphics
This is a hiring plan ppt powerpoint presentation graphics. This is a five stage process. The stages in this process are finance, support, product, marketing, sales, engineering .
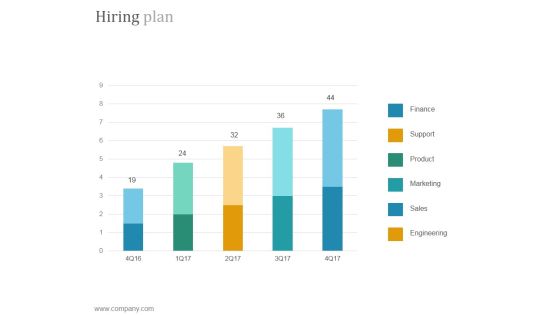
Hiring Plan Ppt PowerPoint Presentation Tips
This is a hiring plan ppt powerpoint presentation tips. This is a five stage process. The stages in this process are finance, support, product, marketing, sales, engineering.
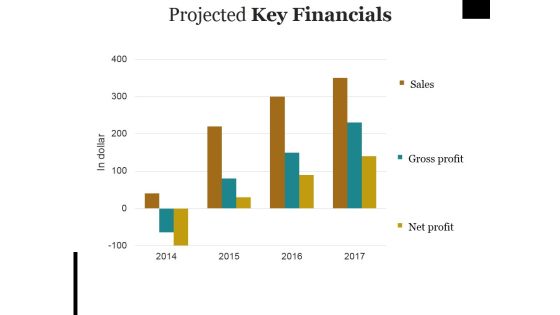
Projected Key Financials Ppt PowerPoint Presentation Pictures Objects
This is a projected key financials ppt powerpoint presentation pictures objects. This is a three stage process. The stages in this process are sales, gross profit, net profit.

Risk Capital Management Ppt Layout Powerpoint Slide Download
This is a risk capital management ppt layout powerpoint slide download. This is a five stage process. The stages in this process are risk, performance, organization, legal, sales.
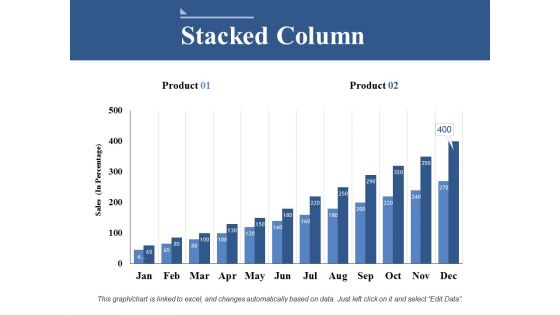
Stacked Column Ppt PowerPoint Presentation Model Information
This is a stacked column ppt powerpoint presentation model information. This is a two stage process. The stages in this process are business, sales, marketing, finance, strategy.
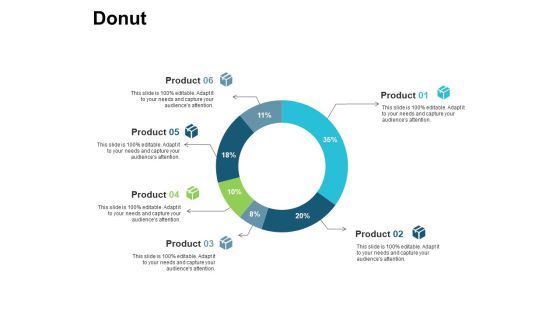
Donut Ppt PowerPoint Presentation Inspiration Files
This is a donut ppt powerpoint presentation inspiration files. This is a six stage process. The stages in this process are business, management, marketing, strategy, sales.
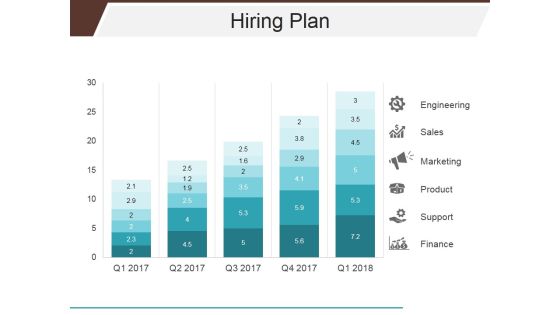
Hiring Plan Ppt PowerPoint Presentation Slide
This is a hiring plan ppt powerpoint presentation slide. This is a five stage process. The stages in this process are engineering, sales, marketing, product, support, finance.

Department Wise Recruitment Plan Data Ppt Infographics
This is a department wise recruitment plan data ppt infographics. This is a five stage process. The stages in this process are finance, support, product, marketing, sales, engineering.
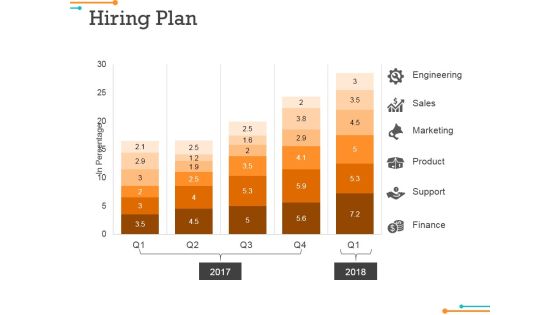
Hiring Plan Ppt Powerpoint Presentation Show Files
This is a hiring plan ppt powerpoint presentation show files. This is a five stage process. The stages in this process are engineering, sales, marketing, product.

Competitor Analysis Ppt PowerPoint Presentation Infographic Template Elements
This is a competitor analysis ppt powerpoint presentation infographic template elements. This is a four stage process. The stages in this process are revenue, sales, business, marketing, finance.
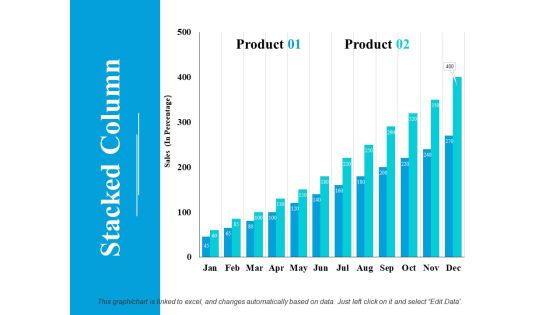
Stacked Column Ppt PowerPoint Presentation Model Inspiration
This is a stacked column ppt powerpoint presentation model inspiration. This is a two stage process. The stages in this process are product, sales, stacked column.

Key Financial Ppt PowerPoint Presentation Inspiration Design Ideas
This is a key financial ppt powerpoint presentation inspiration design ideas. This is a three stage process. The stages in this process are financial, business, sales, marketing, success.
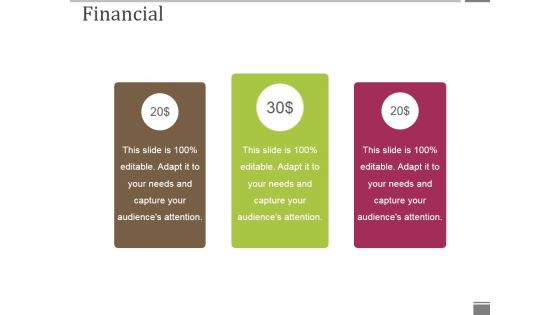
Financial Ppt PowerPoint Presentation Slides Inspiration
This is a financial ppt powerpoint presentation slides inspiration. This is a three stage process. The stages in this process are financial, business, marketing, management, sales.
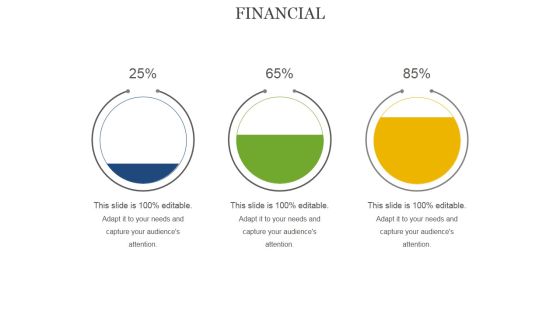
Financial Ppt PowerPoint Presentation Ideas Graphics Download
This is a financial ppt powerpoint presentation ideas graphics download. This is a three stage process. The stages in this process are financial, process., sales, plan, business.
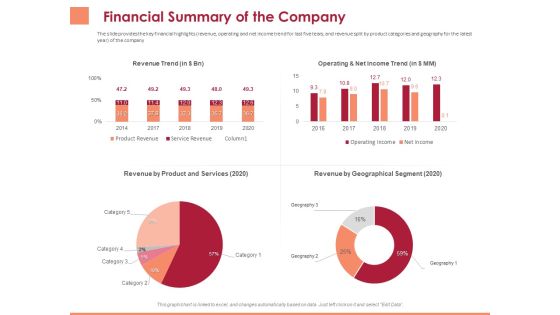
Pitch Deck To Raise Funding From Equity Crowdfunding Financial Summary Of The Company Ppt File Grid PDF
Presenting this set of slides with name pitch deck to raise funding from equity crowdfunding financial summary of the company ppt file grid pdf. The topics discussed in these slides are revenue trend, operating and net income trend, revenue product and services, revenue geographical segment. This is a completely editable PowerPoint presentation and is available for immediate download. Download now and impress your audience.
Startup Presentation For Collaborative Capital Funding Financial Summary Of The Company Diagrams PDF
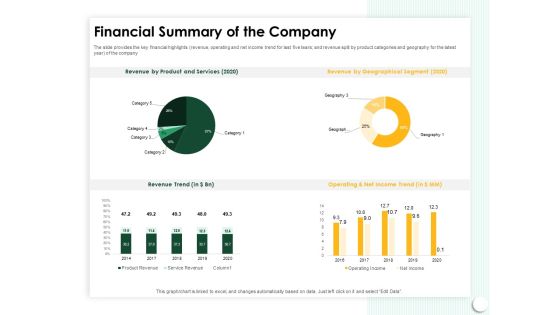
Presenting this set of slides with name startup presentation for collaborative capital funding financial summary of the company diagrams pdf. The topics discussed in these slides are revenue by product and services 2020, revenue by geographical segment 2020, revenue trend, operating and net income trend. This is a completely editable PowerPoint presentation and is available for immediate download. Download now and impress your audience.

Investor Presentation For Society Funding Financial Summary Of The Company Inspiration PDF
Presenting this set of slides with name investor presentation for society funding financial summary of the company inspiration pdf. The topics discussed in these slides are revenue by product and services 2020, revenue by geographical segment 2020, revenue trend, operating and net income trend. This is a completely editable PowerPoint presentation and is available for immediate download. Download now and impress your audience.

Product Introduction Stage Timeline Powerpoint Slide Clipart
This is a product introduction stage timeline powerpoint slide clipart. This is a five stage process. The stages in this process are cost, target, competition, profits, sales.

KPI Dashboard To Track Amazon Performance Ppt Styles Guidelines PDF
This slide provides information regarding dashboard to monitor Amazon performance. The KPIs include tracking of product sales, conversion rate, advertising spends, session, organic sales, etc. There are so many reasons you need a KPI Dashboard To Track Amazon Performance Ppt Styles Guidelines PDF. The first reason is you can not spend time making everything from scratch, Thus, Slidegeeks has made presentation templates for you too. You can easily download these templates from our website easily.
The Csr Model Ppt PowerPoint Presentation Model Format Ideas
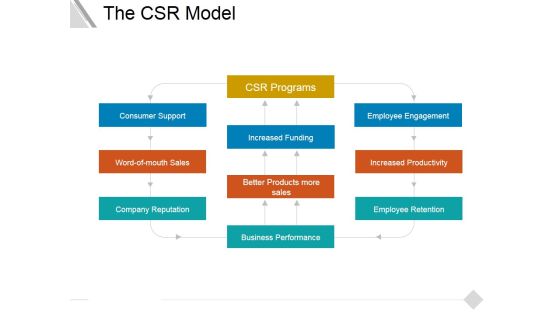
This is a the csr model ppt powerpoint presentation model format ideas. This is a ten stage process. The stages in this process are consumer support, word of mouth sales, company reputation, increased funding, employee engagement, increased productivity, better products more sales, business performance, employee retention.

Kpis To Measure Performance Of Viral Promotional Campaign Topics PDF
This slide shows KPI metrics to measure performance of viral marketing strategy. It includes sales, website traffic, blog post visits, etc. Showcasing this set of slides titled Kpis To Measure Performance Of Viral Promotional Campaign Topics PDF. The topics addressed in these templates are Website Traffic, Sales, Blog Post Visits, Conversion Rate. All the content presented in this PPT design is completely editable. Download it and make adjustments in color, background, font etc. as per your unique business setting.
Projected Key Financials Template Ppt PowerPoint Presentation Styles Graphics Design
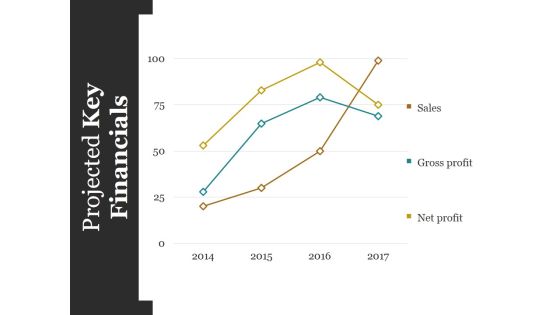
This is a projected key financials template ppt powerpoint presentation styles graphics design. This is a four stage process. The stages in this process are sales, gross profit, net profit.
Key Performance Ideas Pricing Sample Ppt Infographics
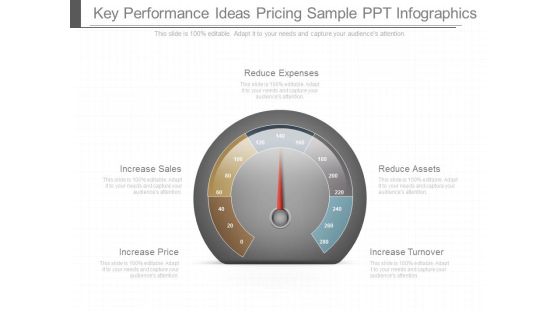
This is a key performance ideas pricing sample ppt infographics. This is a five stage process. The stages in this process are increase price, increase sales, reduce expenses, reduce assets, increase turnover.

Loyalty Program Performance Ppt PowerPoint Presentation Tips
This is a loyalty program performance ppt powerpoint presentation tips. This is a four stage process. The stages in this process are enrollments, reward outstanding, loyalty revenue, gift sales.
Steps In M And A Process Profitability Ratios Icon Graphics PDF
Deliver an awe inspiring pitch with this creative steps in m and a process profitability ratios icon graphics pdf bundle. Topics like Net Profit After Tax Or Net Sales, Gross Profit Or Net Sales, Gross Profit Ratio can be discussed with this completely editable template. It is available for immediate download depending on the needs and requirements of the user.

Metrics To Measure Business Performance Financial Performance Indicator Dashboard Pictures PDF
This slide shows financial performance indicator dashboard covering net profit and net sales, profitability indicator ratios, cogs and net profit by region or channel. Deliver an awe inspiring pitch with this creative Metrics To Measure Business Performance Financial Performance Indicator Dashboard Pictures PDF bundle. Topics like Net Profit, Net Sales, Cost Goods, Sold Breakdown can be discussed with this completely editable template. It is available for immediate download depending on the needs and requirements of the user.

Business Kpi Dashboard Diagram Powerpoint Templates
This is a business kpi dashboard diagram powerpoint templates. This is a six stage process. The stages in this process are analytics, cost per sales, reporting, kpis, dashboard, visualization.
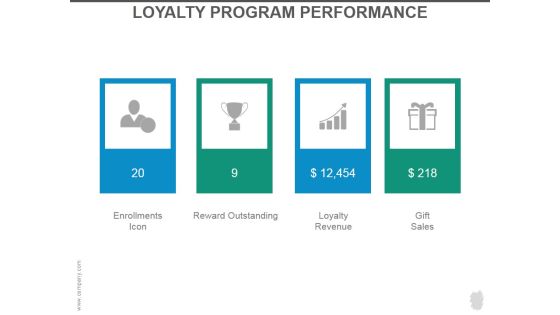
Loyalty Program Performance Ppt PowerPoint Presentation Slides
This is a loyalty program performance ppt powerpoint presentation slides. This is a four stage process. The stages in this process are enrollments icon, reward outstanding, loyalty revenue, gift sales.

Loyalty Program Performance Ppt PowerPoint Presentation Introduction
This is a loyalty program performance ppt powerpoint presentation introduction. This is a four stage process. The stages in this process are enrollments icon, reward outstanding, loyalty revenue, gift sales.

Channel Kpis Ppt PowerPoint Presentation Ideas
This is a channel kpis ppt powerpoint presentation ideas. This is a four stage process. The stages in this process are inspiration, evaluation, purchase, after sales, catalog magazine, call center, instore displays.
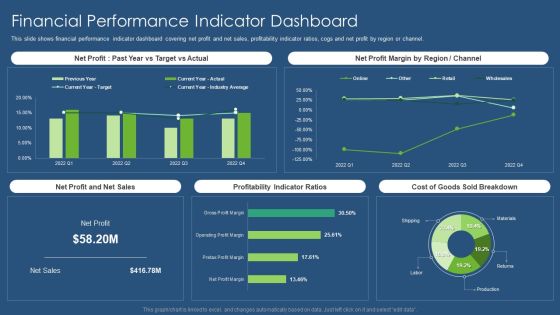
Sustainability Calculation With KPI Financial Performance Indicator Dashboard Infographics PDF Template PDF
This slide shows financial performance indicator dashboard covering net profit and net sales, profitability indicator ratios, cogs and net profit by region or channel. Deliver an awe inspiring pitch with this creative sustainability calculation with kpi financial performance indicator dashboard infographics pdf bundle. Topics like net profit margin, net profit and net sales, profitability indicator ratios, sold breakdown can be discussed with this completely editable template. It is available for immediate download depending on the needs and requirements of the user.
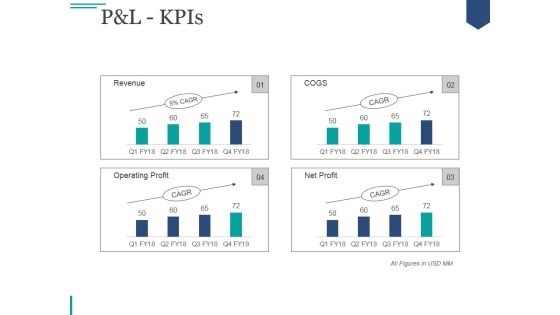
Pandl Kpis Ppt PowerPoint Presentation Deck
This is a pandl kpis ppt powerpoint presentation deck. This is a four stage process. The stages in this process are net sales, other income, total income, expenses, total material consumed.

Pandl Kpis Ppt PowerPoint Presentation Gallery Slides
This is a pandl kpis ppt powerpoint presentation gallery slides. This is a four stage process. The stages in this process are net sales, other income, total income, expenses, total material consumed.

Finance Dashboard Ppt PowerPoint Presentation Model Graphics Example
This is a finance dashboard ppt powerpoint presentation model graphics example. This is a two stage process. The stages in this process are sales, operating expenses, operating income, net income.

Pandl Kpis Ppt PowerPoint Presentation Gallery Display
This is a pandl kpis ppt powerpoint presentation gallery display. This is a four stage process. The stages in this process are net sales, total income, expenses, ebitda, profit after tax.

Pharmaceutical Quality Research And Development Investment Report Ppt PowerPoint Presentation Model Slides PDF
This slide displays statistical summary for pharmaceutical quality assurance investments made by company over the years. It further includes details about yearly sales. Showcasing this set of slides titled Pharmaceutical Quality Research And Development Investment Report Ppt PowerPoint Presentation Model Slides PDF. The topics addressed in these templates are Current Quarter, Current Sales, Percentage Sale. All the content presented in this PPT design is completely editable. Download it and make adjustments in color, background, font etc. as per your unique business setting.

Capital Markets Dashboard Ppt Powerpoint Slide Background
This is a capital markets dashboard ppt powerpoint slide background. This is a three stage process. The stages in this process are weekly sales, product inventory, key performance indicators.

P And L Kpis Ppt PowerPoint Presentation Portfolio Slide
This is a p and l kpis ppt powerpoint presentation portfolio slide. This is a four stage process. The stages in this process are ebitda, profit before tax, profit after tax, expenses, net sales.
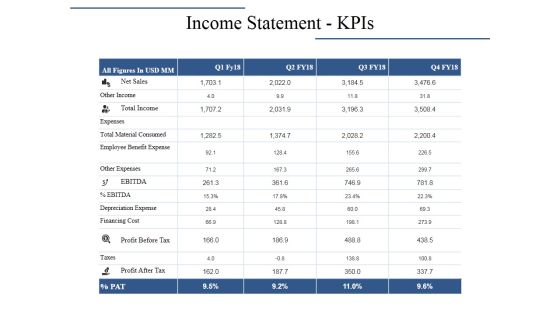
Income Statement Kpis Ppt PowerPoint Presentation Layouts Graphics Pictures
This is a income statement kpis ppt powerpoint presentation layouts graphics pictures. This is a four stage process. The stages in this process are net sales, total income, other income, profit before tax, expenses.

Income Statement Kpis Ppt PowerPoint Presentation Styles Clipart Images
This is a income statement kpis ppt powerpoint presentation styles clipart images. This is a four stage process. The stages in this process are net sales, other income, total income, expenses, total material consumed.
Income Statement Kpis Ppt PowerPoint Presentation Icon Background Images
This is a income statement kpis ppt powerpoint presentation icon background images. This is a four stage process. The stages in this process are net sales, other income, expenses, other expenses, total material consumed.
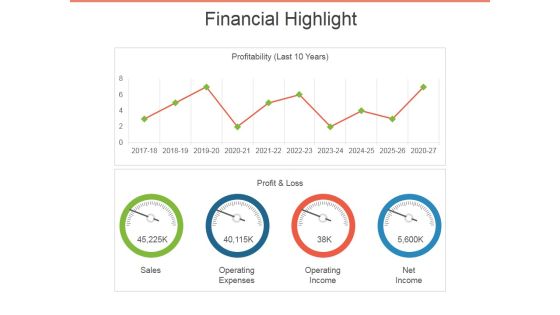
Financial Highlight Template 2 Ppt PowerPoint Presentation Outline Visuals
This is a financial highlight template 2 ppt powerpoint presentation outline visuals. This is a two stage process. The stages in this process are sales, profit and loss, operating expenses, operating income, net income.

Pandl Kpis Tabular Form Ppt PowerPoint Presentation Outline Background
This is a pandl kpis tabular form ppt powerpoint presentation outline background. This is a four stage process. The stages in this process are net sales, expenses, ebitda, profit before tax, profit after tax.
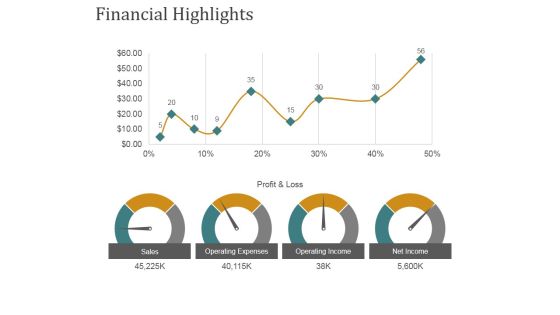
Financial Highlights Template 1 Ppt PowerPoint Presentation Gallery Templates
This is a financial highlights template 1 ppt powerpoint presentation gallery templates. This is a four stage process. The stages in this process are sales, operating expenses, operating income, net income.

Pandl Kpis Ppt PowerPoint Presentation Infographic Template Layout
This is a pandl kpis ppt powerpoint presentation infographic template layout. This is a four stage process. The stages in this process are net sales, other income, total income, expenses, total material consumed.
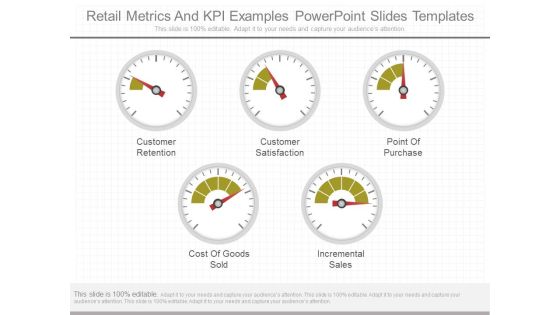
Retail Metrics And Kpi Examples Powerpoint Slides Templates
This is a retail metrics and kpi examples powerpoint slides templates. This is a five stage process. The stages in this process are customer retention, customer satisfaction, point of purchase, cost of goods sold, incremental sales.
Pandl Kpis Tabular Form Ppt PowerPoint Presentation Icon
This is a pandl kpis tabular form ppt powerpoint presentation icon. This is a four stage process. The stages in this process are business, net sales, total income, expenses, profit before tax, profit after tax.
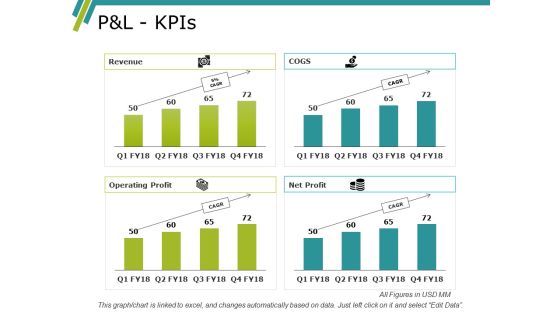
Pandl Kpis Ppt PowerPoint Presentation Slides Designs Download
This is a pandl kpis ppt powerpoint presentation slides designs download. This is a four stage process. The stages in this process are net sales, table, planning, cost, management.
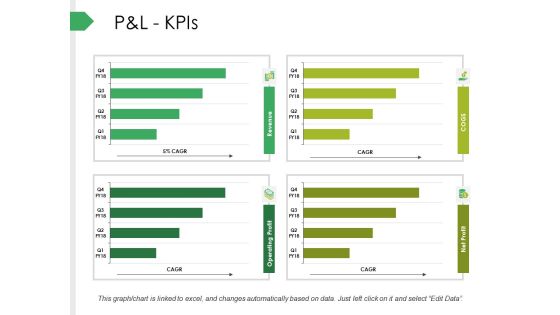
P And L Kpis Ppt PowerPoint Presentation Infographics Background
This is a p and l kpis ppt powerpoint presentation infographics background. This is a four stage process. The stages in this process are net sales, expenses, ebitda, profit before tax, profit after tax.

Professional Retail Merchandising Chart Presentation Design
This is a professional retail merchandising chart presentation design. This is a seven stage process. The stages in this process are market trends, product assortment, individual product demand forecasting, product display and advertising, inventory, markdowns, purchase quantity, merchandising.

P And L Kpis Template 2 Ppt PowerPoint Presentation Outline Clipart
This is a p and l kpis template 2 ppt powerpoint presentation outline clipart. This is a four stage process. The stages in this process are net sales, total income, expenses, profit before tax, profit after tax.

Financial Highlights Growth Analysis Dashboard Powerpoint Slide
This is a financial highlights growth analysis dashboard powerpoint slide. This is a four stage process. The stages in this process are profit and loss, sales, operating expenses, operating income, net income, profitability.

Finance Dashboard Ppt PowerPoint Presentation Design Ideas
This is a finance dashboard ppt powerpoint presentation design ideas. This is a two stage process. The stages in this process are sales, operating expenses, operating income, net income.
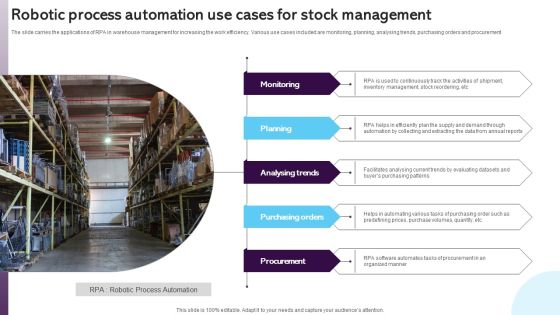
Robotic Process Automation Use Cases For Stock Management Themes PDF
The slide carries the applications of RPA in warehouse management for increasing the work efficiency. Various use cases included are monitoring, planning, analysing trends, purchasing orders and procurement. Showcasing this set of slides titled Robotic Process Automation Use Cases For Stock Management Themes PDF. The topics addressed in these templates are Monitoring, Planning, Analysing Trends. All the content presented in this PPT design is completely editable. Download it and make adjustments in color, background, font etc. as per your unique business setting.

P And L Kpis Tabular Form Ppt PowerPoint Presentation Outline Aids
This is a p and l kpis tabular form ppt powerpoint presentation outline aids. This is a four stage process. The stages in this process are net sales, other income, total income, expenses, taxes.

Competitive Intelligence Dashboard Diagram Ppt Slides
This is a competitive intelligence dashboard diagram ppt slides. This is a four stage process. The stages in this process are monthly sales, inventory turns, customer complaints, company, subject area.

Bi Dashboard Design For Solutions Ppt Powerpoint Slides
This is a bi dashboard design for solutions ppt powerpoint slides. This is a four stage process. The stages in this process are total understand, total brands, total revenue, total sales.

Dashboard Design And Development For Travel Diagram Background
This is a dashboard design and development for travel diagram background. This is a five stage process. The stages in this process are number of trips, sales, delayed flights, regional load, flight expense.

Business Marketing Objectives With Customer Expectation Analysis Ppt PowerPoint Presentation Outline Display PDF
Persuade your audience using this business marketing objectives with customer expectation analysis ppt powerpoint presentation outline display pdf. This PPT design covers three stages, thus making it a great tool to use. It also caters to a variety of topics including objective, mapping custer buying journey, customer expectation analysis based on market trends, customer expectation analysis based on market trends. Download this PPT design now to present a convincing pitch that not only emphasizes the topic but also showcases your presentation skills.
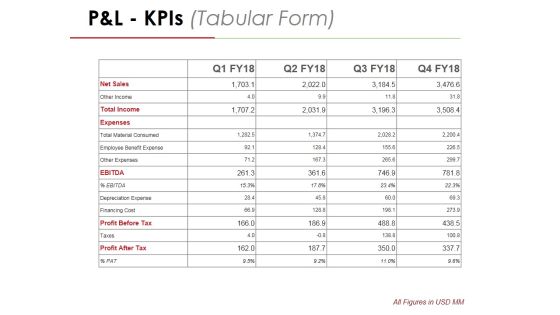
P And L Kpis Template 2 Ppt PowerPoint Presentation Professional Graphics
This is a p and l kpis template 2 ppt powerpoint presentation professional graphics. This is a four stage process. The stages in this process are net sales, other income, total income, expenses, total material consumed.

Customer In Store Purchase Experience Essential Retail Store Activities Tracking Dashboard Background PDF
This slide provides details regarding the dashboard for tracking retail store activities in terms of sales, conversion rate, traffic, average transaction value, recommendations, etc. Deliver and pitch your topic in the best possible manner with this Customer In Store Purchase Experience Essential Retail Store Activities Tracking Dashboard Background PDF. Use them to share invaluable insights on Sales, Traffic Out, Conversion Rate and impress your audience. This template can be altered and modified as per your expectations. So, grab it now.
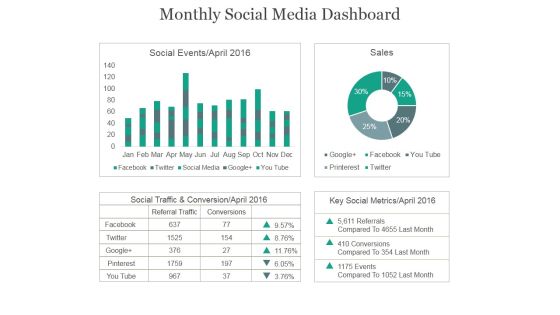
Monthly Social Media Dashboard Ppt PowerPoint Presentation Example 2015
This is a monthly social media dashboard ppt powerpoint presentation example 2015. This is a four stage process. The stages in this process are social events, sales, social traffic, conservation, key social metrics.
P And L Kpis Template 1 Ppt PowerPoint Presentation Icon Graphics Download
This is a p and l kpis template 1 ppt powerpoint presentation icon graphics download. This is a four stage process. The stages in this process are net sales, total income, expenses, financing cost, profit after tax.

Financial Highlights Template 1 Ppt PowerPoint Presentation Slides
This is a financial highlights template 1 ppt powerpoint presentation slides. This is a two stage process. The stages in this process are sales, operating expenses, operating income, net income.
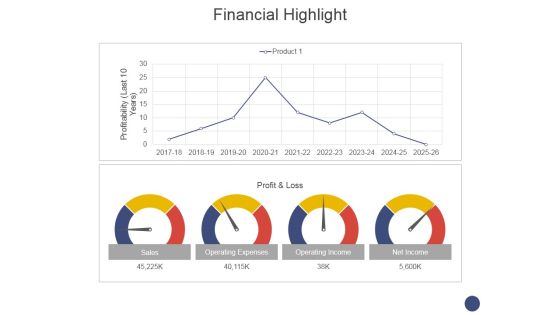
Financial Highlight Template 1 Ppt PowerPoint Presentation Model Deck
This is a financial highlight template 1 ppt powerpoint presentation model deck. This is a two stage process. The stages in this process are sales, operating expenses, operating income, net income.

Hr Dashboard Template Ppt PowerPoint Presentation Deck
This is a hr dashboard template ppt powerpoint presentation deck. This is a four stage process. The stages in this process are turnover rate, headcount flow, headcount, staffing trends.

Hr Dashboard Template 2 Ppt PowerPoint Presentation Layouts Graphics
This is a hr dashboard template 2 ppt powerpoint presentation layouts graphics. This is a four stage process. The stages in this process are turnover rate, headcount flow, headcount, staffing trends.
Website Performance Review Template 2 Ppt PowerPoint Presentation Icon Design Ideas
This is a website performance review template 2 ppt powerpoint presentation icon design ideas. This is a four stage process. The stages in this process are column two, revenue trends, traffic sources.

Balance Sheet Kpis Tabular Form Template 2 Ppt PowerPoint Presentation Summary Structure
This is a balance sheet kpis tabular form template 2 ppt powerpoint presentation summary structure. This is a four stage process. The stages in this process are net sales, expenses, ebitda, profit after tax, finecing cost.

Human Resource At A Glance Powerpoint Slide Graphics
This is a human resource at a glance powerpoint slide graphics. This is a two stage process. The stages in this process are executive, finance, human, human resource, marketing, operation, sales.
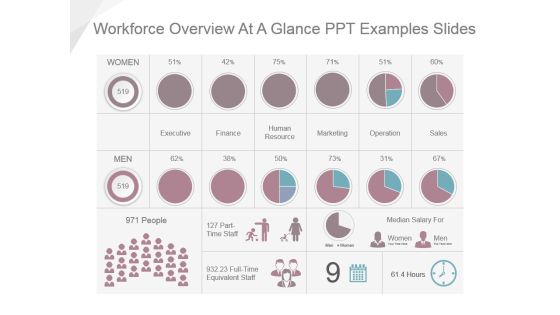
Workforce Overview At A Glance Ppt Examples Slides
This is a workforce overview at a glance ppt examples slides. This is a seven stage process. The stages in this process are executive, finance, human resource, marketing, operation, sales, median salary for.

Content Marketing Performance Evaluation Ppt PowerPoint Presentation Influencers
This is a content marketing performance evaluation ppt powerpoint presentation influencers. This is a eight stage process. The stages in this process are brand awareness, engagement, sales, lead generation, customer retention, lead nurturing.
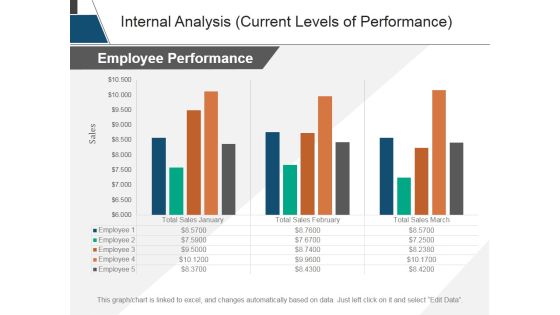
Internal Analysis Current Levels Of Performance Ppt PowerPoint Presentation Tips
This is a internal analysis current levels of performance ppt powerpoint presentation tips. This is a three stage process. The stages in this process are sales, employee performance, years, business, marketing.
Experiential Retail Plan Tracking Essential Retail Store Activities Dashboard Critical Summary PDF
This slide provides details regarding the dashboard for tracking retail store activities in terms of sales, conversion rate, traffic, average transaction value, etc. Deliver an awe inspiring pitch with this creative experiential retail plan tracking essential retail store activities dashboard critical summary pdf bundle. Topics like sales, traffic out, conversion rate, avg transaction value can be discussed with this completely editable template. It is available for immediate download depending on the needs and requirements of the user.
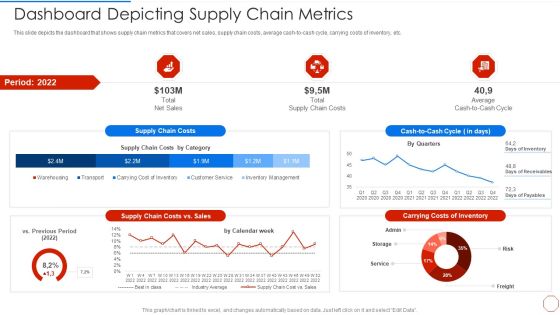
Minimizing Operational Cost Through Iot Virtual Twins Implementation Dashboard Depicting Supply Download PDF
This slide depicts the dashboard that shows supply chain metrics that covers net sales, supply chain costs, average cash to cash cycle, carrying costs of inventory, etc. Deliver an awe inspiring pitch with this creative minimizing operational cost through iot virtual twins implementation dashboard depicting supply download pdf bundle. Topics like sales, costs, supply, average can be discussed with this completely editable template. It is available for immediate download depending on the needs and requirements of the user.

Content Marketing Performance Template 1 Ppt PowerPoint Presentation Infographics Graphics Example
This is a content marketing performance template 1 ppt powerpoint presentation infographics graphics example. This is a eight stage process. The stages in this process are brand awareness, engagement, sales, lead generation, customer retention lead nurturing, upsell.

Customer Relationship Management In Freehold Property Financial Summary Of The Company Brochure PDF
Presenting this set of slides with name customer relationship management in freehold property financial summary of the company brochure pdf. The topics discussed in these slides are revenue trend, operating and net income trend, revenue geographical segment 2020, operating income, net income, product revenue, service revenue. This is a completely editable PowerPoint presentation and is available for immediate download. Download now and impress your audience.

Kpi Dashboard Ppt Powerpoint Slide Design Templates
This is a kpi dashboard ppt powerpoint slide design templates. This is a four stage process. The stages in this process are sales, new customer, budget, resource and task.
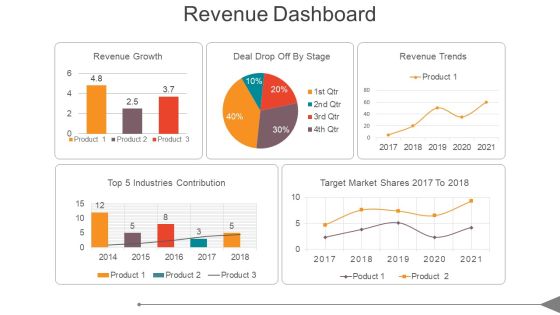
Revenue Dashboard Ppt PowerPoint Presentation Show
This is a revenue dashboard ppt powerpoint presentation show. This is a five stage process. The stages in this process are top 5 industries contribution, revenue growth, deal drop off by stage, revenue trends, target market shares 2017 to 2018.

Roi Calculation Chart Ppt Templates
This is a roi calculation chart ppt templates. This is a six stage process. The stages in this process are sales, capital, investment, interest calculation, return, success, return on investment.

Content Marketing Performance Ppt PowerPoint Presentation Outline
This is a content marketing performance ppt powerpoint presentation outline. This is a six stage process. The stages in this process are brand awareness, engagement, sales, lead generation, customer retention.

Market Overview Fitness Industry Products And Services Segmentations Rules PDF
In this slide we are covering gym, health and fitness clubs product and services segments such as membership fees, personal training services, guest admission sales, merchandise sales, spa services and many more. Deliver an awe-inspiring pitch with this creative market overview fitness industry products and services segmentations rules pdf bundle. Topics like merchandise sales, membership fees, personal trainers, guest admissions, meals and beverages can be discussed with this completely editable template. It is available for immediate download depending on the needs and requirements of the user.

P And L Statement To Analyze Net Profits Mockup PDF
The following slide depicts P and L statement to assess net profits. It provides information about cost of sales, gross margin, payroll, sales, marketing, depreciation, rent, payroll, interest, taxes, net sales, etc. Find a pre designed and impeccable P And L Statement To Analyze Net Profits Mockup PDF. The templates can ace your presentation without additional effort. You can download these easy to edit presentation templates to make your presentation stand out from others. So, what are you waiting for Download the template from Slidegeeks today and give a unique touch to your presentation.

Business Workflow Chart Ppt Presentation Visuals
This is a business workflow chart ppt presentation visuals. This is a one stage process. The stages in this process are purchasing, receiving, manufacturing, quality assurance, inventory, packaging, sales, distribution, shipping, customer service.

Conversion Funnel Optimization Chart Powerpoint Idea
This is a conversion funnel optimization chart powerpoint idea. This is a seven stage process. The stages in this process are viewers, question, website visitors, sales, interest, purchase, qualified inquiries.

Customer Loyalty Program Performance Ppt Sample
This is a customer loyalty program performance ppt sample. This is a four stage process. The stages in this process are enrollments icon, reward outstanding, loyalty, loyalty revenue, gift sales.

Investor Deck For Capital Generation From Substitute Funding Options Financial Summary Of The Company Mockup PDF
Presenting this set of slides with name investor deck for capital generation from substitute funding options financial summary of the company mockup pdf. The topics discussed in these slides are revenue by product and services 2020, revenue by geographical segment 2020, revenue trend, operating and net income trend. This is a completely editable PowerPoint presentation and is available for immediate download. Download now and impress your audience.

Management Information System Chart Powerpoint Slide Download
This is a management information system chart powerpoint slide download. This is a six stage process. The stages in this process are technology, generate order, check credit, people, ship product, sales.
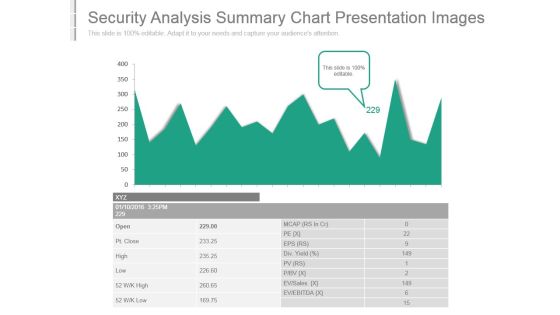
Security Analysis Summary Chart Presentation Images
This is a security analysis summary chart presentation images. This is a one stage process. The stages in this process are ev ebitda, ev sales, div yield, open, pt close, high, low, mcap, eps.

Scatter Chart Ppt PowerPoint Presentation Summary Visuals
This is a scatter chart ppt powerpoint presentation summary visuals. This is a eight stage process. The stages in this process are product, profit in sales, in percentage, finance, business.

Monthly Social Media Dashboard Ppt PowerPoint Presentation Model Slide
This is a monthly social media dashboard ppt powerpoint presentation model slide. This is a four stage process. The stages in this process are sales, social events, business, finance, key social metrics.

Content Marketing Performance Template Ppt PowerPoint Presentation Outline Master Slide
This is a content marketing performance template ppt powerpoint presentation outline master slide. This is a eight stage process. The stages in this process are brand awareness, engagement, sales, lead generation, customer retention loyalty.

Content Marketing Performance Template 2 Ppt PowerPoint Presentation Outline Brochure
This is a content marketing performance template 2 ppt powerpoint presentation outline brochure. This is a eight stage process. The stages in this process are brand awareness, engagement, sales, lead generation, customer retention.
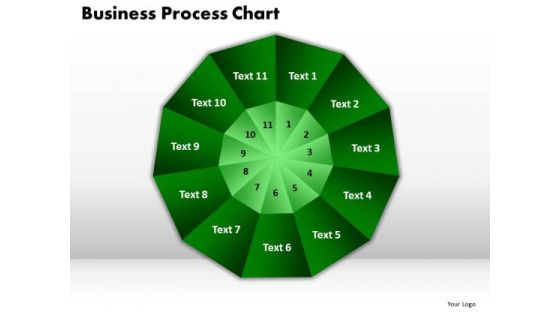
PowerPoint Templates Business Process Chart Success Ppt Themes
PowerPoint Templates Business Process Chart Success PPT Themes-This PowerPoint Diagram will let you express the views about capital and labor, commercialism, market, merchandising, production and distribution, racket, sales, selling, trading, traffic, transaction, undertaking.-PowerPoint Templates Business Process Chart Success PPT Themes
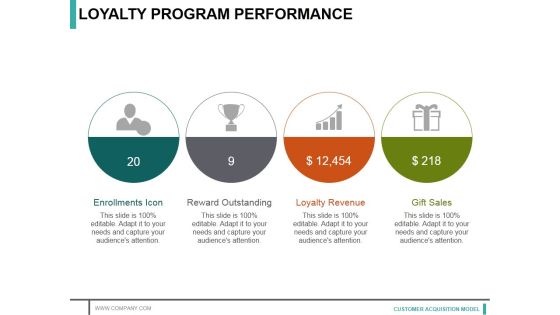
Loyalty Program Performance Ppt PowerPoint Presentation Styles Example
This is a loyalty program performance ppt powerpoint presentation styles example. This is a four stage process. The stages in this process are enrollments icon, reward outstanding, loyalty revenue, gift sales.

Line Bubble Chart Ppt PowerPoint Presentation Portfolio Slide Portrait
This is a line bubble chart ppt powerpoint presentation portfolio slide portrait. This is a six stage process. The stages in this process are highest profit, financial year, profit in sales, growth, business.
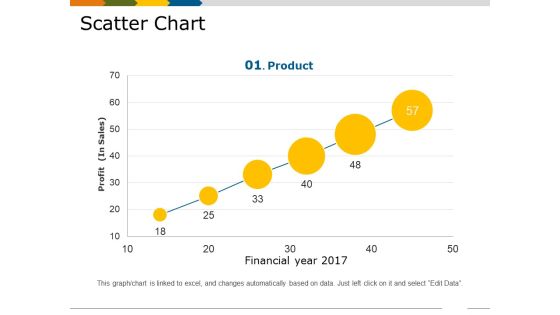
Scatter Chart Template 1 Ppt PowerPoint Presentation Show Slides
This is a scatter chart template 1 ppt powerpoint presentation show slides. This is a six stage process. The stages in this process are financial year, profit in sales, growth, business, marketing, product.
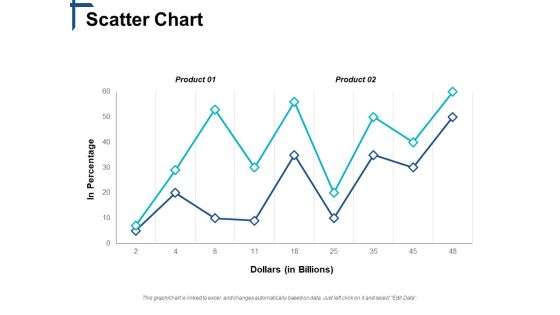
Scatter Chart Competitive Differentiation Ppt PowerPoint Presentation Show Slides
This is a scatter chart competitive differentiation ppt powerpoint presentation show slides. This is a two stage process. The stages in this process are business, management, marketing, strategy, sales.

PowerPoint Theme Ring Chart Diagram Growth Ppt Template
PowerPoint Theme Ring Chart Diagram Growth PPT Template-Use this graphical approach to represent global business issues such as financial data, stock market Exchange, increase in sales, corporate presentations and more.-PowerPoint Theme Ring Chart Diagram Growth PPT Template
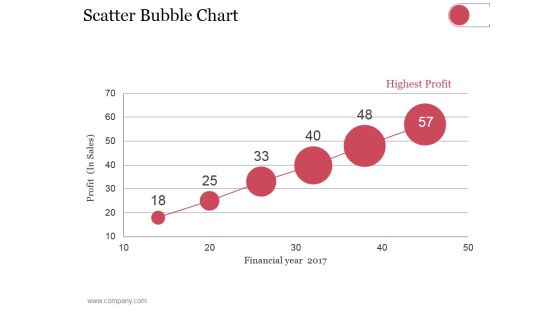
Scatter Bubble Chart Ppt PowerPoint Presentation Summary Pictures
This is a scatter bubble chart ppt powerpoint presentation summary pictures. This is a six stage process. The stages in this process are highest profit, financial year, profit in sales.
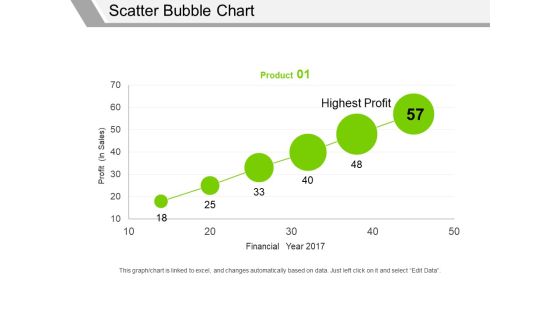
Scatter Bubble Chart Ppt PowerPoint Presentation Professional Graphics Pictures
This is a scatter bubble chart ppt powerpoint presentation professional graphics pictures. This is a one stage process. The stages in this process are profit in sales, financial year, highest profit, product.
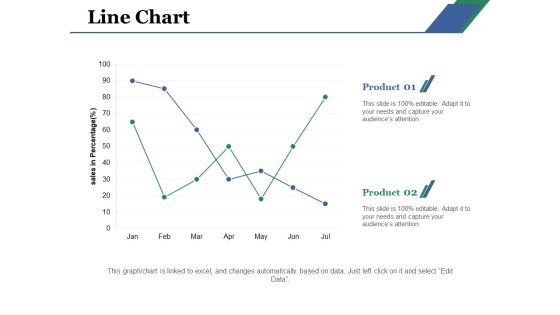
Line Chart Ppt PowerPoint Presentation Layouts Example File
This is a line chart ppt powerpoint presentation layouts example file. This is a two stage process. The stages in this process are line chart, product, business, sales, analysis.

Content Marketing Performance Template Ppt PowerPoint Presentation Gallery Backgrounds
This is a content marketing performance template ppt powerpoint presentation gallery backgrounds. This is a eight stage process. The stages in this process are brand awareness, engagement, sales, lead generation, customer retention loyalty.

Advancement Of Retail Store In Future Tracking Essential Retail Store Activities Infographics PDF
This slide provides details regarding the dashboard for tracking retail store activities in terms of sales, conversion rate, traffic, average transaction value, etc. Deliver and pitch your topic in the best possible manner with this advancement of retail store in future tracking essential retail store activities infographics pdf. Use them to share invaluable insights on sales, traffic out, conversion rate, avg transaction value and impress your audience. This template can be altered and modified as per your expectations. So, grab it now.

Augmented Analytics Implementation IT Data Visualization With Augmented Analytics Microsoft PDF
This slide represents the data visualization with an augmented analytics dashboard covering sales, spending per customer, gross profit, unique customers, unique purchase, and gross profit. Deliver an awe inspiring pitch with this creative Augmented Analytics Implementation IT Data Visualization With Augmented Analytics Microsoft PDF bundle. Topics like Category Contribution, Category Year To Year Growth, Top Products, Sales, Gross Profit can be discussed with this completely editable template. It is available for immediate download depending on the needs and requirements of the user.
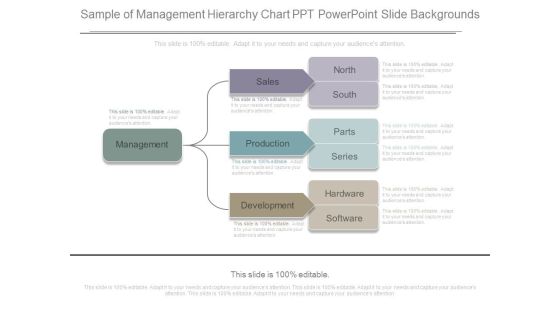
Sample Of Management Hierarchy Chart Ppt Powerpoint Slide Backgrounds
This is a sample of management hierarchy chart ppt powerpoint slide backgrounds. This is a one stage process. The stages in this process are management, sales, production, development, north, south, parts, series, hardware, software.

Small Business Structure Chart Example Powerpoint Slide Background Image
This is a small business structure chart example powerpoint slide background image. This is a six stage process. The stages in this process are financial manager, sales, distributions, finance, operations, general manager.

Hiring Plan Bar Chart Powerpoint Slide Background Image
This is a hiring plan bar chart powerpoint slide background image. This is a five stage process. The stages in this process are engineering, sales, marketing, product, support, finance.

Combo Chart Ppt PowerPoint Presentation Ideas Visual Aids
This is a combo chart ppt powerpoint presentation ideas visual aids. This is a three stage process. The stages in this process are product, sales, bar graph, business, marketing.

Customer Relationship Management Process And Dashboard PPT PowerPoint Presentation Complete Deck With Slides
This is a customer relationship management process and dashboard ppt powerpoint presentation complete deck with slides. This is a one stage process. The stages in this process are sales, service, strategy, revenue, customer service.
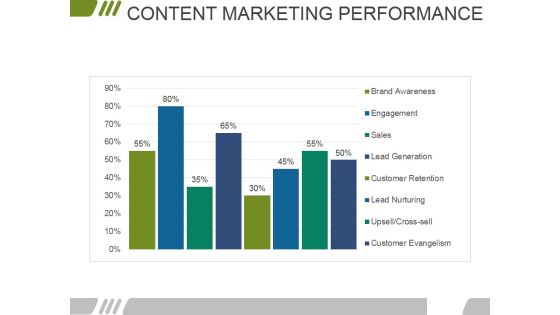
Content Marketing Performance Template 1 Ppt PowerPoint Presentation Slides Design Ideas
This is a content marketing performance template 1 ppt powerpoint presentation slides design ideas. This is a eight stage process. The stages in this process are brand awareness, engagement, sales, lead generation, customer retention, lead nurturing, upsell, customer evangelism.
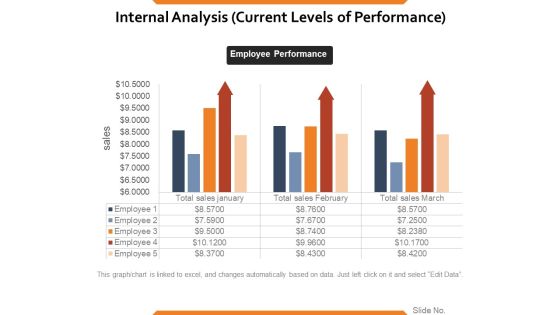
Internal Analysis Current Levels Of Performance Ppt PowerPoint Presentation Ideas Vector
This is a internal analysis current levels of performance ppt powerpoint presentation ideas vector. This is a three stage process. The stages in this process are sales, employee performance, business, finance, marketing.

Volume Open High Low Close Chart Ppt PowerPoint Presentation Model Inspiration
This is a volume open high low close chart ppt powerpoint presentation model inspiration. This is a three stage process. The stages in this process are business, management, strategy, marketing, sales.
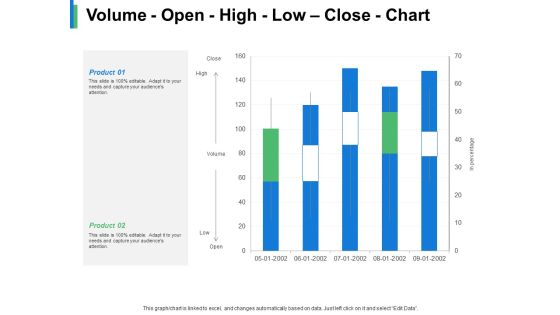
Volume Open High Low Close Chart Product Ppt PowerPoint Presentation Gallery Example
This is a volume open high low close chart product ppt powerpoint presentation gallery example. This is a two stage process. The stages in this process are business, management, strategy, marketing, sales.

Quarterly Roadmap For SBU Management Ppt PowerPoint Presentation Portfolio Grid PDF
The following slide illustrates strategic roadmap to achieve the business goals and objectives timely. It also includes milestones, key dates and different functional activities such as sales, product and marketing.Showcasing this set of slides titled Quarterly Roadmap For SBU Management Ppt PowerPoint Presentation Portfolio Grid PDF. The topics addressed in these templates are Determine Sales, Connections Distributors, Introduce Sales. All the content presented in this PPT design is completely editable. Download it and make adjustments in color, background, font etc. as per your unique business setting.

Label Identity Design Brand Performance Dashboard Ppt File Rules PDF
Deliver an awe-inspiring pitch with this creative label identity design brand performance dashboard ppt file rules pdf bundle. Topics like customer recognition, enhanced sales, competitive edge can be discussed with this completely editable template. It is available for immediate download depending on the needs and requirements of the user.

Customer Manager Timeline Powerpoint Slides
This is a customer manager timeline powerpoint slides. This is a six stage process. The stages in this process are inventory management, products sales, product inventory, suppliers manager, products purchase, customer manager.
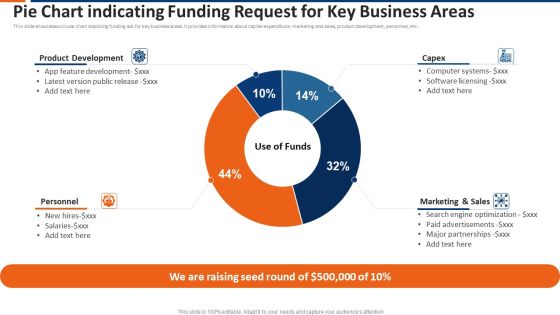
Pie Chart Indicating Funding Request For Key Business Areas Ppt Show Topics PDF
This slide showcases circular chart depicting funding ask for key business areas. It provides information about capital expenditure, marketing and sales, product development, personnel, etc. Pitch your topic with ease and precision using this pie chart indicating funding request for key business areas ppt show topics pdf. This layout presents information on product development, capex, marketing and sales, personnel. It is also available for immediate download and adjustment. So, changes can be made in the color, design, graphics or any other component to create a unique layout.

Developing And Implementing Corporate Partner Action Plan Measure Partner Performance Download PDF
Deliver and pitch your topic in the best possible manner with this developing and implementing corporate partner action plan measure partner performance download pdf. Use them to share invaluable insights on target, business, plan, sales, performance and impress your audience. This template can be altered and modified as per your expectations. So, grab it now.

Youtube Advertising Techniques Impacts Of Youtube Marketing On Business Performance Download PDF
This slide highlights the Business prospective development with YouTube Marketing which includes the sales, product demand, customer engagement audience reach and conversion rate. Deliver an awe inspiring pitch with this creative Youtube Advertising Techniques Impacts Of Youtube Marketing On Business Performance Download PDF bundle. Topics like Overall Sales, Product Demand, Customer Engagement can be discussed with this completely editable template. It is available for immediate download depending on the needs and requirements of the user.

Department Wise Monthly Internal Corporate Audit Schedule Plan Chart Elements PDF
This slide covers audit schedule report for different departments. It includes audit frequency for sales, management, technical, planning, logistics, etc. departments. Showcasing this set of slides titled Department Wise Monthly Internal Corporate Audit Schedule Plan Chart Elements PDF. The topics addressed in these templates are Technical, Management, Sales. All the content presented in this PPT design is completely editable. Download it and make adjustments in color, background, font etc. as per your unique business setting.

Business Framework Key Metrics Required For Different Company Situations PowerPoint Presentation
This diagram has been designed with framework of key metrics required for different company situations. This diagram contains rectangle of operating value drivers with four sections inside it representing terms like growth of net Income, multiyear DCF of economic profit, net income, return on sales, ROIC-WACC, and economic profit. Use this as a major element in streamlining any business process.

Business Administration Diagram Powerpoint Slide Show
This is a business administration diagram powerpoint slide show. This is a three stage process. The stages in this process are finance and accounts, human resources, customer services, production operations, research and development, marketing sales, administration, technology, accounting.
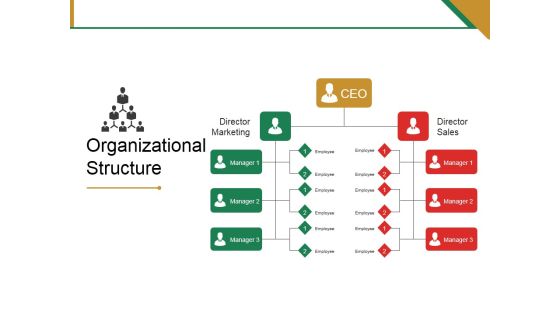
Organizational Structure Ppt PowerPoint Presentation Model Objects
This is a organizational structure ppt powerpoint presentation model objects. This is a three stage process. The stages in this process are ceo, director marketing, director sales, manager, employee.

Department Information Ppt PowerPoint Presentation File Background Designs
This is a department information ppt powerpoint presentation file background designs. This is a three stage process. The stages in this process are ceo, director marketing, director sales, manager.
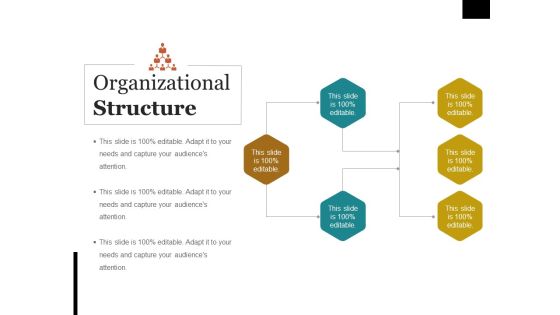
Organizational Structure Ppt PowerPoint Presentation Summary Brochure
This is a organizational structure ppt powerpoint presentation summary brochure. This is a three stage process. The stages in this process are director marketing, director sales, manager, employee, ceo.

Assessment Of Amazon Brand Performance KPI Dashboard To Track Amazon Elements PDF
This slide provides information regarding dashboard to monitor Amazon performance. The KPIs include tracking of product sales, conversion rate, advertising spends, session, organic sales, etc. Slidegeeks is one of the best resources for PowerPoint templates. You can download easily and regulate Assessment Of Amazon Brand Performance KPI Dashboard To Track Amazon Elements PDF for your personal presentations from our wonderful collection. A few clicks is all it takes to discover and get the most relevant and appropriate templates. Use our Templates to add a unique zing and appeal to your presentation and meetings. All the slides are easy to edit and you can use them even for advertisement purposes.

Competitor Assessment To Determine Companys Share Introduction To Competitor Analysis To Identify Market Gaps Slides PDF
This slide covers competitor evaluation for researching major competitors to gain insight into their products, sales, and marketing tactics. It also includes the benefits of conducting competitor analysis, such as identifying gaps in the market, discovering market trends, developing new products and services, etc. Retrieve professionally designed Competitor Assessment To Determine Companys Share Introduction To Competitor Analysis To Identify Market Gaps Slides PDF to effectively convey your message and captivate your listeners. Save time by selecting pre made slideshows that are appropriate for various topics, from business to educational purposes. These themes come in many different styles, from creative to corporate, and all of them are easily adjustable and can be edited quickly. Access them as PowerPoint templates or as Google Slides themes. You donot have to go on a hunt for the perfect presentation because Slidegeeks got you covered from everywhere.

Activity Ratios Template 3 Ppt PowerPoint Presentation Professional Example
This is a activity ratios template 3 ppt powerpoint presentation professional example. This is a two stage process. The stages in this process are total asset turnover, net sales, fixed assets turnover, fixed assets.

Activity Ratios Template Ppt PowerPoint Presentation Summary Slides
This is a activity ratios template ppt powerpoint presentation summary slides. This is a two stage process. The stages in this process are total asset turnover, net sales, fixed assets turnover, fixed assets.

Activity Ratios Ppt PowerPoint Presentation Icon Themes
This is a activity ratios ppt powerpoint presentation icon themes. This is a two stage process. The stages in this process are inventory turnover, cogs, average inventory, receivable turnover, net credit sales, average accounts receivable .

Activity Ratios Ppt PowerPoint Presentation Gallery Microsoft
This is a activity ratios ppt powerpoint presentation gallery microsoft. This is a two stage process. The stages in this process are inventory turnover, receivables turnover, net credit sales, average accounts receivable.
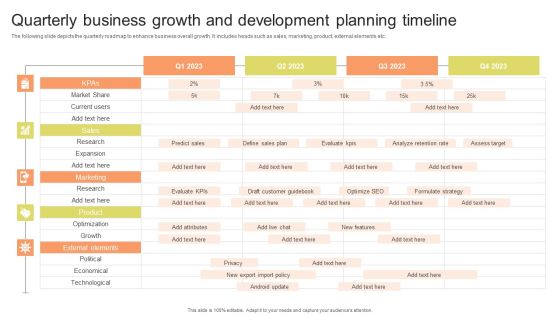
Quarterly Business Growth And Development Planning Timeline Background PDF
The following slide depicts the quarterly roadmap to enhance business overall growth. It includes heads such as sales, marketing, product, external elements etc. Pitch your topic with ease and precision using this Quarterly Business Growth And Development Planning Timeline Background PDF. This layout presents information on Predict Sales, Assess Target, Formulate Strategy. It is also available for immediate download and adjustment. So, changes can be made in the color, design, graphics or any other component to create a unique layout.

Web Based Crm For Small Business Ppt Slides Styles
This is a web based crm for small business ppt slides styles. This is a ten stage process. The stages in this process are sales, support, marketing, collections, reports, inventory, security, work flow, customize, email sms.
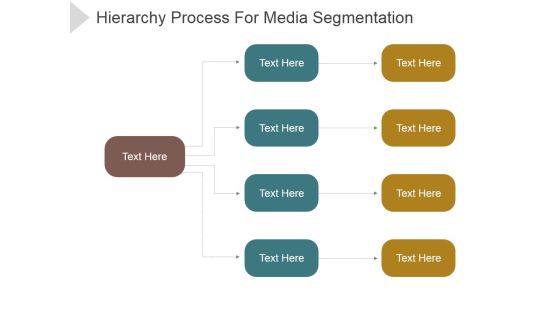
Hierarchy Process For Media Segmentation Ppt PowerPoint Presentation Guidelines
This is a hierarchy process for media segmentation ppt powerpoint presentation guidelines. This is a three stage process. The stages in this process are business, marketing, management, process, sales.

Department Information Ppt PowerPoint Presentation Icon Skills
This is a department information ppt powerpoint presentation icon skills. This is a four stage process. The stages in this process are ceo, director marketing, director sales, manager, employee.
Growth Strategy Ppt PowerPoint Presentation Layouts Icon
This is a growth strategy ppt powerpoint presentation layouts icon. This is a three stage process. The stages in this process are marketing and sales, customer service, product development.

Activity Ratios Template 4 Ppt PowerPoint Presentation Styles Slideshow
This is a activity ratios template 4 ppt powerpoint presentation styles slideshow. This is a two stage process. The stages in this process are total asset turnover, fixed assets turnover, net sales, year, net profit ratio, gross profit ratio.

Competitive Analysis And Benchmarking Ppt Ideas Graphic Images
Below slide provides graphical view of statistics related to competitive analysis of company. It covers total subscribers, net sales, net income, subscribers by region, marketing cost etc. Deliver and pitch your topic in the best possible manner with this competitive analysis and benchmarking ppt ideas graphic images. Use them to share invaluable insights on sales, income, marketing costs and impress your audience. This template can be altered and modified as per your expectations. So, grab it now.
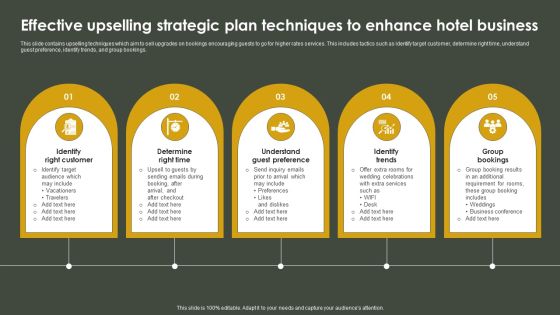
Effective Upselling Strategic Plan Techniques To Enhance Hotel Business Background PDF
This slide contains upselling techniques which aim to sell upgrades on bookings encouraging guests to go for higher rates services. This includes tactics such as identify target customer, determine right time, understand guest preference, identify trends, and group bookings. Presenting Effective Upselling Strategic Plan Techniques To Enhance Hotel Business Background PDF to dispense important information. This template comprises five stages. It also presents valuable insights into the topics including Guest Preference, Identify, Trends. This is a completely customizable PowerPoint theme that can be put to use immediately. So, download it and address the topic impactfully.

Bar Graph Ppt PowerPoint Presentation File Graphic Tips
This is a bar graph ppt powerpoint presentation file graphic tips. This is a two stage process. The stages in this process are bar graph, finance, marketing, strategy, sales, business.

Hierarchy Process For Corporate Management Team Ppt Slide
This is a hierarchy process for corporate management team ppt slide. This is a three stage process. The stages in this process are management, sales, production, development, north, south, parts, series, hardware, software.
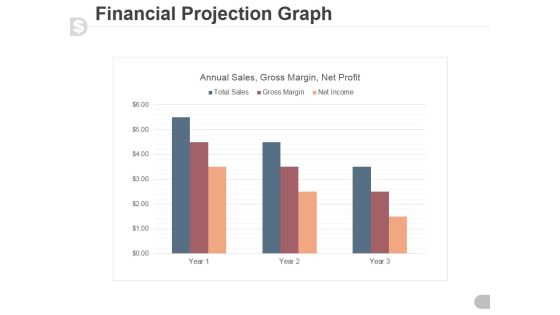
Financial Projection Graph Template 1 Ppt PowerPoint Presentation Guide
This is a financial projection graph template 1 ppt powerpoint presentation guide. This is a three stage process. The stages in this process are annual sales, gross margin, net profit.
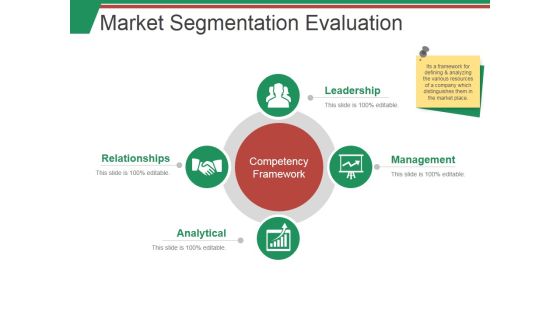
Market Segmentation Evaluation Template 1 Ppt PowerPoint Presentation Summary Smartart
This is a market segmentation evaluation template 1 ppt powerpoint presentation summary smartart. This is a two stage process. The stages in this process are market sales, net profit, beverages, milk product, nutrition.
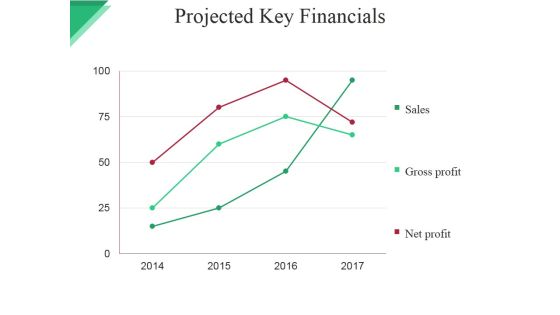
Projected Key Financials Template Ppt PowerPoint Presentation File Graphic Images
This is a projected key financials template ppt powerpoint presentation file graphic images. This is a four stage process. The stages in this process are sales, gross profit, net profit.

Projected Key Financials Template 1 Ppt PowerPoint Presentation Summary Professional
This is a projected key financials template 1 ppt powerpoint presentation summary professional. This is a three stage process. The stages in this process are in dollar, sales, gross profit, net profit, graph, year.
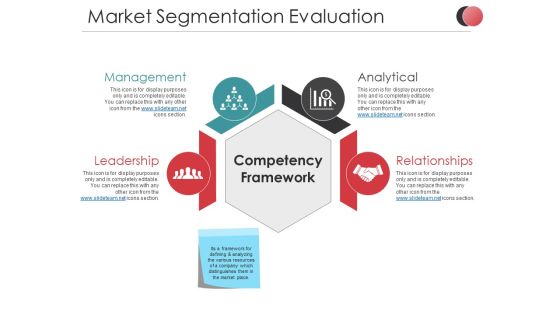
Market Segmentation Evaluation Ppt PowerPoint Presentation Summary Slideshow
This is a market segmentation evaluation ppt powerpoint presentation summary slideshow. This is a two stage process. The stages in this process are net profit, market sales, business, marketing, finance, icons.
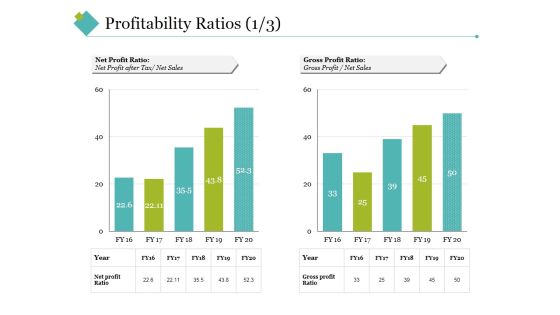
Profitability Ratios Template 2 Ppt PowerPoint Presentation Styles Example Topics
This is a profitability ratios template 2 ppt powerpoint presentation styles example topics. This is a two stage process. The stages in this process are net profit ratio, gross profit ratio, net sales, gross profit, year.
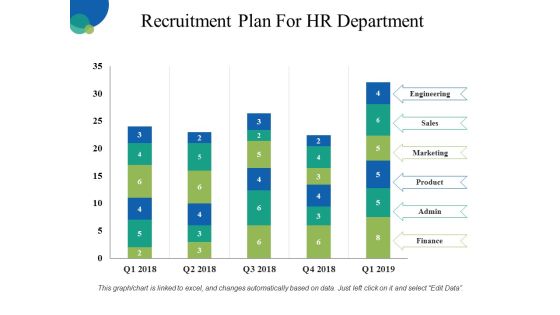
Recruitment Plan For HR Department Ppt PowerPoint Presentation Inspiration Layout Ideas
This is a recruitment plan for hr department ppt powerpoint presentation inspiration layout ideas. This is a five stage process. The stages in this process are engineering, sales, marketing, product, finance.

Recruitment Plan For Hr Department Ppt PowerPoint Presentation Show
This is a recruitment plan for hr department ppt powerpoint presentation show. This is a five stage process. The stages in this process are engineering, sales, marketing, product, finance.
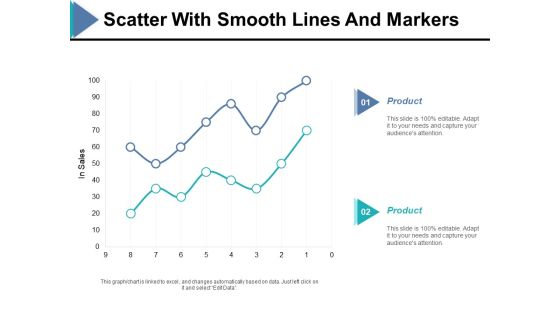
Scatter With Smooth Lines And Markers Ppt PowerPoint Presentation Ideas Example
This is a scatter with smooth lines and markers ppt powerpoint presentation ideas example. This is a two stage process. The stages in this process are in sales, finance, bar graph, product, business.
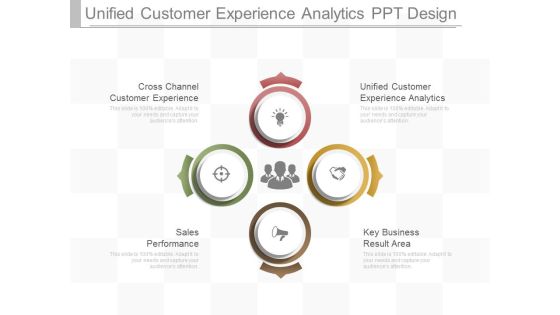
Unified Customer Experience Analytics Ppt Design
This is a unified customer experience analytics ppt design. This is a four stage process. The stages in this process are cross channel customer experience, unified customer experience analytics, sales, performance, key business result area.

Example Of Optimized Investment Sample Diagram Powerpoint Graphics
This is a example of optimized investment sample diagram powerpoint graphics. This is a eight stage process. The stages in this process are customer, performance, profit, capital protection, leverage, yield enhancement, sales, brand growth.

Business Interrelationship Graphic Design Powerpoint Presentation Examples
This is a business interrelationship graphic design powerpoint presentation examples. This is a six stage process. The stages in this process are data integration, performance management, sales, accounting, assemble product, decision support systems.
