Sales Review
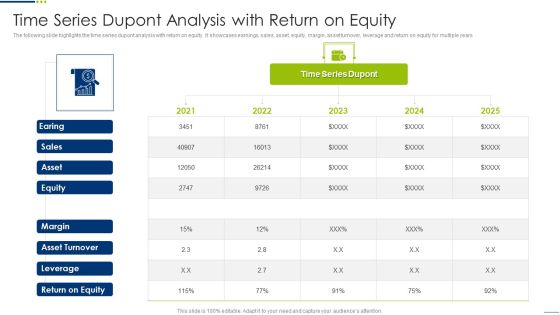
Time Series Dupont Analysis With Return On Equity Template PDF
The following slide highlights the time series dupont analysis with return on equity. It showcases earnings, sales, asset, equity, margin, asset turnover, leverage and return on equity for multiple years. Showcasing this set of slides titled Time Series Dupont Analysis With Return On Equity Template PDF. The topics addressed in these templates are Margin, Equity, Sales. All the content presented in this PPT design is completely editable. Download it and make adjustments in color, background, font etc. as per your unique business setting.

Venn Business Marketing Planning Ppt PowerPoint Presentation Show Tips
This is a venn business marketing planning ppt powerpoint presentation show tips. This is a four stage process. The stages in this process are venn, marketing, sales, strategy, business.

Acquisition Strategy Plan Template 2 Ppt PowerPoint Presentation Model Design Ideas
This is a acquisition strategy plan template 2 ppt powerpoint presentation model design ideas. This is a four stage process. The stages in this process are driving traffic, conversion, nurturing, sales, business, icons.
Team Goals Template 2 Ppt PowerPoint Presentation Icon Inspiration
This is a team goals template 2 ppt powerpoint presentation icon inspiration. This is a four stage process. The stages in this process are engineering, product, marketing, sales, support, finance admin.
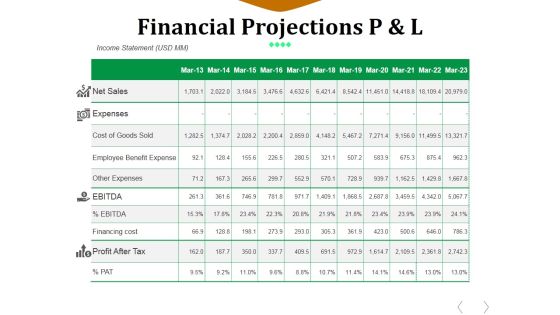
Financial Projections P And L Ppt PowerPoint Presentation File Professional
This is a financial projections p and l ppt powerpoint presentation file professional. This is a eleven stage process. The stages in this process are net sales, expenses, cost of goods sold, employee benefit expense, other expenses, financing cost.
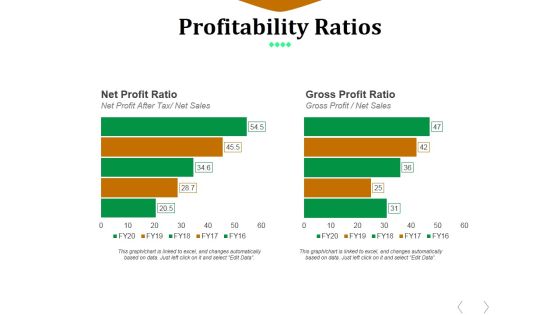
Profitability Ratios Template 2 Ppt PowerPoint Presentation Diagram Ppt
This is a profitability ratios template 2 ppt powerpoint presentation diagram ppt. This is a two stage process. The stages in this process are net profit ratio, gross profit ratio, net profit after tax, net sales.

Operations Plan Ppt PowerPoint Presentation Infographic Template Example 2015
This is a operations plan ppt powerpoint presentation infographic template example 2015. This is a six stage process. The stages in this process are key initiatives, prioritization, project lead, sales, marketing.
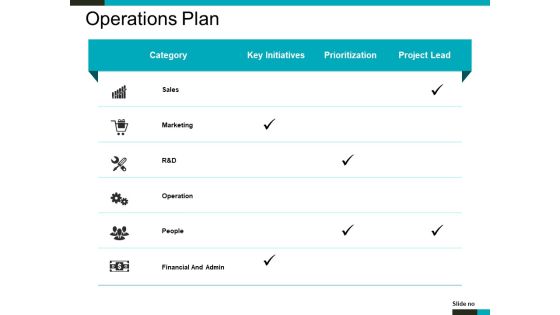
Operations Plan Ppt PowerPoint Presentation Summary Clipart Images
This is a operations plan ppt powerpoint presentation summary clipart images. This is a six stage process. The stages in this process are sales, marketing, operation, people, financial and admin.

Finance Dashboard Ppt PowerPoint Presentation Design Ideas
This is a finance dashboard ppt powerpoint presentation design ideas. This is a two stage process. The stages in this process are sales, operating expenses, operating income, net income.
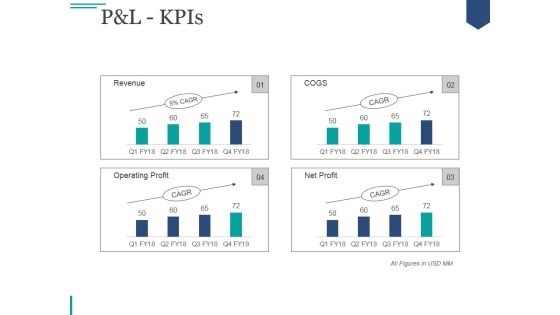
Pandl Kpis Ppt PowerPoint Presentation Deck
This is a pandl kpis ppt powerpoint presentation deck. This is a four stage process. The stages in this process are net sales, other income, total income, expenses, total material consumed.

Pandl Kpis Ppt PowerPoint Presentation Gallery Slides
This is a pandl kpis ppt powerpoint presentation gallery slides. This is a four stage process. The stages in this process are net sales, other income, total income, expenses, total material consumed.

Pandl Kpis Ppt PowerPoint Presentation Infographic Template Layout
This is a pandl kpis ppt powerpoint presentation infographic template layout. This is a four stage process. The stages in this process are net sales, other income, total income, expenses, total material consumed.

Acquisition Strategy Plan Template 1 Ppt PowerPoint Presentation Ideas Background Images
This is a acquisition strategy plan template 1 ppt powerpoint presentation ideas background images. This is a four stage process. The stages in this process are driving traffic, conversion, nurturing, sales, business, icons.

Business Plan For A Startup Business Ppt Ideas
This is a business plan for a startup business ppt ideas. This is a five stage process. The stages in this process are marketing, growth, communication, sales, partnership design.

Customer Distribution Requirement Plan Template Ppt Slide Styles
This is a customer distribution requirement plan template ppt slide styles. This is a five stage process. The stages in this process are operations, executive, services, sales, finance, business one.\n\n\n

Hiring Plan Bar Chart Powerpoint Slide Background Image
This is a hiring plan bar chart powerpoint slide background image. This is a five stage process. The stages in this process are engineering, sales, marketing, product, support, finance.

Hiring Plan Bar Graph With Categories Powerpoint Slide Graphics
This is a hiring plan bar graph with categories powerpoint slide graphics. This is a five stage process. The stages in this process are finance, support, product, marketing, sales, engineering.

Financials Base Plan Ppt Powerpoint Presentation Slides Design Inspiration
This is a financials base plan ppt powerpoint presentation slides design inspiration. This is a four stage process. The stages in this process are financial summary, revenue, cost of sales, gross profit.
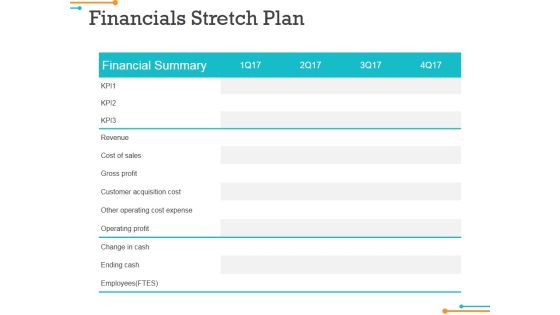
Financials Stretch Plan Ppt Powerpoint Presentation Infographics Background Image
This is a financials stretch plan ppt powerpoint presentation infographics background image. This is a four stage process. The stages in this process are financial summary, revenue, cost of sales, gross profit.

Recruitment Plan For Hr Department Ppt PowerPoint Presentation Show
This is a recruitment plan for hr department ppt powerpoint presentation show. This is a five stage process. The stages in this process are engineering, sales, marketing, product, finance.

Operational Plan Deciding Team Initiatives And Strategies Ppt PowerPoint Presentation Slides Graphics Example
This is a operational plan deciding team initiatives and strategies ppt powerpoint presentation slides graphics example. This is a four stage process. The stages in this process are key initiatives, category, sales, marketing, employee.

Pandl Kpis Ppt PowerPoint Presentation Gallery Display
This is a pandl kpis ppt powerpoint presentation gallery display. This is a four stage process. The stages in this process are net sales, total income, expenses, ebitda, profit after tax.

Financial Projection Graph Template 1 Ppt PowerPoint Presentation Clipart
This is a financial projection graph template 1 ppt powerpoint presentation clipart. This is a three stage process. The stages in this process are annual, sales, forecast, finance, marketing.
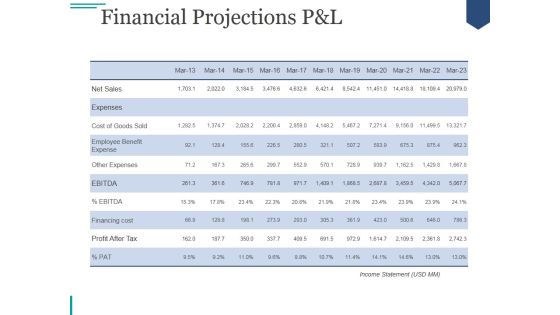
Financial Projections Pand L Ppt PowerPoint Presentation Template
This is a financial projections pand l ppt powerpoint presentation template. This is a eleven stage process. The stages in this process are net sales, expenses, cost of goods sold, employee benefit expense, other expenses, financing cost.

Activity Ratios Template 2 Ppt PowerPoint Presentation Summary Display
This is a activity ratios template 2 ppt powerpoint presentation summary display. This is a two stage process. The stages in this process are inventory turnover, receivable turnover, net credit sales, average accounts receivable.

Activity Ratios Template 3 Ppt PowerPoint Presentation Icon Demonstration
This is a activity ratios template 3 ppt powerpoint presentation icon demonstration. This is a two stage process. The stages in this process are total asset turnover, fixed assets turnover, net sales, fixed assets.

Activity Ratios Template 4 Ppt PowerPoint Presentation Pictures Example File
This is a activity ratios template 4 ppt powerpoint presentation pictures example file. This is a two stage process. The stages in this process are total asset turnover, fixed assets turnover, net sales, fixed assets.

About Us Ppt PowerPoint Presentation Outline Design Ideas
This is a about us ppt powerpoint presentation outline design ideas. This is a four stage process. The stages in this process are ceo and founder, director of sales, managing director, assistant.

Pandl Kpis Tabular Form Ppt PowerPoint Presentation Outline Background
This is a pandl kpis tabular form ppt powerpoint presentation outline background. This is a four stage process. The stages in this process are net sales, expenses, ebitda, profit before tax, profit after tax.

Financial Projections Pandl Ppt PowerPoint Presentation Outline Grid
This is a financial projections pandl ppt powerpoint presentation outline grid. This is a ten stage process. The stages in this process are net sales, expenses, cost of goods sold, other expenses, financing cost.
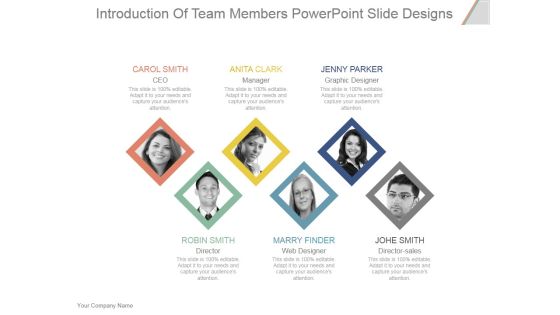
Introduction Of Team Members Ppt PowerPoint Presentation Show
This is a introduction of team members ppt powerpoint presentation show. This is a six stage process. The stages in this process are ceo, manager, graphic designer, director, web designer, director sales.

Competitors Analysis Framework Profit Ppt Infographics Graphics Tutorials PDF
The slide provides the competitors analysis related to company Financial Net sales, EBIT, Goodwill, Net Profit etc. and Product Specific Product, Primary Buyers etc. Deliver and pitch your topic in the best possible manner with this competitors analysis framework profit ppt infographics graphics tutorials pdf. Use them to share invaluable insights on net sales, net profit, company financial, product specific and impress your audience. This template can be altered and modified as per your expectations. So, grab it now.

Startup Company Competitors Analysis Framework Ppt Outline Files PDF
The slide provides the competitors analysis related to start-up company Financial Net sales, EBIT, Goodwill, Net Profit etc. and Product Specific Product, Primary Buyers etc. Deliver and pitch your topic in the best possible manner with this startup company competitors analysis framework ppt outline files pdf. Use them to share invaluable insights on net sales, net profit, product and impress your audience. This template can be altered and modified as per your expectations. So, grab it now.

Financial Waterfall Model Revenue Growth Analysis Professional PDF
The following slide showcases financial waterfall for revenue growth in electronics industry. It presents information related to percentage increase in sales, net sales, etc. Showcasing this set of slides titled Financial Waterfall Model Revenue Growth Analysis Professional PDF. The topics addressed in these templates are Financial, Revenue Growth, Analysis. All the content presented in this PPT design is completely editable. Download it and make adjustments in color, background, font etc. as per your unique business setting.
Short Term And Long Term Planning Icons Ppt PowerPoint Presentation Portfolio Icons
This is a short term and long term planning icons ppt powerpoint presentation portfolio icons. This is a two stage process. The stages in this process are business, management, strategy, marketing, sales.

Development In Past 10 Years Template 2 Ppt PowerPoint Presentation Professional Topics
This is a development in past 10 years template 2 ppt powerpoint presentation professional topics. This is a ten stage process. The stages in this process are net sales, other income, ebita, ebita margins, profit before tax, taxes.

Financial Projection Graph Template 1 Ppt PowerPoint Presentation Graphics
This is a financial projection graph template 1 ppt powerpoint presentation graphics. This is a three stage process. The stages in this process are annual sales, business, management, marketing, strategy.

Financial Projection Graph Template 2 Ppt PowerPoint Presentation Ideas
This is a financial projection graph template 2 ppt powerpoint presentation ideas. This is a nine stage process. The stages in this process are annual sales, business, management, marketing, strategy.

Enterprise Digital Transformation Value Addition From Transformation Ppt Pictures Ideas PDF
Presenting enterprise digital transformation value addition from transformation ppt pictures ideas pdf to provide visual cues and insights. Share and navigate important information on five stages that need your due attention. This template can be used to pitch topics like life in engagement, increase in sales, higher traffic, increased lead gen or sales, improved customer satisfaction. In addtion, this PPT design contains high resolution images, graphics, etc, that are easily editable and available for immediate download.
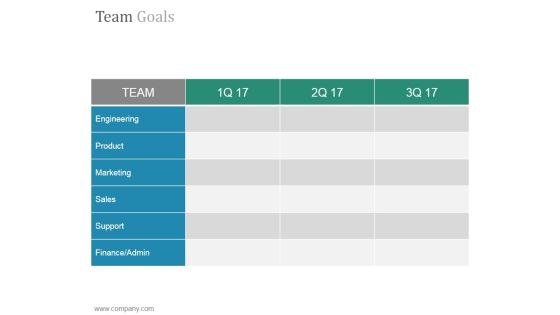
Team Goals Slide Ppt PowerPoint Presentation Tips
This is a team goals slide ppt powerpoint presentation tips. This is a six stage process. The stages in this process are engineering, product, marketing, sales, support, finance admin.
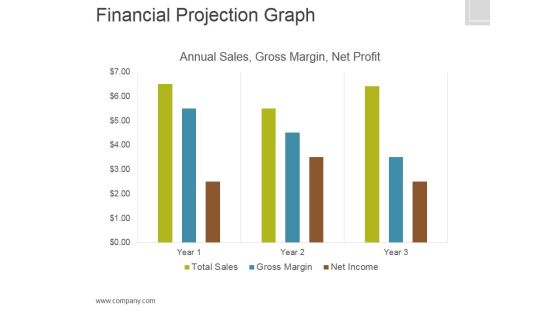
Financial Projection Graph Template 2 Ppt PowerPoint Presentation Graphics
This is a financial projection graph template 2 ppt powerpoint presentation graphics. This is a three stage process. The stages in this process are annual sales, gross margin, net profit, finance.
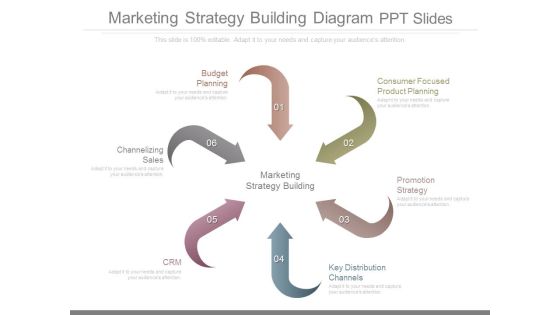
Marketing Strategy Building Diagram Ppt Slides
This is a marketing strategy building diagram ppt slides. This is a six stage process. The stages in this process are budget planning, consumer focused product planning, promotion strategy, key distribution channels, crm, channelizing sales.
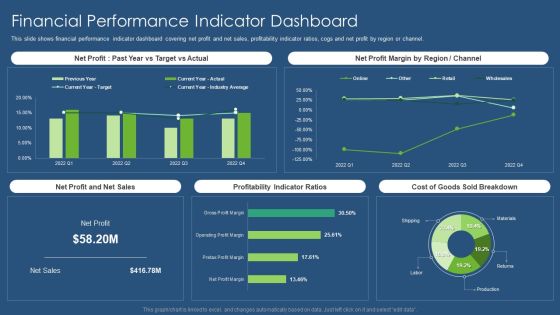
Sustainability Calculation With KPI Financial Performance Indicator Dashboard Infographics PDF Template PDF
This slide shows financial performance indicator dashboard covering net profit and net sales, profitability indicator ratios, cogs and net profit by region or channel. Deliver an awe inspiring pitch with this creative sustainability calculation with kpi financial performance indicator dashboard infographics pdf bundle. Topics like net profit margin, net profit and net sales, profitability indicator ratios, sold breakdown can be discussed with this completely editable template. It is available for immediate download depending on the needs and requirements of the user.

Decline Stage Ppt PowerPoint Presentation File Template
This is a decline stage ppt powerpoint presentation file template. This is a eight stage process. The stages in this process are costs, sales, profits, product, price, distribution, marketing objectives.

Youtube Advertising Techniques Impacts Of Youtube Marketing On Business Performance Download PDF
This slide highlights the Business prospective development with YouTube Marketing which includes the sales, product demand, customer engagement audience reach and conversion rate. Deliver an awe inspiring pitch with this creative Youtube Advertising Techniques Impacts Of Youtube Marketing On Business Performance Download PDF bundle. Topics like Overall Sales, Product Demand, Customer Engagement can be discussed with this completely editable template. It is available for immediate download depending on the needs and requirements of the user.
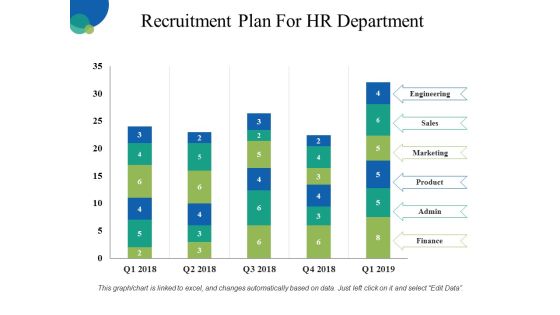
Recruitment Plan For HR Department Ppt PowerPoint Presentation Inspiration Layout Ideas
This is a recruitment plan for hr department ppt powerpoint presentation inspiration layout ideas. This is a five stage process. The stages in this process are engineering, sales, marketing, product, finance.
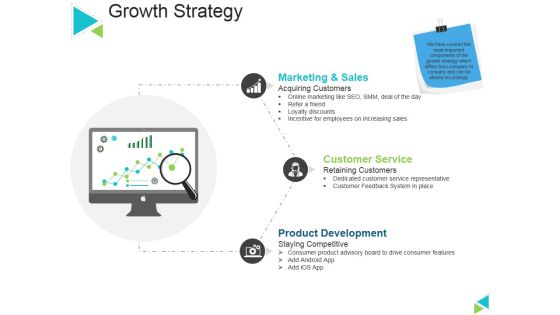
Growth Strategy Ppt PowerPoint Presentation Ideas Graphic Images
This is a growth strategy ppt powerpoint presentation ideas graphic images. This is a three stage process. The stages in this process are marketing and sales, customer service, product development, acquiring customers, staying competitive.

About Us Ppt PowerPoint Presentation Background Image
This is a about us ppt powerpoint presentation background image. This is a three stage process. The stages in this process are product manager, finance manager, director of sales.
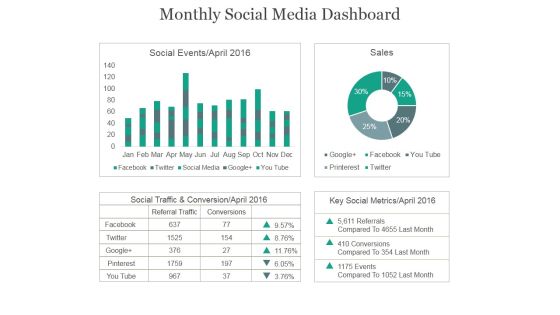
Monthly Social Media Dashboard Ppt PowerPoint Presentation Example 2015
This is a monthly social media dashboard ppt powerpoint presentation example 2015. This is a four stage process. The stages in this process are social events, sales, social traffic, conservation, key social metrics.
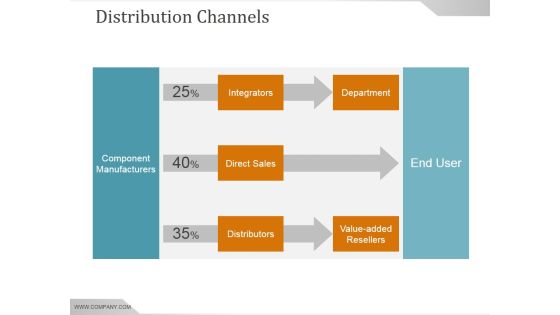
Distribution Channels Ppt PowerPoint Presentation Graphics
This is a distribution channels ppt powerpoint presentation graphics. This is a three stage process. The stages in this process are integrators, direct sales, distributors, value added, resellers, department, component manufacturers, end user.
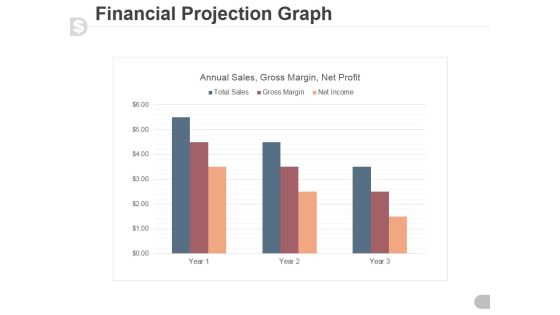
Financial Projection Graph Template 1 Ppt PowerPoint Presentation Guide
This is a financial projection graph template 1 ppt powerpoint presentation guide. This is a three stage process. The stages in this process are annual sales, gross margin, net profit.
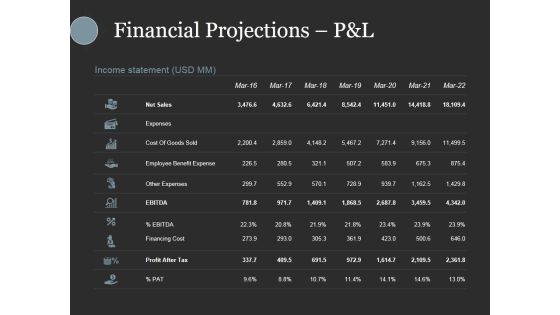
Financial Projections Pandl Ppt PowerPoint Presentation Slides Show
This is a financial projections pandl ppt powerpoint presentation slides show. This is a seven stage process. The stages in this process are net sales, expenses, cost of goods sold, employee benefit expense, other expenses.
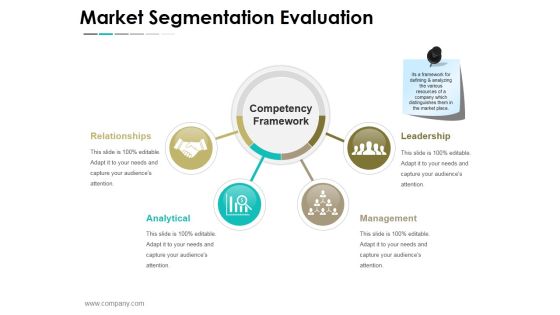
Market Segmentation Evaluation Ppt PowerPoint Presentation Layouts Images
This is a market segmentation evaluation ppt powerpoint presentation layouts images. This is a two stage process. The stages in this process are market sales, net profit, confectionary, milk products, beverages, nutrition and health care.
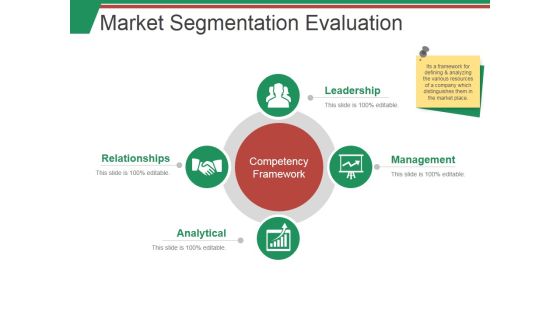
Market Segmentation Evaluation Template 1 Ppt PowerPoint Presentation Summary Smartart
This is a market segmentation evaluation template 1 ppt powerpoint presentation summary smartart. This is a two stage process. The stages in this process are market sales, net profit, beverages, milk product, nutrition.
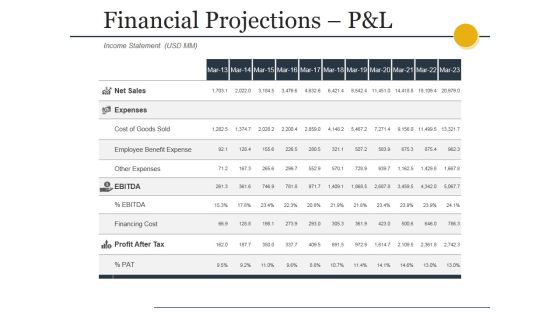
Financial Projections Pandl Ppt PowerPoint Presentation Styles Gallery
This is a financial projections pandl ppt powerpoint presentation styles gallery. This is a eleven stage process. The stages in this process are net sales, expenses, cost of goods sold, employee benefit expense, other expenses.
Financial Summary Ppt PowerPoint Presentation Icon Pictures
This is a financial summary ppt powerpoint presentation icon pictures. This is a seven stage process. The stages in this process are net sales, expenses, ebitda, profit after tax.
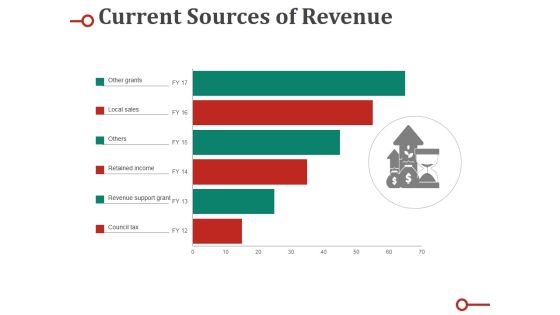
Current Sources Of Revenue Ppt PowerPoint Presentation Pictures Skills
This is a current sources of revenue ppt powerpoint presentation pictures skills. This is a six stage process. The stages in this process are other grants, local sales, others, retained income, revenue support grant.
Pandl Kpis Tabular Form Ppt PowerPoint Presentation Icon
This is a pandl kpis tabular form ppt powerpoint presentation icon. This is a four stage process. The stages in this process are business, net sales, total income, expenses, profit before tax, profit after tax.
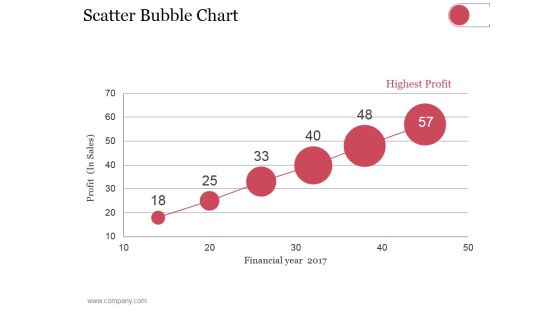
Scatter Bubble Chart Ppt PowerPoint Presentation Summary Pictures
This is a scatter bubble chart ppt powerpoint presentation summary pictures. This is a six stage process. The stages in this process are highest profit, financial year, profit in sales.

The Core Team Ppt PowerPoint Presentation Visual Aids
This is a the core team ppt powerpoint presentation visual aids. This is a four stage process. The stages in this process are ceo, director of sales, director, managing director.
 Home
Home