Sales Performance Dashboard
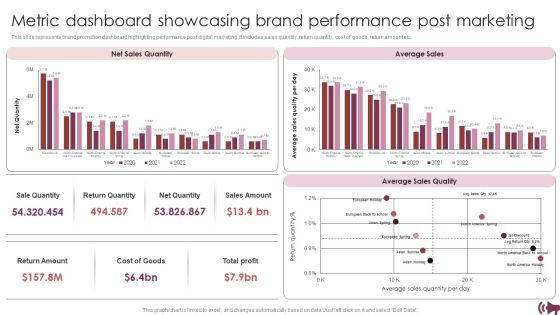
Guide Digital Advertising Optimize Lead Targeting Metric Dashboard Showcasing Brand Performance Post Slides PDF
This slide represents brand promotion dashboard highlighting performance post digital marketing. It includes sales quantity, return quantity, cost of goods, return amount etc. From laying roadmaps to briefing everything in detail, our templates are perfect for you. You can set the stage with your presentation slides. All you have to do is download these easy to edit and customizable templates. Guide Digital Advertising Optimize Lead Targeting Metric Dashboard Showcasing Brand Performance Post Slides PDF will help you deliver an outstanding performance that everyone would remember and praise you for. Do download this presentation today.
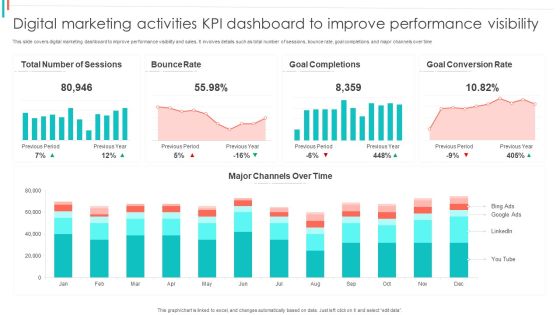
Digital Marketing Activities KPI Dashboard To Improve Performance Visibility Summary PDF
This slide covers digital marketing dashboard to improve performance visibility and sales. It involves details such as total number of sessions, bounce rate, goal completions and major channels over time.Showcasing this set of slides titled Digital Marketing Activities KPI Dashboard To Improve Performance Visibility Summary PDF. The topics addressed in these templates are Bounce Rate, Goal Completions, Goal Conversion. All the content presented in this PPT design is completely editable. Download it and make adjustments in color, background, font etc. as per your unique business setting.
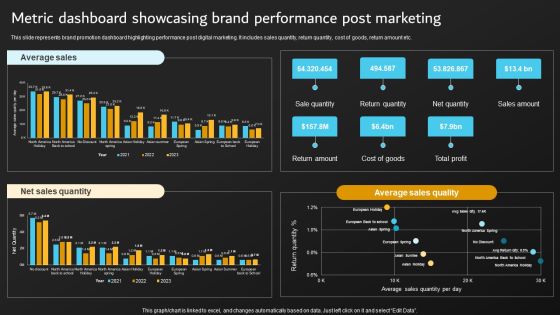
Implementation Of Digital Marketing Metric Dashboard Showcasing Brand Performance Diagrams PDF
This slide represents brand promotion dashboard highlighting performance post digital marketing. It includes sales quantity, return quantity, cost of goods, return amount etc. Slidegeeks has constructed Implementation Of Digital Marketing Metric Dashboard Showcasing Brand Performance Diagrams PDF after conducting extensive research and examination. These presentation templates are constantly being generated and modified based on user preferences and critiques from editors. Here, you will find the most attractive templates for a range of purposes while taking into account ratings and remarks from users regarding the content. This is an excellent jumping-off point to explore our content and will give new users an insight into our top-notch PowerPoint Templates.
Monthly Sales KPI Dashboard For Tracking Brand Recommendation Progress Background PDF
Following slide demonstrates key performance indicator dashboard for tracking monthly sales to monitor business performance. It includes components such as monthly execution cost, sales, state wise events, Brand market, and programs. Showcasing this set of slides titled Monthly Sales KPI Dashboard For Tracking Brand Recommendation Progress Background PDF. The topics addressed in these templates are Products Sold, Engagements, Events, Active Markets, Sampled, Attendance. All the content presented in this PPT design is completely editable. Download it and make adjustments in color, background, font etc. as per your unique business setting.
Product And Customer Performance Tracking Dashboard Techniques For Crafting Killer Background PDF
This slide provides information regarding dashboard utilized by firm to monitor performance of products offered and customer associated. The performance is tracked through revenues generated, new customer acquired, customer satisfaction, sales comparison, etc. This Product And Customer Performance Tracking Dashboard Techniques For Crafting Killer Background PDF is perfect for any presentation, be it in front of clients or colleagues. It is a versatile and stylish solution for organizing your meetings. The Product And Customer Performance Tracking Dashboard Techniques For Crafting Killer Background PDF features a modern design for your presentation meetings. The adjustable and customizable slides provide unlimited possibilities for acing up your presentation. Slidegeeks has done all the homework before launching the product for you. So, do not wait, grab the presentation templates today

Amazon Tactical Plan KPI Dashboard To Track Amazon Performance Clipart PDF
This slide provides information regarding dashboard to monitor Amazon performance. The KPIs include tracking of product sales, conversion rate, advertising spends, session, organic sales, etc. The Amazon Tactical Plan KPI Dashboard To Track Amazon Performance Clipart PDF is a compilation of the most recent design trends as a series of slides. It is suitable for any subject or industry presentation, containing attractive visuals and photo spots for businesses to clearly express their messages. This template contains a variety of slides for the user to input data, such as structures to contrast two elements, bullet points, and slides for written information. Slidegeeks is prepared to create an impression.
Enhancing Retail Process By Effective Inventory Management Retail Store Performance Analysis Dashboard Icons PDF
Mentioned slide displays a dashboard to assess retail store performance. Metrics included in the dashboard are net sales, average unit in retail, average basket size, sales volume by store and total visitors count. Explore a selection of the finest Enhancing Retail Process By Effective Inventory Management Retail Store Performance Analysis Dashboard Icons PDF here. With a plethora of professionally designed and pre made slide templates, you can quickly and easily find the right one for your upcoming presentation. You can use our Enhancing Retail Process By Effective Inventory Management Retail Store Performance Analysis Dashboard Icons PDF to effectively convey your message to a wider audience. Slidegeeks has done a lot of research before preparing these presentation templates. The content can be personalized and the slides are highly editable. Grab templates today from Slidegeeks.
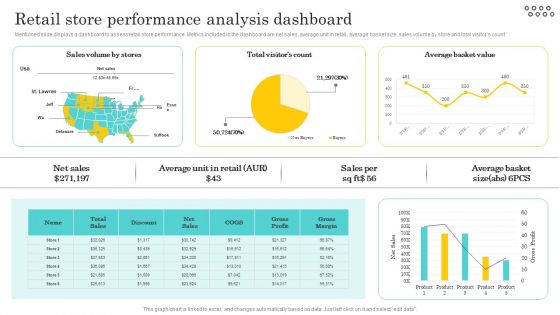
Optimizing And Managing Retail Retail Store Performance Analysis Dashboard Rules PDF
Mentioned slide displays a dashboard to assess retail store performance. Metrics included in the dashboard are net sales, average unit in retail, average basket size, sales volume by store and total visitors count. This Optimizing And Managing Retail Retail Store Performance Analysis Dashboard Rules PDF from Slidegeeks makes it easy to present information on your topic with precision. It provides customization options, so you can make changes to the colors, design, graphics, or any other component to create a unique layout. It is also available for immediate download, so you can begin using it right away. Slidegeeks has done good research to ensure that you have everything you need to make your presentation stand out. Make a name out there for a brilliant performance.

Crm Dashboard Sales Dashboard Template Ppt PowerPoint Presentation Portfolio Master Slide
This is a crm dashboard sales dashboard template ppt powerpoint presentation portfolio master slide. This is a four stage process. The stages in this process are sales by product march, total lead ownership, month over month closing trend, lead owner breakdown.

Digital Marketing Approach For Brand Awareness Metric Dashboard Showcasing Brand Performance Post Marketing Mockup PDF
Presenting this PowerPoint presentation, titled Digital Marketing Approach For Brand Awareness Metric Dashboard Showcasing Brand Performance Post Marketing Mockup This slide represents brand promotion dashboard highlighting performance post digital marketing. It includes sales quantity, return quantity, cost of goods, return amount etc. PDF, with topics curated by our researchers after extensive research. This editable presentation is available for immediate download and provides attractive features when used. Download now and captivate your audience. Presenting this Digital Marketing Approach For Brand Awareness Metric Dashboard Showcasing Brand Performance Post Marketing Mockup PDF. Our researchers have carefully researched and created these slides with all aspects taken into consideration. This is a completely customizable Digital Marketing Approach For Brand Awareness Metric Dashboard Showcasing Brand Performance Post Marketing Mockup PDF that is available for immediate downloading. Download now and make an impact on your audience. Highlight the attractive features available with our PPTs.

Deploying B2B Advertising Techniques For Lead Generation Digital Marketing Dashboard Improve Performance Inspiration PDF
This slide covers digital marketing dashboard to improve performance visibility and sales. It involves details such as total number of sessions, bounce rate, goal completions and major channels over time. Crafting an eye catching presentation has never been more straightforward. Let your presentation shine with this tasteful yet straightforward Deploying B2B Advertising Techniques For Lead Generation Digital Marketing Dashboard Improve Performance Inspiration PDF template. It offers a minimalistic and classy look that is great for making a statement. The colors have been employed intelligently to add a bit of playfulness while still remaining professional. Construct the ideal Deploying B2B Advertising Techniques For Lead Generation Digital Marketing Dashboard Improve Performance Inspiration PDF that effortlessly grabs the attention of your audience. Begin now and be certain to wow your customers.
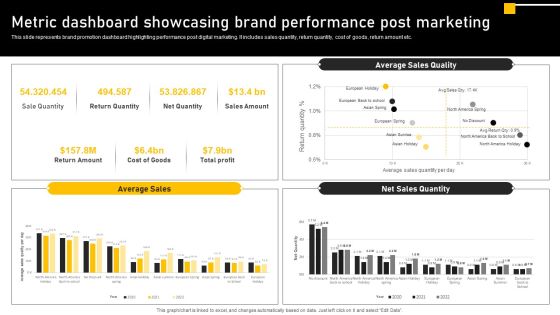
Online Ads Strategic Plan For Effective Marketing Metric Dashboard Showcasing Brand Performance Post Themes PDF
This slide represents brand promotion dashboard highlighting performance post digital marketing. It includes sales quantity, return quantity, cost of goods, return amount etc. Do you have to make sure that everyone on your team knows about any specific topic I yes, then you should give Online Ads Strategic Plan For Effective Marketing Metric Dashboard Showcasing Brand Performance Post Themes PDF a try. Our experts have put a lot of knowledge and effort into creating this impeccable Online Ads Strategic Plan For Effective Marketing Metric Dashboard Showcasing Brand Performance Post Themes PDF. You can use this template for your upcoming presentations, as the slides are perfect to represent even the tiniest detail. You can download these templates from the Slidegeeks website and these are easy to edit. So grab these today.
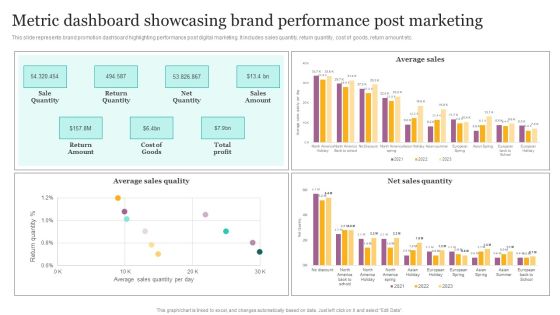
Metric Dashboard Showcasing Brand Performance Post Marketing Ppt Layouts Microsoft PDF
This slide represents brand promotion dashboard highlighting performance post digital marketing. It includes sales quantity, return quantity, cost of goods, return amount etc. Explore a selection of the finest Metric Dashboard Showcasing Brand Performance Post Marketing Ppt Layouts Microsoft PDF here. With a plethora of professionally designed and pre made slide templates, you can quickly and easily find the right one for your upcoming presentation. You can use our Metric Dashboard Showcasing Brand Performance Post Marketing Ppt Layouts Microsoft PDF to effectively convey your message to a wider audience. Slidegeeks has done a lot of research before preparing these presentation templates. The content can be personalized and the slides are highly editable. Grab templates today from Slidegeeks.
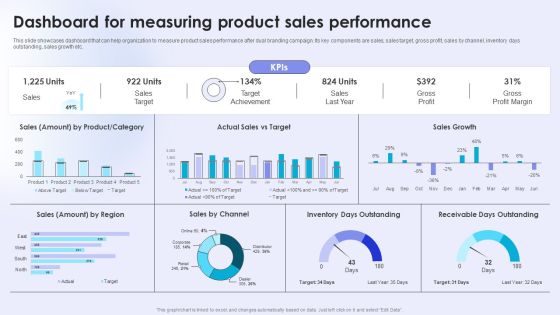
Dual Branding Campaign To Boost Sales Of Product Or Services Dashboard For Measuring Product Sales Elements PDF
This slide showcases dashboard that can help organization to measure product sales performance after dual branding campaign. Its key components are sales, sales target, gross profit, sales by channel, inventory days outstanding, sales growth etc. The Dual Branding Campaign To Boost Sales Of Product Or Services Dashboard For Measuring Product Sales Elements PDF is a compilation of the most recent design trends as a series of slides. It is suitable for any subject or industry presentation, containing attractive visuals and photo spots for businesses to clearly express their messages. This template contains a variety of slides for the user to input data, such as structures to contrast two elements, bullet points, and slides for written information. Slidegeeks is prepared to create an impression.
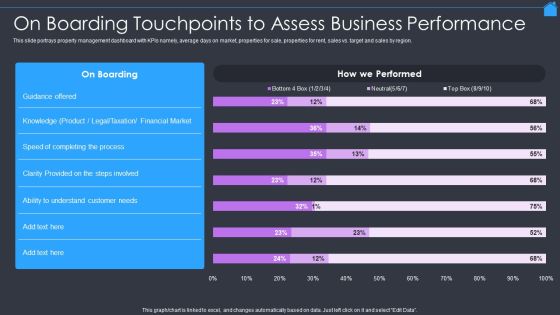
Marketing Strategy To Enhance Real Estate Sales On Boarding Touchpoints To Assess Business Performance Guidelines PDF
This slide portrays property management dashboard with KPIs namely, average days on market, properties for sale, properties for rent, sales vs. target and sales by region. Deliver an awe inspiring pitch with this creative Marketing Strategy To Enhance Real Estate Sales On Boarding Touchpoints To Assess Business Performance Guidelines PDF bundle. Topics like Financial Market, Taxation, Product can be discussed with this completely editable template. It is available for immediate download depending on the needs and requirements of the user.

Table Of Contents Digitally Streamline Automation Sales Operations Performance Slides PDF
Presenting Table Of Contents Digitally Streamline Automation Sales Operations Performance Slides PDF to provide visual cues and insights. Share and navigate important information on six stages that need your due attention. This template can be used to pitch topics like Implementation Of Sales, Dashboard And Metrics, Sales Automation. In addtion, this PPT design contains high resolution images, graphics, etc, that are easily editable and available for immediate download.

Sales And Marketing Operations Assessment Retail Outlet Performance Assessment Introduction PDF
This slide illustrates the dashboard retail store sales forecasting providing information regarding sales per employee, price unit every transaction, total number of customers and average value of customer transaction.Deliver an awe inspiring pitch with this creative Sales And Marketing Operations Assessment Retail Outlet Performance Assessment Introduction PDF bundle. Topics like Operations Assessment, Marketing Operations, Media Activities can be discussed with this completely editable template. It is available for immediate download depending on the needs and requirements of the user.

Weekly Sales Performance Highlights With Product Share Ppt File Information PDF
This graph or chart is linked to excel, and changes automatically based on data. Just left click on it and select Edit Data. Pitch your topic with ease and precision using this Weekly Sales Performance Highlights With Product Share Ppt File Information PDF. This layout presents information on Dashboard Summary, Weekly Sale, Product Share. It is also available for immediate download and adjustment. So, changes can be made in the color, design, graphics or any other component to create a unique layout.

Measuring Sales Performance And Productivity Ppt PowerPoint Presentation Infographic Template Sample
This is a measuring sales performance and productivity ppt powerpoint presentation infographic template sample. This is a eight stage process. The stages in this process are sales objectives, sales goal, achieving sales target.

Comprehensive Guide For Sales And Advertising Processes Marketing Campaign Performance Management Graphics PDF
This slide presents a dashboard ti track and measure performance of marketing campaign for effective decision making. It provides information about bounce rate, new users, users, average session duration, page performance, page path, average time on page, goal conversion rate and goal completions. Present like a pro with Comprehensive Guide For Sales And Advertising Processes Marketing Campaign Performance Management Graphics PDF Create beautiful presentations together with your team, using our easy-to-use presentation slides. Share your ideas in real-time and make changes on the fly by downloading our templates. So whether you are in the office, on the go, or in a remote location, you can stay in sync with your team and present your ideas with confidence. With Slidegeeks presentation got a whole lot easier. Grab these presentations today.

Sales Rep Performance Scorecard Ppt PowerPoint Presentation Infographic Template Master Slide
This is a sales rep performance scorecard ppt powerpoint presentation infographic template master slide. This is a four stage process. The stages in this process are overall territory performance, finance, analysis, marketing, business.
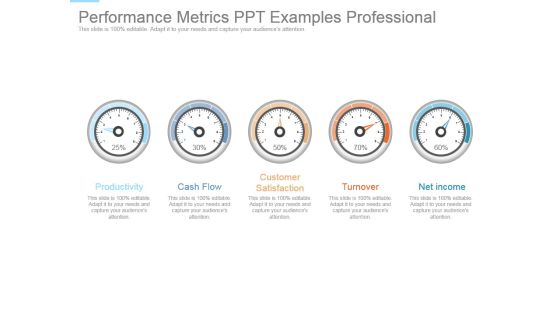
Performance Metrics Ppt Examples Professional
This is a performance metrics ppt examples professional. This is a five stage process. The stages in this process are productivity, cash flow, customer satisfaction, turnover, net income.
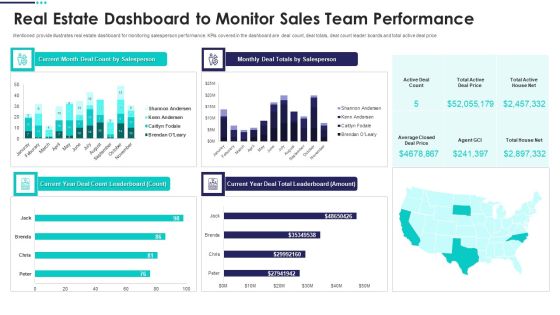
Real Estate Marketing Plan To Sell Real Estate Dashboard To Monitor Sales Team Demonstration PDF
Mentioned provide illustrates real estate dashboard for monitoring salesperson performance. KPIs covered in the dashboard are deal count, deal totals, deal count leader boards and total active deal price Deliver an awe inspiring pitch with this creative Real Estate Marketing Plan To Sell Real Estate Dashboard To Monitor Sales Team Demonstration PDF bundle. Topics like Real Estate Dashboard To Monitor Sales Team Performance can be discussed with this completely editable template. It is available for immediate download depending on the needs and requirements of the user.
SAC Planning And Implementation SAP Analytics Cloud Dashboard For Product Sales Analysis Icons PDF
This slide illustrates the SAP Analytics Cloud dashboard to monitor product sales performance. It provides information regarding the gross margin and net revenue earned, product performance state wise and year wise. Deliver and pitch your topic in the best possible manner with this SAC Planning And Implementation SAP Analytics Cloud Dashboard For Product Sales Analysis Icons PDF. Use them to share invaluable insights on Gross Margin, Earned Quarter Wise, Gross Margin, Net Revenue and impress your audience. This template can be altered and modified as per your expectations. So, grab it now.

Sales Key Performance Indicators Of The Company Before Strategy Implementation Growth Ppt Infographic Template Microsoft PDF
This slide shows the current Sales Performance Indicators of the company before adopting an effective strategy. These stats are related to Sales Growth, Average Sales Cycle Length, Profit Margin, Customer Churn Rate, Overall Company Sales etc. from the years 2018 to 2020 along with key takeaways. Deliver and pitch your topic in the best possible manner with this sales key performance indicators of the company before strategy implementation growth ppt infographic template microsoft pdf. Use them to share invaluable insights on performance indicators metrics, sales growth, customer churn rate, profit margin, 2018 to 2020 and impress your audience. This template can be altered and modified as per your expectations. So, grab it now.

Estimated Sales Key Performance Indicators In The Company After Strategy Implementation Mockup PDF
This slide shows the future estimated Sales Key Performance Indicators of the company after adopting strategy. These stats are related to Sales Growth, Average Sales Cycle Length, Profit Margin, Customer Churn Rate, Overall Company Sales etc. from the years 2020 to 2022 along with key takeaways. Deliver an awe inspiring pitch with this creative estimated sales key performance indicators in the company after strategy implementation mockup pdf bundle. Topics like performance indicators, sales growth, profit margin, overall company sales, 2020 2022 can be discussed with this completely editable template. It is available for immediate download depending on the needs and requirements of the user.
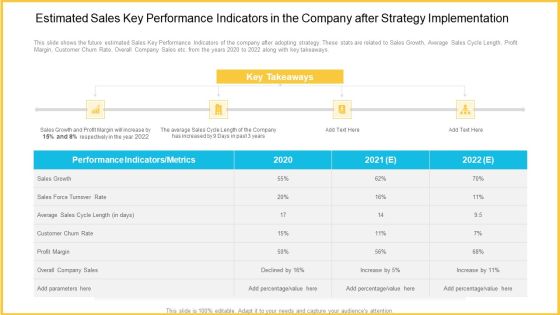
Estimated Sales Key Performance Indicators In The Company After Strategy Implementation Diagrams PDF
This slide shows the future estimated Sales Key Performance Indicators of the company after adopting strategy. These stats are related to Sales Growth, Average Sales Cycle Length, Profit Margin, Customer Churn Rate, Overall Company Sales etc. from the years 2020 to 2022 along with key takeaways. Deliver an awe-inspiring pitch with this creative estimated sales key performance indicators in the company after strategy implementation diagrams pdf. bundle. Topics like sales growth, sales force turnover rate, customer churn rate, profit margin, overall company sales can be discussed with this completely editable template. It is available for immediate download depending on the needs and requirements of the user.

Sales Key Performance Indicators Of The Company Before Strategy Implementation Inspiration PDF
This slide shows the current Sales Performance Indicators of the company before adopting an effective strategy. These stats are related to Sales Growth, Average Sales Cycle Length, Profit Margin, Customer Churn Rate, Overall Company Sales etc. from the years 2019 to 2021 along with key takeaways. Deliver an awe-inspiring pitch with this creative sales key performance indicators of the company before strategy implementation inspiration pdf. bundle. Topics like sales growth, sales force turnover rate, customer churn rate, profit margin, overall company sales can be discussed with this completely editable template. It is available for immediate download depending on the needs and requirements of the user.

Go To Market Strategy For New Product Sales Performance Over Last Three Years Guidelines PDF
This slide shows bar graph that demonstrating sales performance of top products over last three years along with region wise sales data. Deliver an awe inspiring pitch with this creative go to market strategy for new product sales performance over last three years guidelines pdf bundle. Topics like sales performance over last three years can be discussed with this completely editable template. It is available for immediate download depending on the needs and requirements of the user.
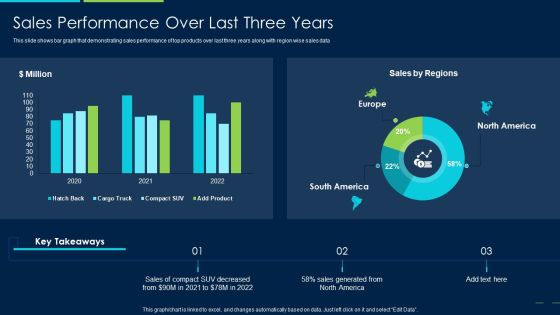
Marketing Strategy New Product Introduction Sales Performance Over Last Three Years Slides PDF
This slide shows bar graph that demonstrating sales performance of top products over last three years along with region wise sales data Deliver and pitch your topic in the best possible manner with this marketing strategy new product introduction sales performance over last three years slides pdf. Use them to share invaluable insights on sales performance over last three years and impress your audience. This template can be altered and modified as per your expectations. So, grab it now.
Illustrating Product Leadership Plan Incorporating Innovative Techniques Dashboard Depicting Sales Icons PDF
This slide focuses on dashboard that depicts sales product performance that includes top products in revenues, online verses offline purchases, incremental sales by campaign and cost of goods sold. Deliver an awe inspiring pitch with this creative illustrating product leadership plan incorporating innovative techniques dashboard depicting sales icons pdf bundle. Topics like incremental sales by campaign, top products in revenue, online vs offline purchases, cost of goods sold can be discussed with this completely editable template. It is available for immediate download depending on the needs and requirements of the user.

Enterprise Sales Performance Report With Quantity And Units Ppt PowerPoint Presentation Summary Vector PDF
Presenting this set of slides with name enterprise sales performance report with quantity and units ppt powerpoint presentation summary vector pdf. The topics discussed in these slides are sales detail, product, performance, total sales qty unit, total amount. This is a completely editable PowerPoint presentation and is available for immediate download. Download now and impress your audience.

Weekly Sales Performance Assessment With Trends And Comments Ppt PowerPoint Presentation Model Maker PDF
Presenting this set of slides with name weekly sales performance assessment with trends and comments ppt powerpoint presentation model maker pdf. The topics discussed in these slides are weekly sales snapshot, daily sales snapshot, trend, gross, gross sales. This is a completely editable PowerPoint presentation and is available for immediate download. Download now and impress your audience.

Business Sales Key Performance Indicators Report Ppt PowerPoint Presentation Icon Slideshow PDF
Showcasing this set of slides titled business sales key performance indicators report ppt powerpoint presentation icon slideshow pdf. The topics addressed in these templates are business sales key performance indicators report. All the content presented in this PPT design is completely editable. Download it and make adjustments in color, background, font etc. as per your unique business setting.

Cumulative Sales Key Performance Indicators Report Ppt PowerPoint Presentation Model Images PDF
Showcasing this set of slides titled cumulative sales key performance indicators report ppt powerpoint presentation model images pdf. The topics addressed in these templates are cumulative sales key performance indicators report. All the content presented in this PPT design is completely editable. Download it and make adjustments in color, background, font etc. as per your unique business setting.

Key Performance Indicators Of Sales Growth Ppt PowerPoint Presentation Portfolio Clipart Images PDF
Presenting this set of slides with name key performance indicators of sales growth ppt powerpoint presentation portfolio clipart images pdf. The topics discussed in these slides are monthly total sales, monthly sales volume, compare with last month, sales volume by category. This is a completely editable PowerPoint presentation and is available for immediate download. Download now and impress your audience.
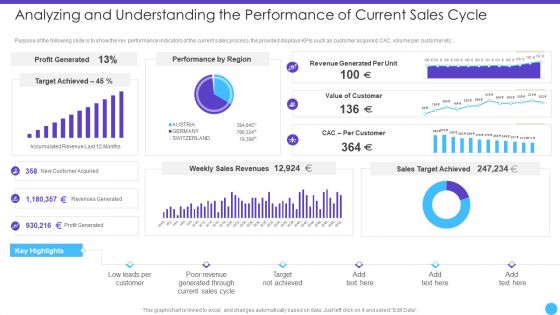
Analyzing And Understanding The Performance Of Current Sales Cycle Download PDF
Purpose of the following slide is to show the key performance indicators of the current sales process, the provided displays KPIs such as customer acquired, CAC, volume per customer etc.Deliver an awe inspiring pitch with this creative Analyzing And Understanding The Performance Of Current Sales Cycle Download PDF bundle. Topics like Profit Generated, Target Achieved, Performance By Region can be discussed with this completely editable template. It is available for immediate download depending on the needs and requirements of the user.

Sales Performance Analysis To Meet Goals Ppt PowerPoint Presentation Infographic Template Styles PDF
Presenting sales performance analysis to meet goals ppt powerpoint presentation infographic template styles pdf to dispense important information. This template comprises three stages. It also presents valuable insights into the topics including sales performance analysis to meet goals. This is a completely customizable PowerPoint theme that can be put to use immediately. So, download it and address the topic impactfully.
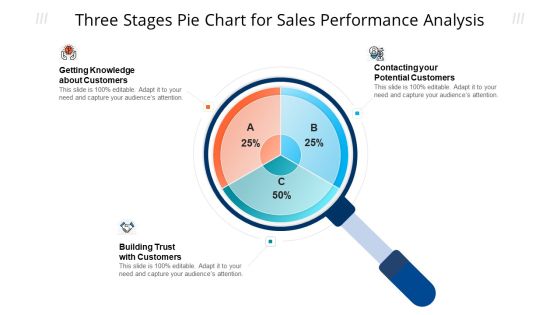
Three Stages Pie Chart For Sales Performance Analysis Ppt Model Tips PDF
Persuade your audience using this three stages pie chart for sales performance analysis ppt model tips pdf. This PPT design covers three stages, thus making it a great tool to use. It also caters to a variety of topics including potential customers, knowledge about customers, sales performance analysis. Download this PPT design now to present a convincing pitch that not only emphasizes the topic but also showcases your presentation skills.
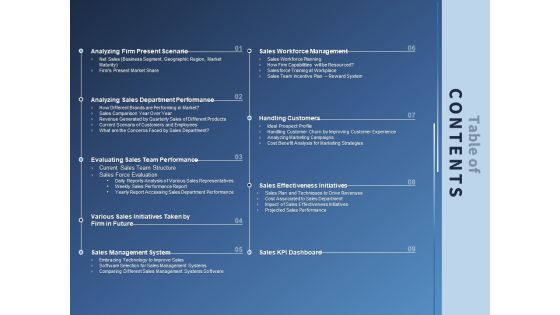
Performance Assessment Sales Initiative Report Table Of Contents Ppt Summary Aids PDF
Presenting this set of slides with name performance assessment sales initiative report table of contents ppt summary aids pdf. The topics discussed in these slides are scenario, performance, evaluating, sales, management. This is a completely editable PowerPoint presentation and is available for immediate download. Download now and impress your audience.

CRM For Real Estate Marketing Sales Performance Of Competitors Ppt PowerPoint Presentation Infographics Infographics PDF
Presenting this set of slides with name crm for real estate marketing sales performance of competitors ppt powerpoint presentation infographics infographics pdf. The topics discussed in these slides are own business, 2017 to 2019, sales performance, competitors. This is a completely editable PowerPoint presentation and is available for immediate download. Download now and impress your audience.

Incrementalism Process By Policy Makers Business Performance Measurement Metrics Sales Ppt Infographic Template Files PDF
Presenting this set of slides with name incrementalism process by policy makers business performance measurement metrics sales ppt infographic template files pdf. The topics discussed in these slides are sales, growth, targeted, revenue, performance. This is a completely editable PowerPoint presentation and is available for immediate download. Download now and impress your audience.
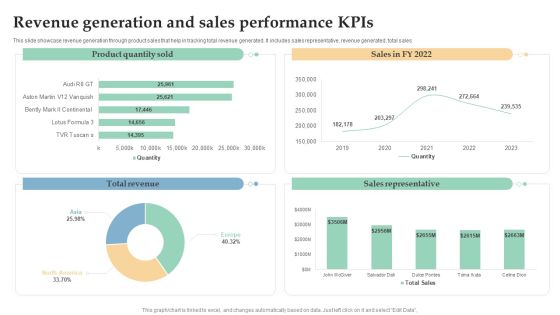
Revenue Generation And Sales Performance Kpis Ppt Inspiration Background Image PDF
This slide showcase revenue generation through product sales that help in tracking total revenue generated. It includes sales representative, revenue generated, total sales. Pitch your topic with ease and precision using this Revenue Generation And Sales Performance Kpis Ppt Inspiration Background Image PDF. This layout presents information on Total Revenue, Sales Representative, Product Quantity Sold. It is also available for immediate download and adjustment. So, changes can be made in the color, design, graphics or any other component to create a unique layout.

Key Performance Indicators For Business Sales Analysis Ppt PowerPoint Presentation Infographic Template Introduction PDF
Presenting key performance indicators for business sales analysis ppt powerpoint presentation infographic template introduction pdf to dispense important information. This template comprises five stages. It also presents valuable insights into the topics including average purchase value, sales opportunities, sales bookings, average profit margin, sales growth. This is a completely customizable PowerPoint theme that can be put to use immediately. So, download it and address the topic impactfully.
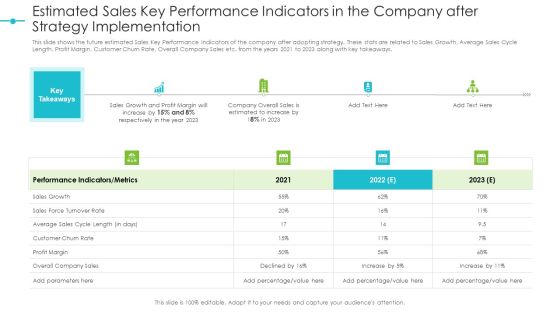
Estimated Sales Key Performance Indicators In The Company After Strategy Implementation Structure PDF
This slide shows the future estimated Sales Key Performance Indicators of the company after adopting strategy. These stats are related to Sales Growth, Average Sales Cycle Length, Profit Margin, Customer Churn Rate, Overall Company Sales etc. from the years 2021 to 2023 along with key takeaways. This is a estimated sales key performance indicators in the company after strategy implementation structure pdf template with various stages. Focus and dispense information on four stages using this creative set, that comes with editable features. It contains large content boxes to add your information on topics like performance, sales, growth, profit margin. You can also showcase facts, figures, and other relevant content using this PPT layout. Grab it now.
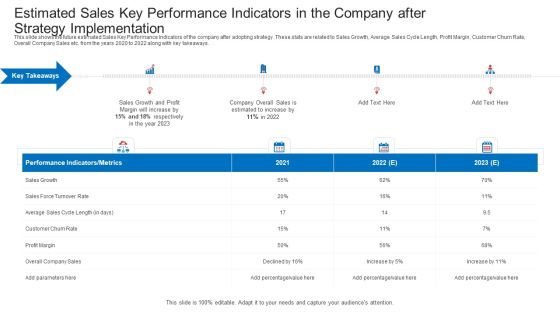
Estimated Sales Key Performance Indicators In The Company After Strategy Implementation Information PDF
This slide shows the future estimated Sales Key Performance Indicators of the company after adopting strategy. These stats are related to Sales Growth, Average Sales Cycle Length, Profit Margin, Customer Churn Rate, Overall Company Sales etc. from the years 2021 to 2023 along with key takeaways. This is a estimated sales key performance indicators in the company after strategy implementation information pdf template with various stages. Focus and dispense information on four stages using this creative set, that comes with editable features. It contains large content boxes to add your information on topics like performance, sales, growth, profit margin. You can also showcase facts, figures, and other relevant content using this PPT layout. Grab it now.
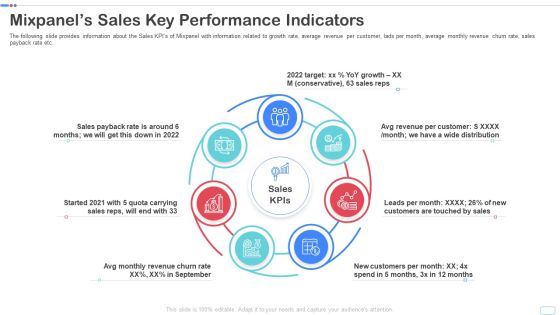
Mixpanel Capital Raising Pitch Deck Mixpanels Sales Key Performance Indicators Clipart PDF
The following slide provides information about the Sales KPIs of Mixpanel with information related to growth rate, average revenue per customer, lads per month, average monthly revenue churn rate, sales payback rate etc. This is a mixpanel capital raising pitch deck mixpanels sales key performance indicators clipart pdf template with various stages. Focus and dispense information on seven stages using this creative set, that comes with editable features. It contains large content boxes to add your information on topics like mixpanels sales key performance indicators. You can also showcase facts, figures, and other relevant content using this PPT layout. Grab it now.

Sales Performance Monitoring Order Number Detection Icon Ppt Summary Rules PDF
Persuade your audience using this Sales Performance Monitoring Order Number Detection Icon Ppt Summary Rules PDF. This PPT design covers four stages, thus making it a great tool to use. It also caters to a variety of topics including Sales Performance, Monitoring Order, Number Detection, Icon. Download this PPT design now to present a convincing pitch that not only emphasizes the topic but also showcases your presentation skills.
Five Staged Key Performance Indicators Of A Sales Company Ppt PowerPoint Presentation Summary
This is a five staged key performance indicators of a sales company ppt powerpoint presentation summary. This is a five stage process. The stages in this process are business, circular process, marketing, strategy, analysis.

Key Performance Indicators Of Sales Coaching Program Ppt Styles Graphic Images PDF
The following slide highlights the key statistics of sales training program on overall business performance. It also includes three main elements namely retention, budget and impact. Presenting Key Performance Indicators Of Sales Coaching Program Ppt Styles Graphic Images PDF to dispense important information. This template comprises three stages. It also presents valuable insights into the topics including Retention, Budget, Impact, Employee. This is a completely customizable PowerPoint theme that can be put to use immediately. So, download it and address the topic impactfully.

How To Make Sure Weekly Sales Performance Reports Are Effective Ideas PDF
The following slide exhibits factors to ensure that sales people treat data as more than just numbers on spreadsheet. It presents information related to translating information, sharing performance, etc. Presenting How To Make Sure Weekly Sales Performance Reports Are Effective Ideas PDF to dispense important information. This template comprises three stages. It also presents valuable insights into the topics including Share Performance Team, Team Data, Translate Data, Actionable Steps. This is a completely customizable PowerPoint theme that can be put to use immediately. So, download it and address the topic impactfully.
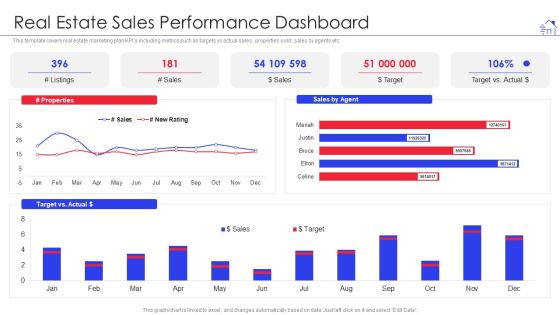
Promotional Strategies For Property Development Firm Real Estate Sales Performance Formats PDF
This template covers real estate marketing plan KPIs including metrics such as targets vs actual sales , properties sold , sales by agents etc. Deliver an awe inspiring pitch with this creative promotional strategies for property development firm real estate sales performance formats pdf bundle. Topics like target, sales can be discussed with this completely editable template. It is available for immediate download depending on the needs and requirements of the user.
Key Performance Indicators Examples Sales Ppt PowerPoint Presentation File Example Cpb Pdf
Presenting this set of slides with name key performance indicators examples sales ppt powerpoint presentation file example cpb pdf. This is an editable Powerpoint eight stages graphic that deals with topics like key performance indicators examples sales to help convey your message better graphically. This product is a premium product available for immediate download and is 100 percent editable in Powerpoint. Download this now and use it in your presentations to impress your audience.
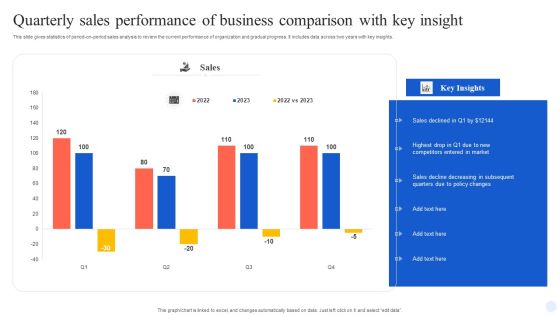
Quarterly Sales Performance Of Business Comparison With Key Insight Guidelines PDF
This slide gives statistics of period-on-period sales analysis to review the current performance of organization and gradual progress. It includes data across two years with key insights. Showcasing this set of slides titled Quarterly Sales Performance Of Business Comparison With Key Insight Guidelines PDF. The topics addressed in these templates are Quarterly Sales Performance, Business Comparison, Key Insight. All the content presented in this PPT design is completely editable. Download it and make adjustments in color, background, font etc. as per your unique business setting.

BANT Sales Lead Qualification Model Analyzing And Understanding The Performance Icons PDF
Purpose of the following slide is to show the key performance indicators of the current sales process, the provided displays KPIs such as customer acquired, CAC, volume per customer etc. Deliver and pitch your topic in the best possible manner with this BANT Sales Lead Qualification Model Analyzing And Understanding The Performance Icons PDF. Use them to share invaluable insights on New Customer, Weekly Sales, Revenues Sales and impress your audience. This template can be altered and modified as per your expectations. So, grab it now.
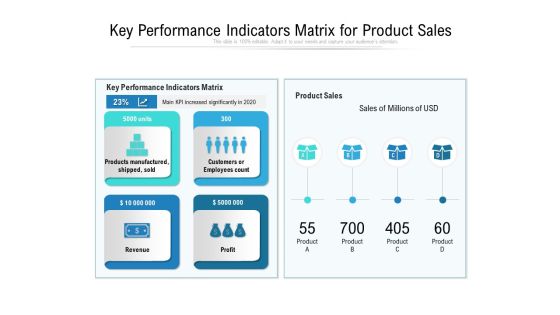
Key Performance Indicators Matrix For Product Sales Ppt PowerPoint Presentation File Clipart PDF
Presenting key performance indicators matrix for product sales ppt powerpoint presentation file clipart pdf to dispense important information. This template comprises four stages. It also presents valuable insights into the topics including manufactured, revenue, performance. This is a completely customizable PowerPoint theme that can be put to use immediately. So, download it and address the topic impactfully.
Sales Department Management To Enhance Performance Tracking And Management Process Formats PDF
This slide represents the process to secure more sales and exceed the organizations revenue goals. It includes five steps to track sales team performance such as set goals and expectations, measure short term and long term goals, develop visual dashboard, work smarter and not harder and follow up team.Persuade your audience using this Sales Department Management To Enhance Performance Tracking And Management Process Formats PDF. This PPT design covers five stages, thus making it a great tool to use. It also caters to a variety of topics including Goals Expectations, Develop Visual, Gathered Insights. Download this PPT design now to present a convincing pitch that not only emphasizes the topic but also showcases your presentation skills.

Comparative Assessment Of Sales Team Performance Ppt Infographics Graphics Pictures PDF
This slide showcases comparative assessment of sales team performance of our business and competitors. It analyze performance on the basis of elements such as lead conversion rate, monthly sales growth, customer lifetime value, average conversion time , monthly calls and emails per representative, etc. Here you can discover an assortment of the finest PowerPoint and Google Slides templates. With these templates, you can create presentations for a variety of purposes while simultaneously providing your audience with an eye catching visual experience. Download Comparative Assessment Of Sales Team Performance Ppt Infographics Graphics Pictures PDF to deliver an impeccable presentation. These templates will make your job of preparing presentations much quicker, yet still, maintain a high level of quality. Slidegeeks has experienced researchers who prepare these templates and write high quality content for you. Later on, you can personalize the content by editing the Comparative Assessment Of Sales Team Performance Ppt Infographics Graphics Pictures PDF.

Competitive Sales Strategy Development Plan For Revenue Growth Key Performance Indicators Elements PDF
This slide shows the key performance indicators after implementing sales strategy such as total revenue, average revenue per customer, market share, win rate, year-over-year growth, customer lifetime value, etc. Presenting Competitive Sales Strategy Development Plan For Revenue Growth Key Performance Indicators Elements PDF to provide visual cues and insights. Share and navigate important information on four stages that need your due attention. This template can be used to pitch topics like Market Share, Total Revenue, Sales Expense Ratio. In addtion, this PPT design contains high resolution images, graphics, etc, that are easily editable and available for immediate download.
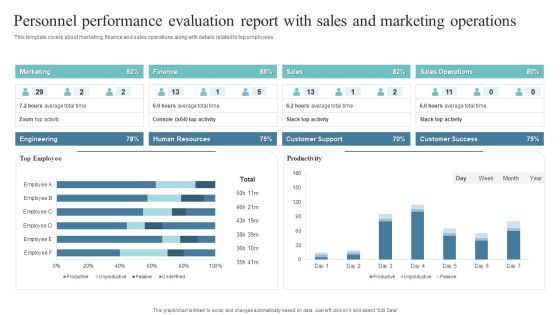
Personnel Performance Evaluation Report With Sales And Marketing Operations Infographics PDF
This template covers about marketing, finance and sales operations along with details related to top employees.Showcasing this set of slides titled Personnel Performance Evaluation Report With Sales And Marketing Operations Infographics PDF. The topics addressed in these templates are Human Resources, Customer Support, Sales Operations. All the content presented in this PPT design is completely editable. Download it and make adjustments in color, background, font etc. as per your unique business setting.

 Home
Home