Sales Performance Dashboard
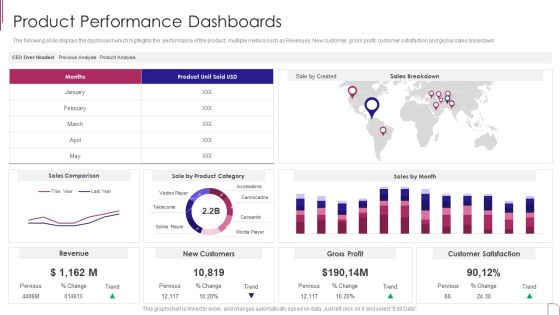
Yearly Product Performance Assessment Repor Product Performance Dashboards Designs PDF
The following slide displays the dashboard which highlights the performance of the product, multiple metrics such as Revenues, New customer, gross profit, customer satisfaction and global sales breakdown.Deliver and pitch your topic in the best possible manner with this Yearly Product Performance Assessment Repor Product Performance Dashboards Designs PDF Use them to share invaluable insights on Gross Profit, Customer Satisfaction, Sales Comparison and impress your audience. This template can be altered and modified as per your expectations. So, grab it now.

Sales Procedure Automation To Enhance Sales Dashboard Depicting Sales Kpis To Track Current Status Introduction PDF
This slide shows the dashboard that depicts sales KPIs to track current status which involves won and lost opportunities, revenues and pipeline by territory, sales by different products, etc.Deliver an awe inspiring pitch with this creative Sales Procedure Automation To Enhance Sales Dashboard Depicting Sales Kpis To Track Current Status Introduction PDF bundle. Topics like Won Opportunities, Total Opportunities, Pipeline Employee can be discussed with this completely editable template. It is available for immediate download depending on the needs and requirements of the user.

Branding Management Dashboard With Sales Volume Mockup PDF
This slide presents KPI dashboard indicating brand performance helpful in tracking sales and promotion. Price, location, merchandising and overall output can be useful for improving performance visibility and providing actionable insights. Showcasing this set of slides titled Branding Management Dashboard With Sales Volume Mockup PDF. The topics addressed in these templates are Branding Management Dashboard, Sales Volume. All the content presented in this PPT design is completely editable. Download it and make adjustments in color, background, font etc. as per your unique business setting.
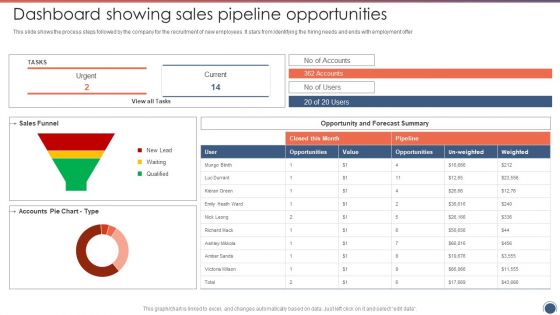
Dashboard Showing Sales Pipeline Opportunities Sales Funnel Management Strategies To Increase Sales Microsoft PDF
This slide shows the process steps followed by the company for the recruitment of new employees. It stars from Identifying the hiring needs and ends with employment offer.Deliver and pitch your topic in the best possible manner with this Dashboard Showing Sales Pipeline Opportunities Sales Funnel Management Strategies To Increase Sales Microsoft PDF. Use them to share invaluable insights on Sales Funnel, Forecast Summary, Opportunities and impress your audience. This template can be altered and modified as per your expectations. So, grab it now.
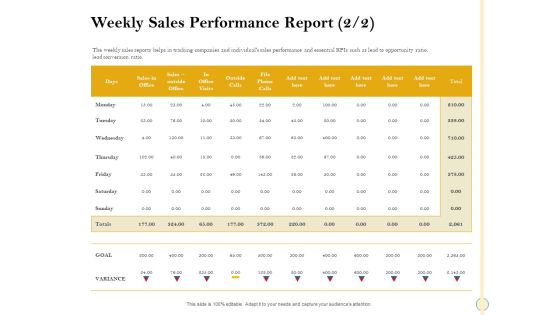
Sales Optimization Best Practices To Close More Deals Weekly Sales Performance Report Goal Structure PDF
The weekly sales reports helps in tracking companies and individuals sales performance and essential KPIs such as lead to opportunity ratio, lead conversion ratio. Deliver and pitch your topic in the best possible manner with this sales optimization best practices to close more deals weekly sales performance report goal structure pdf. Use them to share invaluable insights on weekly sales performance report and impress your audience. This template can be altered and modified as per your expectations. So, grab it now.

Sales Department Strategies Increase Revenues Weekly Sales Performance Report Structure PDF
The weekly sales reports helps in tracking companies and individuals sales performance and essential KPIs such as lead to opportunity ratio, lead conversion ratio. Deliver an awe-inspiring pitch with this creative sales department strategies increase revenues weekly sales performance report structure pdf bundle. Topics like weekly sales performance report can be discussed with this completely editable template. It is available for immediate download depending on the needs and requirements of the user.

Sales Assistance Boost Overall Efficiency Weekly Sales Performance Report Avg Ideas PDF
The weekly sales reports helps in tracking companies and individuals sales performance and essential KPIs such as lead to opportunity ratio, lead conversion ratio, customer lifetime value. Deliver an awe-inspiring pitch with this creative sales assistance boost overall efficiency weekly sales performance report avg ideas pdf bundle. Topics like weekly sales performance report can be discussed with this completely editable template. It is available for immediate download depending on the needs and requirements of the user.
Sales Assistance Boost Overall Efficiency Weekly Sales Performance Report Icons PDF
The weekly sales reports helps in tracking companies and individuals sales performance and essential KPIs such as lead to opportunity ratio, lead conversion ratio. Deliver and pitch your topic in the best possible manner with this sales assistance boost overall efficiency weekly sales performance report icons pdf. Use them to share invaluable insights on weekly sales performance report and impress your audience. This template can be altered and modified as per your expectations. So, grab it now.
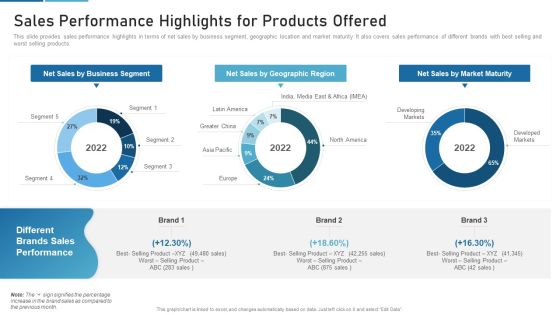
Sales Process Catalogue Template Sales Performance Highlights For Products Offered Infographics PDF
This slide provides sales performance highlights in terms of net sales by business segment, geographic location and market maturity. It also covers sales performance of different brands with best selling and worst selling products. Deliver and pitch your topic in the best possible manner with this sales process catalogue template sales performance highlights for products offered infographics pdf. Use them to share invaluable insights on net sales by business segment, net sales by geographic region, net sales by market maturity and impress your audience. This template can be altered and modified as per your expectations. So, grab it now.
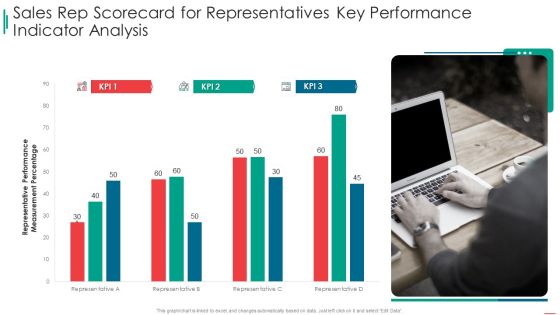
Sales Rep Scorecard Sales Rep Scorecard For Representatives Key Performance Indicator Analysis Portrait PDF
Deliver an awe inspiring pitch with this creative sales rep scorecard sales rep scorecard for representatives key performance indicator analysis portrait pdf bundle. Topics like sales rep scorecard for representatives key performance indicator analysis can be discussed with this completely editable template. It is available for immediate download depending on the needs and requirements of the user.

Key Practices To Create Sales Playbook Various Metrics To Track Sales Team Performance Ideas PDF
This slide provides information regarding various metrics catered to track sales team performance in terms of average revenue per account, win rate, NPS, along with sales representative performance tracking through number of opportunities created, lead response time, etc. Deliver and pitch your topic in the best possible manner with this key practices to create sales playbook various metrics to track sales team performance ideas pdf. Use them to share invaluable insights on sales representatives, opportunities created, lead response and impress your audience. This template can be altered and modified as per your expectations. So, grab it now.
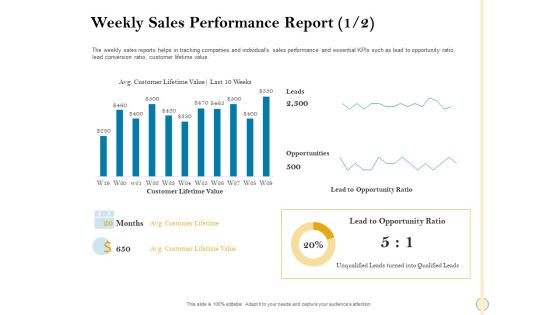
Sales Optimization Best Practices To Close More Deals Weekly Sales Performance Report Customer Clipart PDF
The weekly sales reports helps in tracking companies and individuals sales performance and essential KPIs such as lead to opportunity ratio, lead conversion ratio, customer lifetime value. Deliver and pitch your topic in the best possible manner with this sales optimization best practices to close more deals weekly sales performance report customer clipart pdf. Use them to share invaluable insights on weekly sales performance report and impress your audience. This template can be altered and modified as per your expectations. So, grab it now.

Sales Team Commission Sales Performance Monitoring Sheet Ppt Infographic Template Microsoft PDF
This slide illustrates sales team commission tracking sheet. It provides information about date, customer, order number, revenue, sales representative, commission rate, amount, deductions and payout. Showcasing this set of slides titled Sales Team Commission Sales Performance Monitoring Sheet Ppt Infographic Template Microsoft PDF. The topics addressed in these templates are Customer, Revenue, Sales Rep, Commission Amount. All the content presented in this PPT design is completely editable. Download it and make adjustments in color, background, font etc. as per your unique business setting.
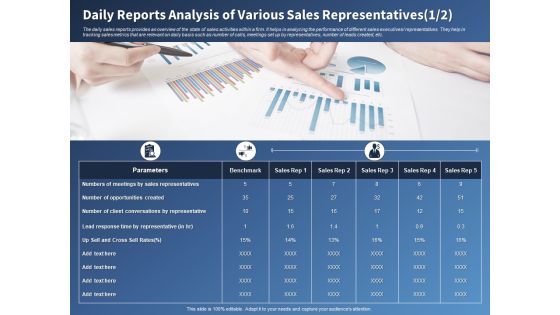
Performance Assessment Sales Initiative Report Daily Reports Analysis Of Various Sales Representatives Sample
Presenting this set of slides with name performance assessment sales initiative report daily reports analysis of various sales representatives sample. This is a three stage process. The stages in this process are sales, opportunities, conversations, representative, cross sell rates. This is a completely editable PowerPoint presentation and is available for immediate download. Download now and impress your audience.

B2B Sales Procedure Counselling Core Drivers Of Sales Performance Management Infographics PDF
This slide provides the glimpse about the core drivers of sales performance management plan which focuses on revenue model, process, talent, technology and measurements. Deliver an awe-inspiring pitch with this creative b2b sales procedure counselling core drivers of sales performance management infographics pdf bundle. Topics like revenue model, revenue process, talent, technology, measurement can be discussed with this completely editable template. It is available for immediate download depending on the needs and requirements of the user.

Performance Assessment Sales Initiative Report Sales Workforce Planning Ppt Show Background Designs PDF
Presenting this set of slides with name performance assessment sales initiative report sales workforce planning ppt show background designs pdf. The topics discussed in these slides are risk mitigation, training, knowledge, marketing, sales. This is a completely editable PowerPoint presentation and is available for immediate download. Download now and impress your audience.
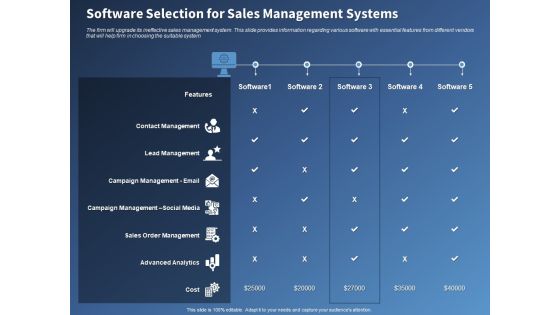
Performance Assessment Sales Initiative Report Software Selection For Sales Management Systems Download
Presenting this set of slides with name performance assessment sales initiative report software selection for sales management systems download. The topics discussed in these slides are management, campaign, analytics, social media, sales. This is a completely editable PowerPoint presentation and is available for immediate download. Download now and impress your audience.

Performance Assessment Sales Initiative Report Net Sales Business Segment Geographic Region Market Maturity Information
Presenting this set of slides with name performance assessment sales initiative report net sales business segment geographic region market maturity information. The topics discussed in these slides are business, segment, sales, geographic, market maturity. This is a completely editable PowerPoint presentation and is available for immediate download. Download now and impress your audience.
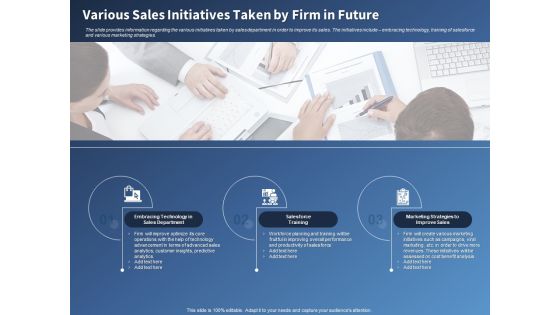
Performance Assessment Sales Initiative Report Various Sales Initiatives Taken By Firm In Future Inspiration
Presenting this set of slides with name performance assessment sales initiative report various sales initiatives taken by firm in future inspiration. This is a three stage process. The stages in this process are technology, sales, training, marketing, strategies. This is a completely editable PowerPoint presentation and is available for immediate download. Download now and impress your audience.

Determining Risks In Sales Administration Procedure Evaluating Projected Vs Actual Sales Performance Pictures PDF
The following slide depicts the evaluation of existing sales performance to set future standards and determine opportunities for improvement. It mainly includes key performance indicators KPIs such as pipeline, forecast, attainment, gap etc. Explore a selection of the finest Determining Risks In Sales Administration Procedure Evaluating Projected Vs Actual Sales Performance Pictures PDF here. With a plethora of professionally designed and pre made slide templates, you can quickly and easily find the right one for your upcoming presentation. You can use our Determining Risks In Sales Administration Procedure Evaluating Projected Vs Actual Sales Performance Pictures PDF to effectively convey your message to a wider audience. Slidegeeks has done a lot of research before preparing these presentation templates. The content can be personalized and the slides are highly editable. Grab templates today from Slidegeeks.
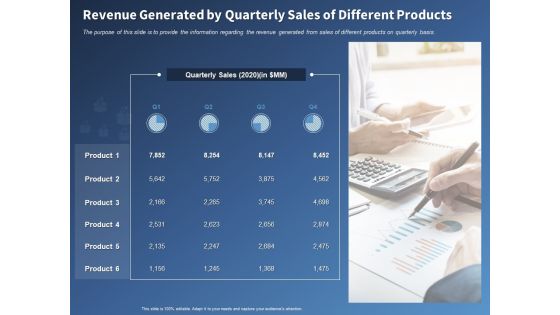
Performance Assessment Sales Initiative Report Revenue Generated By Quarterly Sales Of Different Products Diagrams
Presenting this set of slides with name performance assessment sales initiative report revenue generated by quarterly sales of different products diagrams. This is a four stage process. The stages in this process are revenue, generated, quarterly, sales, products. This is a completely editable PowerPoint presentation and is available for immediate download. Download now and impress your audience.

Performance Assessment Sales Initiative Report Current Sales Team Structure Ppt Professional Ideas PDF
Presenting this set of slides with name performance assessment sales initiative report current sales team structure ppt professional ideas pdf. This is a four stage process. The stages in this process are sales, business, supervisor, executive, logistics. This is a completely editable PowerPoint presentation and is available for immediate download. Download now and impress your audience.

Executing Sales Risk Reduction Plan Evaluating Projected Vs Actual Sales Performance Portrait PDF
The following slide depicts the evaluation of existing sales performance to set future standards and determine opportunities for improvement. It mainly includes key performance indicators KPIs such as pipeline, forecast, attainment, gap etc. There are so many reasons you need a Executing Sales Risk Reduction Plan Evaluating Projected Vs Actual Sales Performance Portrait PDF. The first reason is you can not spend time making everything from scratch, Thus, Slidegeeks has made presentation templates for you too. You can easily download these templates from our website easily.
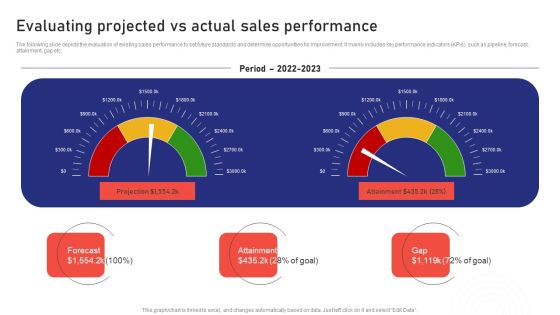
Sales Risk Assessment For Profit Maximization Evaluating Projected Vs Actual Sales Performance Portrait PDF
The following slide depicts the evaluation of existing sales performance to set future standards and determine opportunities for improvement. It mainly includes key performance indicators KPIs such as pipeline, forecast, attainment, gap etc. There are so many reasons you need a Sales Risk Assessment For Profit Maximization Evaluating Projected Vs Actual Sales Performance Portrait PDF. The first reason is you can not spend time making everything from scratch, Thus, Slidegeeks has made presentation templates for you too. You can easily download these templates from our website easily.

Sales Department Strategies Increase Revenues Weekly Sales Performance Report Leads Diagrams PDF
The weekly sales reports helps in tracking companies and individuals sales performance and essential KPIs such as lead to opportunity ratio, lead conversion ratio, customer lifetime value. Deliver and pitch your topic in the best possible manner with this sales department strategies increase revenues weekly sales performance report leads diagrams pdf. Use them to share invaluable insights on lead to opportunity ratio, customer lifetime value and impress your audience. This template can be altered and modified as per your expectations. So, grab it now.
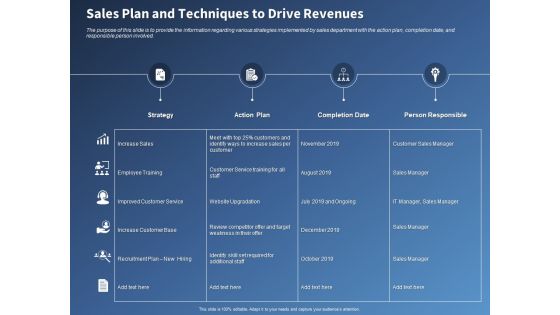
Performance Assessment Sales Initiative Report Sales Plan And Techniques To Drive Revenues Summary
Presenting this set of slides with name performance assessment sales initiative report sales plan and techniques to drive revenues summary. The topics discussed in these slides are strategy, action plan, completion date, person responsible . This is a completely editable PowerPoint presentation and is available for immediate download. Download now and impress your audience.

Performance Assessment Sales Initiative Report Sales Team Incentive Plan Reward System Microsoft
Presenting this set of slides with name performance assessment sales initiative report sales team incentive plan reward system microsoft. This is a three stage process. The stages in this process are stock options, profit sharing, staff recognition. This is a completely editable PowerPoint presentation and is available for immediate download. Download now and impress your audience.
Performance Assessment Sales Initiative Report Cost Associated To Sales Department Ppt Icon Brochure PDF
Presenting this set of slides with name performance assessment sales initiative report cost associated to sales department ppt icon brochure pdf. This is a four stage process. The stages in this process are base salaries, commission, software expenses, training expenses. This is a completely editable PowerPoint presentation and is available for immediate download. Download now and impress your audience.
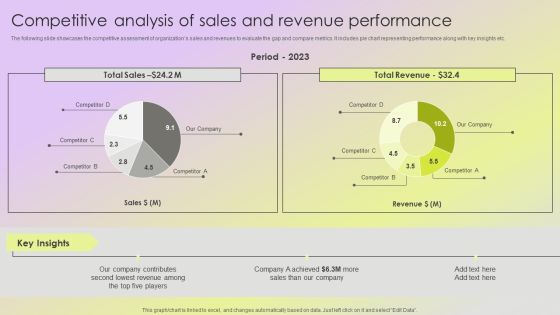
Mitigating Sales Risks With Strategic Action Planning Competitive Analysis Of Sales And Revenue Performance Slides PDF
The following slide showcases the competitive assessment of organizations sales and revenues to evaluate the gap and compare metrics. It includes pie chart representing performance along with key insights etc. Find a pre designed and impeccable Mitigating Sales Risks With Strategic Action Planning Competitive Analysis Of Sales And Revenue Performance Slides PDF. The templates can ace your presentation without additional effort. You can download these easy to edit presentation templates to make your presentation stand out from others. So, what are you waiting for Download the template from Slidegeeks today and give a unique touch to your presentation.
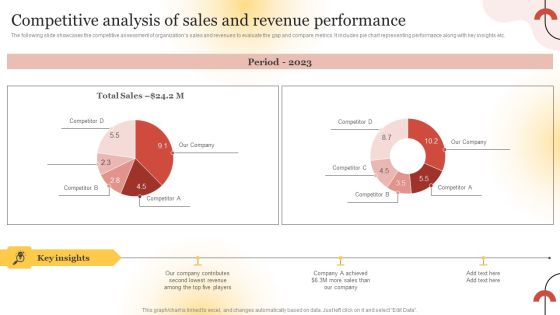
Executing Sales Risk Reduction Plan Competitive Analysis Of Sales And Revenue Performance Diagrams PDF
The following slide showcases the competitive assessment of organizations sales and revenues to evaluate the gap and compare metrics. It includes pie chart representing performance along with key insights etc. Take your projects to the next level with our ultimate collection of Executing Sales Risk Reduction Plan Competitive Analysis Of Sales And Revenue Performance Diagrams PDF. Slidegeeks has designed a range of layouts that are perfect for representing task or activity duration, keeping track of all your deadlines at a glance. Tailor these designs to your exact needs and give them a truly corporate look with your own brand colors they will make your projects stand out from the rest.

Executing Sales Risk Reduction Plan Defining Key Metrics To Analyse Current Sales Performance Diagrams PDF
The following slide showcases some metrics to evaluate existing sales performance due to execute effective risk management strategies. It includes elements such as opportunities, win rate, average time to win, average value per win, sales velocity etc. Do you know about Slidesgeeks Executing Sales Risk Reduction Plan Defining Key Metrics To Analyse Current Sales Performance Diagrams PDF These are perfect for delivering any kind od presentation. Using it, create PowerPoint presentations that communicate your ideas and engage audiences. Save time and effort by using our pre designed presentation templates that are perfect for a wide range of topic. Our vast selection of designs covers a range of styles, from creative to business, and are all highly customizable and easy to edit. Download as a PowerPoint template or use them as Google Slides themes.

Sales Risk Assessment For Profit Maximization Defining Key Metrics To Analyse Current Sales Performance Pictures PDF
The following slide showcases some metrics to evaluate existing sales performance due to execute effective risk management strategies. It includes elements such as opportunities, win rate, average time to win, average value per win, sales velocity etc. Want to ace your presentation in front of a live audience Our Sales Risk Assessment For Profit Maximization Defining Key Metrics To Analyse Current Sales Performance Pictures PDF can help you do that by engaging all the users towards you. Slidegeeks experts have put their efforts and expertise into creating these impeccable powerpoint presentations so that you can communicate your ideas clearly. Moreover, all the templates are customizable, and easy to edit and downloadable. Use these for both personal and commercial use.

Mitigating Sales Risks With Strategic Action Planning Evaluating Projected Vs Actual Sales Performance Download PDF
The following slide depicts the evaluation of existing sales performance to set future standards and determine opportunities for improvement. It mainly includes key performance indicators KPIs such as pipeline, forecast, attainment, gap etc. Explore a selection of the finest Mitigating Sales Risks With Strategic Action Planning Drafting Checklist For Each Critical Step Diagrams PDF here. With a plethora of professionally designed and pre made slide templates, you can quickly and easily find the right one for your upcoming presentation. You can use our Mitigating Sales Risks With Strategic Action Planning Drafting Checklist For Each Critical Step Diagrams PDF to effectively convey your message to a wider audience. Slidegeeks has done a lot of research before preparing these presentation templates. The content can be personalized and the slides are highly editable. Grab templates today from Slidegeeks.
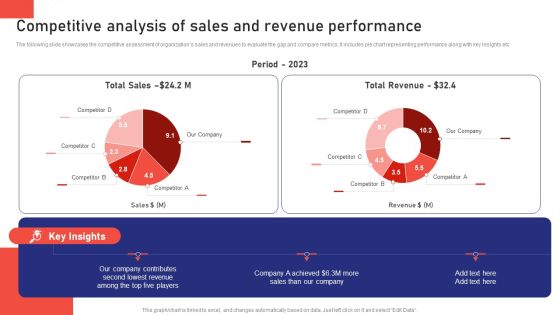
Sales Risk Assessment For Profit Maximization Competitive Analysis Of Sales And Revenue Performance Introduction PDF
The following slide showcases the competitive assessment of organizations sales and revenues to evaluate the gap and compare metrics. It includes pie chart representing performance along with key insights etc. Slidegeeks is one of the best resources for PowerPoint templates. You can download easily and regulate Sales Risk Assessment For Profit Maximization Competitive Analysis Of Sales And Revenue Performance Introduction PDF for your personal presentations from our wonderful collection. A few clicks is all it takes to discover and get the most relevant and appropriate templates. Use our Templates to add a unique zing and appeal to your presentation and meetings. All the slides are easy to edit and you can use them even for advertisement purposes.
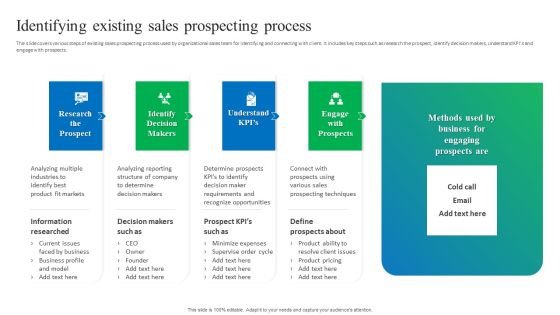
Process Enhancement Plan To Boost Sales Performance Identifying Existing Sales Prospecting Process Guidelines PDF
The slide covers various steps of existing sales prospecting process used by organizational sales team for identifying and connecting with client. It includes key steps such as research the prospect, identify decision makers, understand KPIs and engage with prospects. Retrieve professionally designed Process Enhancement Plan To Boost Sales Performance Identifying Existing Sales Prospecting Process Guidelines PDF to effectively convey your message and captivate your listeners. Save time by selecting pre made slideshows that are appropriate for various topics, from business to educational purposes. These themes come in many different styles, from creative to corporate, and all of them are easily adjustable and can be edited quickly. Access them as PowerPoint templates or as Google Slides themes. You do not have to go on a hunt for the perfect presentation because Slidegeeks got you covered from everywhere.
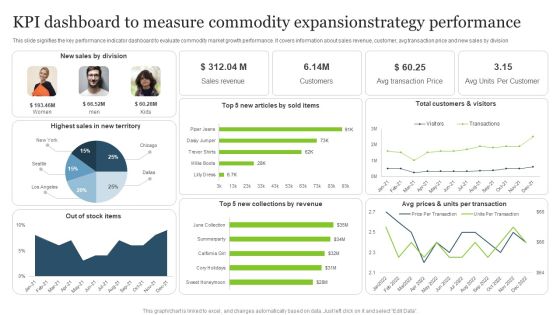
KPI Dashboard To Measure Commodity Expansionstrategy Performance Mockup PDF
This slide signifies the key performance indicator dashboard to evaluate commodity market growth performance. It covers information about sales revenue, customer, avg transaction price and new sales by division.Showcasing this set of slides titled KPI Dashboard To Measure Commodity Expansionstrategy Performance Mockup PDF. The topics addressed in these templates are Highest Sales, Sales Division, New Collections. All the content presented in this PPT design is completely editable. Download it and make adjustments in color, background, font etc. as per your unique business setting.

Loyalty Program Performance Dashboard Ppt PowerPoint Presentation Summary Grid
This is a loyalty program performance dashboard ppt powerpoint presentation summary grid. This is a six stage process. The stages in this process are average sale by loyalty member type, average award by customer, all orders by promotions, average sale by loyalty segment, sales by channel.

Business Performance Dashboard Brand Techniques Structure Introduction PDF
Following slide covers business performance dashboard of the firm. It include KPIs such as average weekly sales revenue, above sales target, sales revenue and profit generated. Deliver an awe inspiring pitch with this creative business performance dashboard brand techniques structure introduction pdf bundle. Topics like average, revenue, sales, profit, cost can be discussed with this completely editable template. It is available for immediate download depending on the needs and requirements of the user.

Brand Development Manual Business Performance KPI Dashboard Background PDF
Following slide covers business performance dashboard of the firm. It include KPIs such as average weekly sales revenue, above sales target, sales revenue and profit generated.Deliver an awe inspiring pitch with this creative Brand Development Manual Business Performance KPI Dashboard Background PDF bundle. Topics like Business Performance KPI Dashboard can be discussed with this completely editable template. It is available for immediate download depending on the needs and requirements of the user.

Deliver Efficiency Innovation Measuring Business Unit Performance Dashboard Background PDF
This slide covers dashboard that shows business unit performance such as new customers, average weekly sales revenue, sales revenues, profits, customer lifetime value, etc. Deliver an awe inspiring pitch with this creative Deliver Efficiency Innovation Measuring Business Unit Performance Dashboard Background PDF bundle. Topics like Customer Lifetime Value, Customer Acquisition Cost, Average Revenue Per Unit, Above Sales Target YTD can be discussed with this completely editable template. It is available for immediate download depending on the needs and requirements of the user.

Region Wise Stock Performance Management Dashboard Introduction PDF
This slide shows regional inventory performance management dashboard that give insights areas to be worked upon for increasing sales. It includes yearly growth rate, monthly sales trends and city wise sales trends etc. Pitch your topic with ease and precision using this Region Wise Stock Performance Management Dashboard Introduction PDF. This layout presents information on Stock Performance, Management Dashboard. It is also available for immediate download and adjustment. So, changes can be made in the color, design, graphics or any other component to create a unique layout.

Market Performance Monitoring Dashboard For Consumer Goods Microsoft PDF
This slide showcase the Performance Monitoring Dashboard for Consumer Goods providing information regarding the Overview of Food and Beverages Sales, Top Selling Products and On Shelf Availability.Deliver and pitch your topic in the best possible manner with this Market Performance Monitoring Dashboard For Consumer Goods Microsoft PDF. Use them to share invaluable insights on Sales Overview, Performance Subsegments, Beverage Products and impress your audience. This template can be altered and modified as per your expectations. So, grab it now.

New Commodity Market Viability Review Product Performance Dashboard Infographics PDF
The following slide displays the product performance dashboard as it highlights the top product by revenue, online vs. in store purchase, the sales by campaign Deliver an awe inspiring pitch with this creative New Commodity Market Viability Review Product Performance Dashboard Infographics PDF bundle. Topics like Online Purchase, Products Revenue, Sales Campaign can be discussed with this completely editable template. It is available for immediate download depending on the needs and requirements of the user.

Performance Monitoring Dashboard For Consumer Goods Ppt Professional Ideas PDF
This slide showcase the performance monitoring dashboard for consumer goods providing information regarding the overview of food and beverages sales, top selling products and on shelf availability. Deliver an awe inspiring pitch with this creative Performance Monitoring Dashboard For Consumer Goods Ppt Professional Ideas PDF bundle. Topics like Food And Beverages, Sales Overview, Top Food Beverages, Products can be discussed with this completely editable template. It is available for immediate download depending on the needs and requirements of the user.
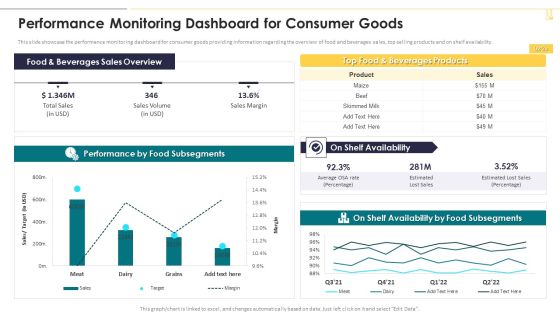
Performance Monitoring Dashboard For Consumer Goods Themes PDF
This slide showcase the performance monitoring dashboard for consumer goods providing information regarding the overview of food and beverages sales, top selling products and on shelf availability. Deliver an awe inspiring pitch with this creative Performance Monitoring Dashboard For Consumer Goods Themes PDF bundle. Topics like Beverages Sales Overview, Beverages Products, Availability can be discussed with this completely editable template. It is available for immediate download depending on the needs and requirements of the user.

Opportunity Analysis Dashboard Indicating Business Performance Information Rules PDF
This slide shows opportunity analysis dashboard indicating market performance which contains opportunity count by size, sales stage, region, revenue and average revenue. Pitch your topic with ease and precision using this Opportunity Analysis Dashboard Indicating Business Performance Information Rules PDF. This layout presents information on Opportunity Count, Revenue, Sales. It is also available for immediate download and adjustment. So, changes can be made in the color, design, graphics or any other component to create a unique layout.
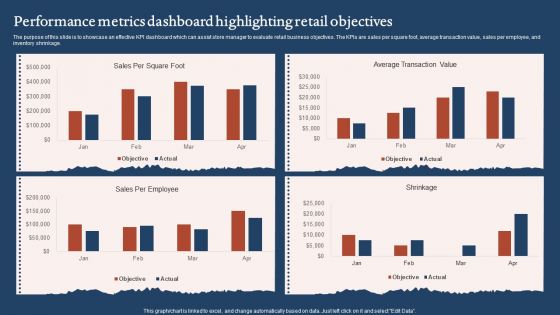
Performance Metrics Dashboard Highlighting Retail Objectives Sample PDF
The purpose of this slide is to showcase an effective KPI dashboard which can assist store manager to evaluate retail business objectives. The KPIs are sales per square foot, average transaction value, sales per employee, and inventory shrinkage. Pitch your topic with ease and precision using this Performance Metrics Dashboard Highlighting Retail Objectives Sample PDF. This layout presents information on Average Transaction Value, Sales Per Employee. It is also available for immediate download and adjustment. So, changes can be made in the color, design, graphics or any other component to create a unique layout.

Business Key Performance Metrics Review Dashboard Portrait PDF
The following slide shows a dashboard of sales strategy review of firm that can be used by marketing, product, finance managers for reviewing the business. It further includes KPI that are revenue, new customer, gross profit purchaser satisfaction, income comparison, sales categories and profitability. Showcasing this set of slides titled Business Key Performance Metrics Review Dashboard Portrait PDF. The topics addressed in these templates are Sales, Revenue Comparison, Profitability. All the content presented in this PPT design is completely editable. Download it and make adjustments in color, background, font etc. as per your unique business setting.
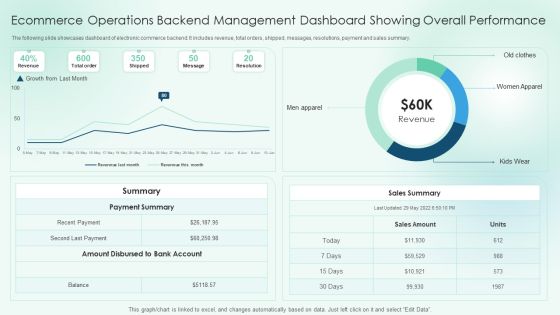
Ecommerce Operations Backend Management Dashboard Showing Overall Performance Slides PDF
The following slide showcases dashboard of electronic commerce backend. It includes revenue, total orders, shipped, messages, resolutions, payment and sales summary.Pitch your topic with ease and precision using this Ecommerce Operations Backend Management Dashboard Showing Overall Performance Slides PDF. This layout presents information on Payment Summary, Amount Disbursed, Sales Summary. It is also available for immediate download and adjustment. So, changes can be made in the color, design, graphics or any other component to create a unique layout.

Yearly Business Performance Assessment And Evaluation Dashboard Structure PDF
This slide contains annual business review of a company. It includes revenue comparison, sales assessment and profitability representation. Showcasing this set of slides titled Yearly Business Performance Assessment And Evaluation Dashboard Structure PDF. The topics addressed in these templates are Revenue Comparison, Sales, Profitability. All the content presented in this PPT design is completely editable. Download it and make adjustments in color, background, font etc. as per your unique business setting.

Accounting KPI Dashboard To Control System Financial Performance Formats PDF
The following slide showcases model for enabling control of accounts. It presents information related to long term planning, investment plans, profit estimated, etc. Pitch your topic with ease and precision using this Accounting KPI Dashboard To Control System Financial Performance Formats PDF. This layout presents information on Sales Outstanding, Payable Outstanding, Sales Inventory. It is also available for immediate download and adjustment. So, changes can be made in the color, design, graphics or any other component to create a unique layout.

Brand Performance Dashboard Ppt PowerPoint Presentation Professional Grid
This is a brand performance dashboard ppt powerpoint presentation professional grid. This is a three stage process. The stages in this process are customer recognition, enhanced sales, competitive edge, dashboard, business.

Brand Performance Dashboard Ppt PowerPoint Presentation Layouts Summary
This is a brand performance dashboard ppt powerpoint presentation layouts summary. This is a three stage process. The stages in this process are customer recognition, enhanced sales, competitive edge, dashboard, business.

Brand Performance Dashboard Ppt PowerPoint Presentation Show Graphic Tips
This is a brand performance dashboard ppt powerpoint presentation show graphic tips. This is a three stage process. The stages in this process are customer recognition, enhanced sales, competitive edge, dashboard, business, percentage.
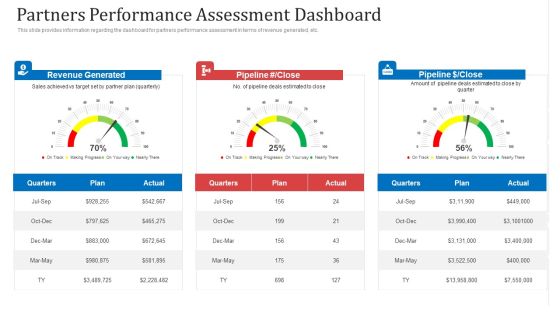
Partners Performance Assessment Dashboard Ppt File Format PDF
This slide provides information regarding the dashboard for partners performance assessment in terms of revenue generated, etc. Deliver an awe inspiring pitch with this creative partners performance assessment dashboard ppt file format pdf bundle. Topics like revenue generated, plan, sales can be discussed with this completely editable template. It is available for immediate download depending on the needs and requirements of the user.

Brand Performance Dashboard Ppt PowerPoint Presentation Infographics Shapes
This is a brand performance dashboard ppt powerpoint presentation infographics shapes. This is a three stage process. The stages in this process are customer recognition, enhanced sales, competitive edge.

Brand Performance Dashboard Ppt PowerPoint Presentation Infographic Template Designs
This is a brand performance dashboard ppt powerpoint presentation infographic template designs. This is a three stage process. The stages in this process are customer recognition, enhanced sales, competitive edge.

Brand Performance Dashboard Ppt PowerPoint Presentation Icon Microsoft
This is a brand performance dashboard ppt powerpoint presentation icon microsoft. This is a three stage process. The stages in this process are customer recognition, enhanced sales, competitive edge.
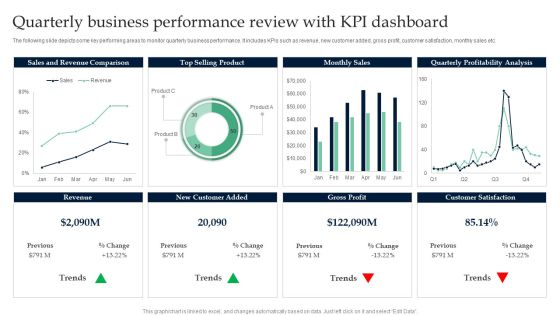
Quarterly Business Performance Review With KPI Dashboard Infographics PDF
Pitch your topic with ease and precision using this Quarterly Business Performance Review With KPI Dashboard Infographics PDF. This layout presents information on Sales And Revenue Comparison, Top Selling Product. It is also available for immediate download and adjustment. So, changes can be made in the color, design, graphics or any other component to create a unique layout.

KPI Dashboard To Measure Overall Business Performance Themes PDF
Deliver and pitch your topic in the best possible manner with this KPI Dashboard To Measure Overall Business Performance Themes PDF. Use them to share invaluable insights on Sales Comparison, Product Category, Brand Profitability and impress your audience. This template can be altered and modified as per your expectations. So, grab it now.

 Home
Home