Sales Performance Dashboard
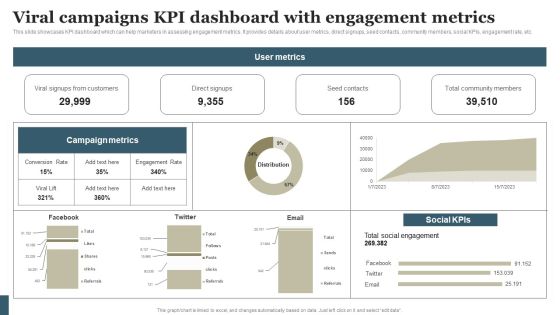
Viral Marketing Techniques To Increase Annual Business Sales Viral Campaigns KPI Dashboard With Engagement Guidelines PDF
This slide showcases KPI dashboard which can help marketers in assessing engagement metrics. It provides details about user metrics, direct signups, seed contacts, community members, social KPIs, engagement rate, etc. Present like a pro with Viral Marketing Techniques To Increase Annual Business Sales Viral Campaigns KPI Dashboard With Engagement Guidelines PDF Create beautiful presentations together with your team, using our easy-to-use presentation slides. Share your ideas in real-time and make changes on the fly by downloading our templates. So whether you are in the office, on the go, or in a remote location, you can stay in sync with your team and present your ideas with confidence. With Slidegeeks presentation got a whole lot easier. Grab these presentations today.
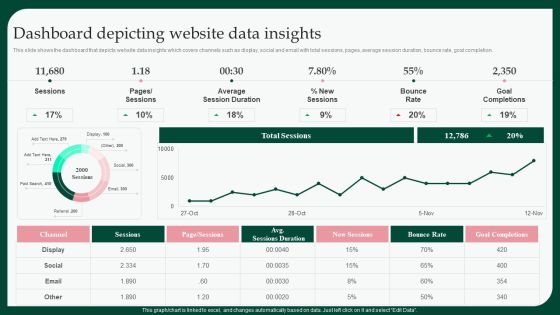
Boosting Product Sales Through Branding Dashboard Depicting Website Data Brochure PDF
This slide shows the dashboard that depicts website data insights which covers channels such as display, social and email with total sessions, pages, average session duration, bounce rate, goal completion. Coming up with a presentation necessitates that the majority of the effort goes into the content and the message you intend to convey. The visuals of a PowerPoint presentation can only be effective if it supplements and supports the story that is being told. Keeping this in mind our experts created Boosting Product Sales Through Branding Dashboard Depicting Website Data Brochure PDF to reduce the time that goes into designing the presentation. This way, you can concentrate on the message while our designers take care of providing you with the right template for the situation.
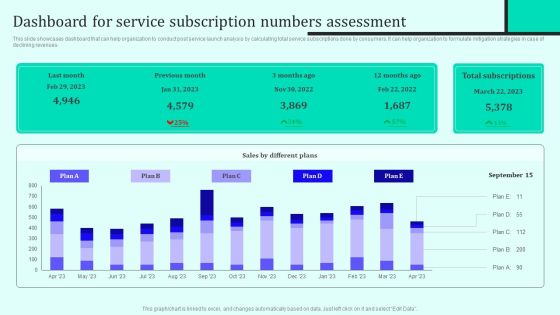
Implementing New Sales And Marketing Process For Services Dashboard For Service Subscription Diagrams PDF
This slide showcases dashboard that can help organization to conduct post service launch analysis by calculating total service subscriptions done by consumers. It can help organization to formulate mitigation strategies in case of declining revenues. Boost your pitch with our creative Implementing New Sales And Marketing Process For Services Dashboard For Service Subscription Diagrams PDF. Deliver an awe inspiring pitch that will mesmerize everyone. Using these presentation templates you will surely catch everyones attention. You can browse the ppts collection on our website. We have researchers who are experts at creating the right content for the templates. So you do not have to invest time in any additional work. Just grab the template now and use them.

Dashboard For Tracking And Measuring Business Sales And Revenue Ppt PowerPoint Presentation Slides Introduction PDF
Showcasing this set of slides titled dashboard for tracking and measuring business sales and revenue ppt powerpoint presentation slides introduction pdf. The topics addressed in these templates are revenue by pipeline jun 2020, new deals by month this year 2020, forecast june 2020, revenue goal attainment by owner jun 2020, revenue goal attainment jun 2020, pipeline coverage jul 2020. All the content presented in this PPT design is completely editable. Download it and make adjustments in color, background, font etc. as per your unique business setting.

Business Sales Optimization Advertisement Campaign Social Media Advertisement Campaign Dashboard Graphics PDF
This slide showcases a dashboard depicting key metrics tracked for social media advertising campaigns. The metrics covered are spent this month, conversion, cost per conversion, sessions, etc. This modern and well arranged Business Sales Optimization Advertisement Campaign Social Media Advertisement Campaign Dashboard Graphics PDF provides lots of creative possibilities. It is very simple to customize and edit with the Powerpoint Software. Just drag and drop your pictures into the shapes. All facets of this template can be edited with Powerpoint no extra software is necessary. Add your own material, put your images in the places assigned for them, adjust the colors, and then you can show your slides to the world, with an animated slide included.

Dashboard Showcasing Impact Of Real Time Marketing On Sales Ppt Gallery Design Templates PDF
The following slide depicts results of real time marketing . It includes elements such as sales metrics, subscribers, SMS sent, clicks, click through rate CTR, average order value, conversion rate, return on investment ROI etc. This modern and well-arranged Dashboard Showcasing Impact Of Real Time Marketing On Sales Ppt Gallery Design Templates PDF provides lots of creative possibilities. It is very simple to customize and edit with the Powerpoint Software. Just drag and drop your pictures into the shapes. All facets of this template can be edited with Powerpoint, no extra software is necessary. Add your own material, put your images in the places assigned for them, adjust the colors, and then you can show your slides to the world, with an animated slide included.
Analyze Data For Campaign Performance Ppt Icon
This is a analyze data for campaign performance ppt icon. This is a two stage process. The stages in this process are brand, leads, sales, loyalty.

Campaign Performance Report Sample Example Ppt Presentation
This is a campaign performance report sample example ppt presentation. This is a four stage process. The stages in this process are brand, leads, sales, loyalty.
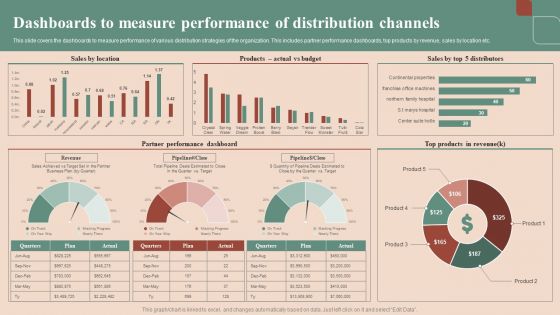
Maximizing Profit Returns With Right Distribution Source Dashboards To Measure Performance Of Distribution Channels Microsoft PDF
This slide covers the dashboards to measure performance of various distribution strategies of the organization. This includes partner performance dashboards, top products by revenue, sales by location etc. Slidegeeks is here to make your presentations a breeze with Maximizing Profit Returns With Right Distribution Source Dashboards To Measure Performance Of Distribution Channels Microsoft PDF With our easy-to-use and customizable templates, you can focus on delivering your ideas rather than worrying about formatting. With a variety of designs to choose from, youre sure to find one that suits your needs. And with animations and unique photos, illustrations, and fonts, you can make your presentation pop. So whether youre giving a sales pitch or presenting to the board, make sure to check out Slidegeeks first.
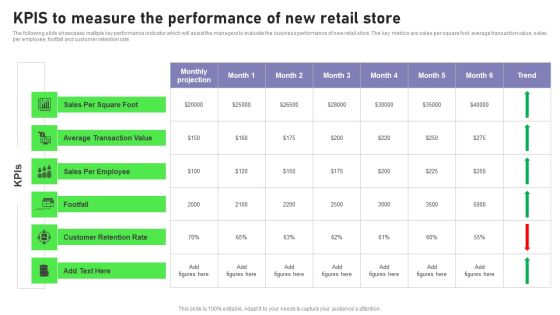
Retail Outlet Opening To Enhance Product Sale Kpis To Measure The Performance Infographics PDF
The following slide showcases multiple key performance indicator which will assist the managers to evaluate the business performance of new retail store. The key metrics are sales per square foot, average transaction value, sales per employee, footfall and customer retention rate. Slidegeeks is here to make your presentations a breeze with Retail Outlet Opening To Enhance Product Sale Kpis To Measure The Performance Infographics PDF With our easy to use and customizable templates, you can focus on delivering your ideas rather than worrying about formatting. With a variety of designs to choose from, you are sure to find one that suits your needs. And with animations and unique photos, illustrations, and fonts, you can make your presentation pop. So whether you are giving a sales pitch or presenting to the board, make sure to check out Slidegeeks first.

Implementing Effective Distribution Dashboards To Measure Performance Of Distribution Portrait PDF
This slide covers the dashboards to measure performance of various distribution strategies of the organization. This includes partner performance dashboards, top products by revenue, sales by location etc. Crafting an eye-catching presentation has never been more straightforward. Let your presentation shine with this tasteful yet straightforward Implementing Effective Distribution Dashboards To Measure Performance Of Distribution Portrait PDF template. It offers a minimalistic and classy look that is great for making a statement. The colors have been employed intelligently to add a bit of playfulness while still remaining professional. Construct the ideal Implementing Effective Distribution Dashboards To Measure Performance Of Distribution Portrait PDF that effortlessly grabs the attention of your audience Begin now and be certain to wow your customers
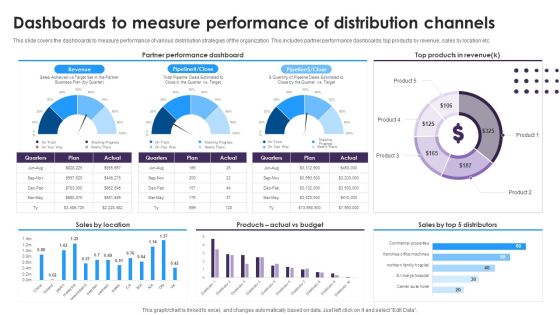
Omnichannel Distribution System To Satisfy Customer Needs Dashboards To Measure Performance Of Distribution Channels Brochure PDF
This slide covers the dashboards to measure performance of various distribution strategies of the organization. This includes partner performance dashboards, top products by revenue, sales by location etc. Present like a pro with Omnichannel Distribution System To Satisfy Customer Needs Dashboards To Measure Performance Of Distribution Channels Brochure PDF Create beautiful presentations together with your team, using our easy-to-use presentation slides. Share your ideas in real-time and make changes on the fly by downloading our templates. So whether you are in the office, on the go, or in a remote location, you can stay in sync with your team and present your ideas with confidence. With Slidegeeks presentation got a whole lot easier. Grab these presentations today.
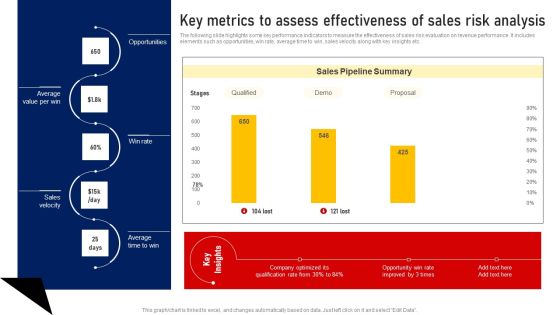
Performing Sales Risk Analysis Procedure Key Metrics To Assess Effectiveness Of Sales Risk Analysis Brochure PDF
The following slide highlights some key performance indicators to measure the effectiveness of sales risk evaluation on revenue performance. It includes elements such as opportunities, win rate, average time to win, sales velocity along with key insights etc. Get a simple yet stunning designed Performing Sales Risk Analysis Procedure Key Metrics To Assess Effectiveness Of Sales Risk Analysis Brochure PDF. It is the best one to establish the tone in your meetings. It is an excellent way to make your presentations highly effective. So, download this PPT today from Slidegeeks and see the positive impacts. Our easy to edit Performing Sales Risk Analysis Procedure Key Metrics To Assess Effectiveness Of Sales Risk Analysis Brochure PDF can be your go to option for all upcoming conferences and meetings. So, what are you waiting for Grab this template today.
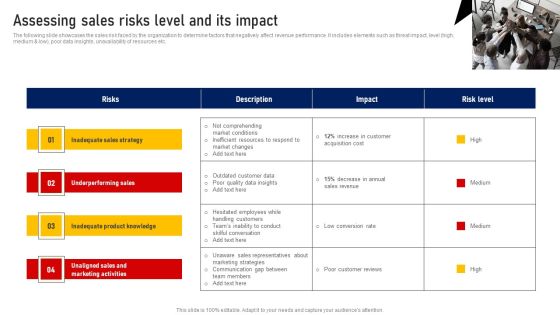
Performing Sales Risk Analysis Procedure Assessing Sales Risks Level And Its Impact Clipart PDF
The following slide showcases the sales risk faced by the organization to determine factors that negatively affect revenue performance. It includes elements such as threat impact, level high, medium and low, poor data insights, unavailability of resources etc. Do you have to make sure that everyone on your team knows about any specific topic I yes, then you should give Performing Sales Risk Analysis Procedure Assessing Sales Risks Level And Its Impact Clipart PDF a try. Our experts have put a lot of knowledge and effort into creating this impeccable Performing Sales Risk Analysis Procedure Assessing Sales Risks Level And Its Impact Clipart PDF. You can use this template for your upcoming presentations, as the slides are perfect to represent even the tiniest detail. You can download these templates from the Slidegeeks website and these are easy to edit. So grab these today.
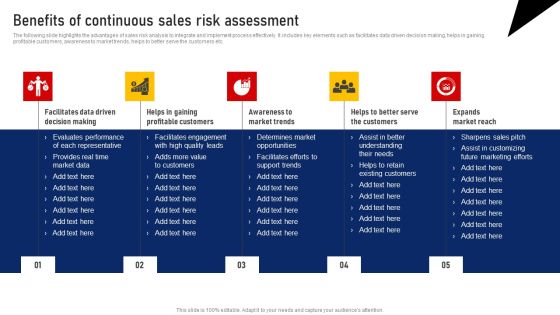
Performing Sales Risk Analysis Procedure Benefits Of Continuous Sales Risk Assessment Structure PDF
The following slide highlights the advantages of sales risk analysis to integrate and implement process effectively. It includes key elements such as facilitates data driven decision making, helps in gaining profitable customers, awareness to market trends, helps to better serve the customers etc. Are you in need of a template that can accommodate all of your creative concepts This one is crafted professionally and can be altered to fit any style. Use it with Google Slides or PowerPoint. Include striking photographs, symbols, depictions, and other visuals. Fill, move around, or remove text boxes as desired. Test out color palettes and font mixtures. Edit and save your work, or work with colleagues. Download Performing Sales Risk Analysis Procedure Benefits Of Continuous Sales Risk Assessment Structure PDF and observe how to make your presentation outstanding. Give an impeccable presentation to your group and make your presentation unforgettable.
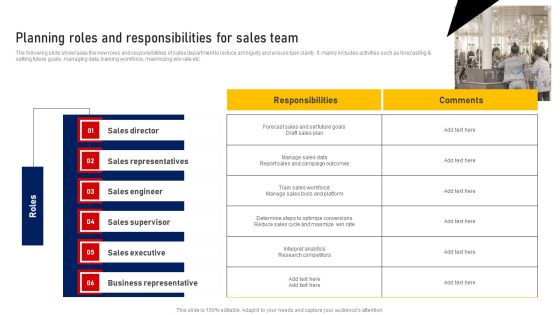
Performing Sales Risk Analysis Procedure Planning Roles And Responsibilities For Sales Team Information PDF
The following slide showcases the new roles and responsibilities of sales department to reduce ambiguity and ensure task clarity. It mainly includes activities such as forecasting and setting future goals, managing data, training workforce, maximizing win rate etc. This modern and well arranged Performing Sales Risk Analysis Procedure Planning Roles And Responsibilities For Sales Team Information PDF provides lots of creative possibilities. It is very simple to customize and edit with the Powerpoint Software. Just drag and drop your pictures into the shapes. All facets of this template can be edited with Powerpoint no extra software is necessary. Add your own material, put your images in the places assigned for them, adjust the colors, and then you can show your slides to the world, with an animated slide included.

Sales Report Sales PowerPoint Backgrounds And Templates 0111
Microsoft PowerPoint Template and Background with a manila merchandise folder laying next to a cup of coffee and office supplies
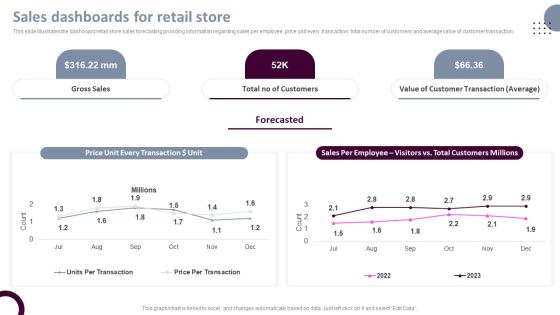
Retail Store Operations Sales Dashboards For Retail Store Structure PDF
This slide illustrates the dashboard retail store sales forecasting providing information regarding sales per employee, price unit every transaction, total number of customers and average value of customer transaction. Coming up with a presentation necessitates that the majority of the effort goes into the content and the message you intend to convey. The visuals of a PowerPoint presentation can only be effective if it supplements and supports the story that is being told. Keeping this in mind our experts created Retail Store Operations Sales Dashboards For Retail Store Structure PDF to reduce the time that goes into designing the presentation. This way, you can concentrate on the message while our designers take care of providing you with the right template for the situation.
Enterprise Management Business Management Dashboards Sales Icons PDF
Deliver and pitch your topic in the best possible manner with this enterprise management business management dashboards sales icons pdf. Use them to share invaluable insights on revenue, customers by region, new customers signups, sales by product category, profit margin and impress your audience. This template can be altered and modified as per your expectations. So, grab it now.

Corporate Governance Business Management Dashboards Sales Demonstration PDF
Deliver an awe inspiring pitch with this creative corporate governance business management dashboards sales demonstration pdf bundle. Topics like new customers signups, customers by region, sales by product category can be discussed with this completely editable template. It is available for immediate download depending on the needs and requirements of the user.

Business Management Dashboards Sales Ppt Infographics Graphics Design PDF
Deliver and pitch your topic in the best possible manner with this business management dashboards sales ppt infographics graphics design pdf. Use them to share invaluable insights on value, customer, revenue and impress your audience. This template can be altered and modified as per your expectations. So, grab it now.

Analysis Techniques For Sales Growth Sales Target Metrics Pictures PDF
This slide presents multiple techniques to analyse Sales Target Metrics for sales growth helpful to investigate underlying data and look for efficiencies. It includes methods such as net working capital, sales growth, affordable growth rate and break even percentage that can prove to be highly effective. Presenting Analysis Techniques For Sales Growth Sales Target Metrics Pictures PDF to dispense important information. This template comprises four stages. It also presents valuable insights into the topics including Net Working Capital, Affordable Growth Rate, Break Even Percentage. This is a completely customizable PowerPoint theme that can be put to use immediately. So, download it and address the topic impactfully.
Sales Management Pipeline For Effective Lead Generation Sales Pipeline Tracking And Reporting Introduction PDF
This slide shows dashboard to track the performance of sales pipeline. Major points covered under this are number of opportunities, conversion rate, win rate, opportunity status etc. Deliver an awe inspiring pitch with this creative Sales Management Pipeline For Effective Lead Generation Sales Pipeline Tracking And Reporting Introduction PDF bundle. Topics like Opportunities, Resources, Probability can be discussed with this completely editable template. It is available for immediate download depending on the needs and requirements of the user.

Loyalty Program Performance Ppt PowerPoint Presentation Tips
This is a loyalty program performance ppt powerpoint presentation tips. This is a four stage process. The stages in this process are enrollments, reward outstanding, loyalty revenue, gift sales.

Monetary Planning And Evaluation Guide Performance KPI Dashboard To Measure Financial Position Of Organization Ppt File Slides PDF
The following slide outlines a comprehensive key performance indicator KPI dashboard highlighting different financial metrics. The KPIs are quick and current ratio, cash balance, days sales outstanding etc. The best PPT templates are a great way to save time, energy, and resources. Slidegeeks have 100 percent editable powerpoint slides making them incredibly versatile. With these quality presentation templates, you can create a captivating and memorable presentation by combining visually appealing slides and effectively communicating your message. Download Monetary Planning And Evaluation Guide Performance KPI Dashboard To Measure Financial Position Of Organization Ppt File Slides PDF from Slidegeeks and deliver a wonderful presentation.
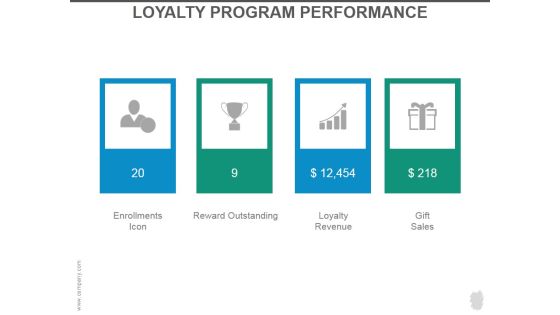
Loyalty Program Performance Ppt PowerPoint Presentation Slides
This is a loyalty program performance ppt powerpoint presentation slides. This is a four stage process. The stages in this process are enrollments icon, reward outstanding, loyalty revenue, gift sales.

Loyalty Program Performance Ppt PowerPoint Presentation Introduction
This is a loyalty program performance ppt powerpoint presentation introduction. This is a four stage process. The stages in this process are enrollments icon, reward outstanding, loyalty revenue, gift sales.
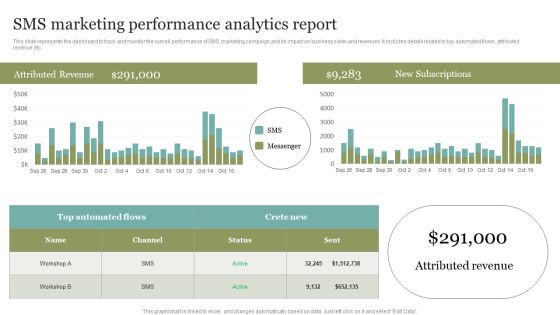
SMS Marketing Performance Analytics Report Summary PDF
This slide represents the dashboard to track and monitor the overall performance of SMS marketing campaign and its impact on business sales and revenues. It includes details related to top automated flows, attributed revenue etc. This SMS Marketing Performance Analytics Report Summary PDF from Slidegeeks makes it easy to present information on your topic with precision. It provides customization options, so you can make changes to the colors, design, graphics, or any other component to create a unique layout. It is also available for immediate download, so you can begin using it right away. Slidegeeks has done good research to ensure that you have everything you need to make your presentation stand out. Make a name out there for a brilliant performance.

States Performance Analysis Good Ppt Example
This is a states performance analysis good ppt example. This is a four stage process. The stages in this process are strategy and states performance analysis, sales activity reports, solution design education, customer interaction.

Acquiring Clients Through Search Engine And Native Ads Dashboard To Track Website Traffic During Performance Icons PDF
This slide showcases dashboard that can help marketers to track the website traffic during execution of performance marketing activities. Its key elements are organic sessions, organic page views, inorganic sessions by month etc. Slidegeeks is here to make your presentations a breeze with Acquiring Clients Through Search Engine And Native Ads Dashboard To Track Website Traffic During Performance Icons PDF With our easy to use and customizable templates, you can focus on delivering your ideas rather than worrying about formatting. With a variety of designs to choose from, you are sure to find one that suits your needs. And with animations and unique photos, illustrations, and fonts, you can make your presentation pop. So whether you are giving a sales pitch or presenting to the board, make sure to check out Slidegeeks first.
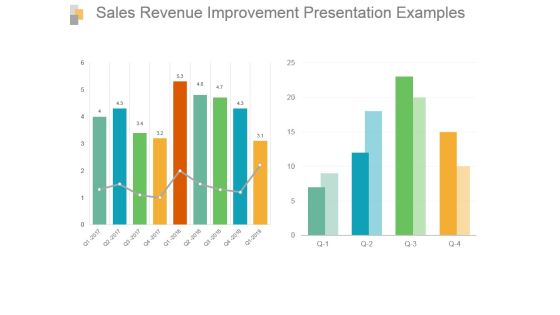
Sales Revenue Improvement Presentation Examples
This is a sales revenue improvement presentation examples. This is a two stage process. The stages in this process are bar graph, growth, sales, data, analysis.

Corporate Governance Sales Template PDF
Presenting corporate governance sales template pdf to provide visual cues and insights. Share and navigate important information on three stages that need your due attention. This template can be used to pitch topics like company sales forecast, company sales report, company sales graph. In addtion, this PPT design contains high resolution images, graphics, etc, that are easily editable and available for immediate download.

Sales Order Processing Powerpoint Slide
This is a sales order processing powerpoint slide. This is a six stage process. The stages in this process are pick and choose report writer, mobile field service, sales order processing, job costing, service management and dispatch, accounting and payroll.
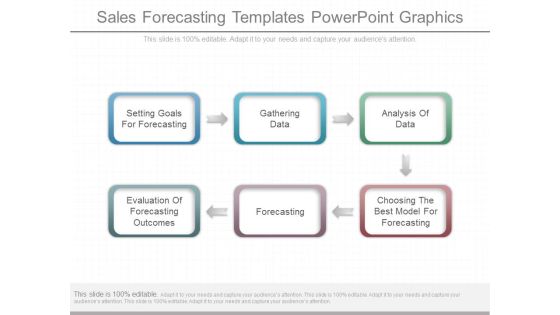
Sales Forecasting Templates Powerpoint Graphics
This is a sales forecasting templates powerpoint graphics. This is a six stage process. The stages in this process are setting goals for forecasting, gathering data, analysis of data, evaluation of forecasting outcomes, forecasting, choosing the best model for forecasting.
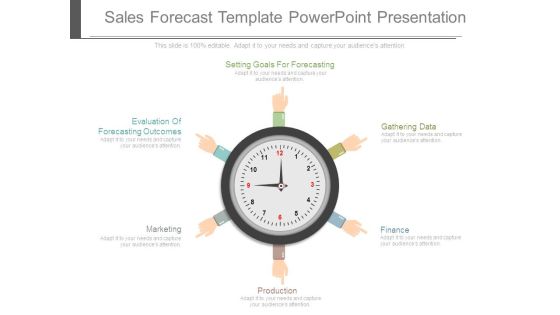
Sales Forecast Template Powerpoint Presentation
This is a sales forecast template powerpoint presentation. This is a six stage process. The stages in this process are setting goals for forecasting, gathering data, finance, production, marketing, evaluation of forecasting outcomes.

Social Media Engagement Performance Network Introduction PDF
This slide provides information regarding the dashboard that contains various performance indicators that are measured to determine engagement performance. Deliver an awe inspiring pitch with this creative social media engagement performance network introduction pdf bundle. Topics like purchase, social metrics, network, customers can be discussed with this completely editable template. It is available for immediate download depending on the needs and requirements of the user.

Implementing Marketing Mix Strategy To Enhance Overall Performance Social Media Dashboard To Understand Marketing Efforts Guidelines PDF
The following dashboard helps the organization in analyzing the key metrics to track performance of their social media digital marketing strategy, these metrics are followers, likes and visits. Deliver and pitch your topic in the best possible manner with this Implementing Marketing Mix Strategy To Enhance Overall Performance Social Media Dashboard To Understand Marketing Efforts Guidelines PDF. Use them to share invaluable insights on Sales, New Customer, New Revenue and impress your audience. This template can be altered and modified as per your expectations. So, grab it now.

Operational Dashboard Powerpoint Images
This is a operational dashboard powerpoint images. This is a four stage process. The stages in this process are cash and equivalents, revenue and expenses actual and forecast, store sales vs budget, expenses actual budget forecast.

Sales Procedure Automation To Enhance Sales Choosing Best CRM System To Improve Sales Diagrams PDF
This slide shows the comparison of customer relationship management on the basis of features such as phone support, live chat, custom dashboards, automated responses, round the clock support, etc.Deliver an awe inspiring pitch with this creative Sales Procedure Automation To Enhance Sales Choosing Best CRM System To Improve Sales Diagrams PDF bundle. Topics like Custom Dashboards, Automated Responses, Phone Support can be discussed with this completely editable template. It is available for immediate download depending on the needs and requirements of the user.

Strategies For Smooth Sales Pipeline Management Sales Funnel Management Strategies To Increase Sales Inspiration PDF
This slide shows the major strategies for the smooth sales process, Key strategies included in this are use CRM system, standardized sales process, up to date pipeline etc.Presenting Strategies For Smooth Sales Pipeline Management Sales Funnel Management Strategies To Increase Sales Inspiration PDF to provide visual cues and insights. Share and navigate important information on seven stages that need your due attention. This template can be used to pitch topics like Management Techniques, Maintain Consistent, Understand Metrics. In addtion, this PPT design contains high resolution images, graphics, etc, that are easily editable and available for immediate download.

Ecommerce Website Performance Gap Assessment Information PDF
This slide represents the performance gap analysis of an ecommerce website. The purpose of this slide is to demonstrate the various key performance indicators used in website performance. The key components include sales, signups or leads, visit to signup rate, bounce rate, and unique visitors. Pitch your topic with ease and precision using this Ecommerce Website Performance Gap Assessment Information PDF. This layout presents information on Navigation System, Performance, Bounce Rate. It is also available for immediate download and adjustment. So, changes can be made in the color, design, graphics or any other component to create a unique layout.

Agenda Performing Sales Risk Analysis Procedure Infographics PDF
Find a pre designed and impeccable Agenda Performing Sales Risk Analysis Procedure Infographics PDF. The templates can ace your presentation without additional effort. You can download these easy to edit presentation templates to make your presentation stand out from others. So, what are you waiting for Download the template from Slidegeeks today and give a unique touch to your presentation.
Sales Process Management To Boost Business Effectiveness Sales Pipeline Tracking And Reporting Introduction PDF
This slide shows dashboard to track the performance of sales pipeline. Major points covered under this are number of opportunities, conversion rate, win rate, opportunity status etc. Deliver and pitch your topic in the best possible manner with this Sales Process Management To Boost Business Effectiveness Sales Pipeline Tracking And Reporting Introduction PDF. Use them to share invaluable insights on Return On Investment, Investment Review, Average Length and impress your audience. This template can be altered and modified as per your expectations. So, grab it now.

Client Attrition Performance Administration Kpis Topics PDF
This slide shows various KPI to manage and track customer performance. It includes customer attrition rate, retention rate, repeat customer rate, purchase frequency, etc. Pitch your topic with ease and precision using this Client Attrition Performance Administration Kpis Topics PDF. This layout presents information on Customer Retention Rate, Repeat Customer Rate, Purchase Frequency. It is also available for immediate download and adjustment. So, changes can be made in the color, design, graphics or any other component to create a unique layout.

Performance Objectives Ppt PowerPoint Presentation Infographics Themes
Presenting this set of slides with name performance objectives ppt powerpoint presentation infographics themes. This is a three stage process. The stages in this process are fixed asset turnover, total asset turnover, working capital turnover. This is a completely editable PowerPoint presentation and is available for immediate download. Download now and impress your audience.
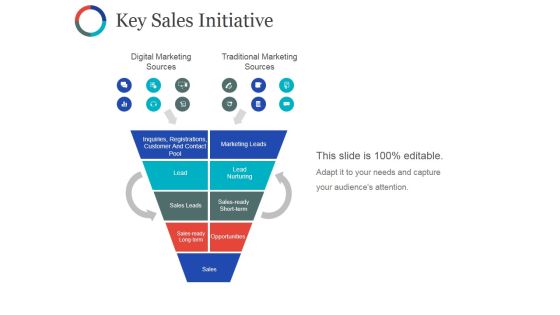
Key Sales Initiative Ppt PowerPoint Presentation Infographics Show
This is a key sales initiative ppt powerpoint presentation infographics show. This is a five stage process. The stages in this process are digital marketing sources, traditional marketing sources, lead, lead nurturing, sales leads.

Content Marketing Performance Template 1 Ppt PowerPoint Presentation Styles Infographics
This is a content marketing performance template 1 ppt powerpoint presentation styles infographics. This is a eight stage process. The stages in this process are conversion rate, quality of leads, number of leads, sales revenue, website traffic, subscriber list growth, social media sharing, search engine ranking.

Sales Opportunity Metrics Template Presentation Design
This is a sales opportunity metrics template presentation design. This is a three stage process. The stages in this process are sales status, sales opportunities, sales product performance.
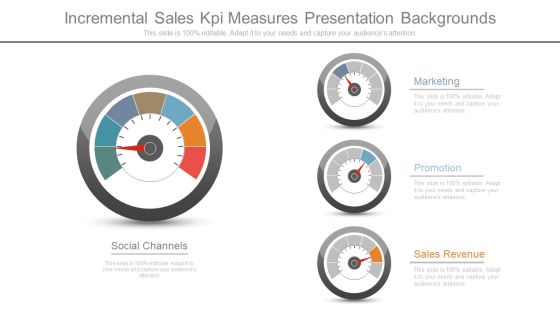
Incremental Sales Kpi Measures Presentation Backgrounds
This is a incremental sales kpi measures presentation backgrounds. This is a four stage process. The stages in this process are marketing, promotion, sales revenue, social channels.

Dashboard Ppt PowerPoint Presentation Sample
This is a dashboard ppt powerpoint presentation sample. This is a three stage process. The stages in this process are business, strategy, marketing, analysis, success, dashboard.

Dashboard Ppt PowerPoint Presentation Good
This is a dashboard ppt powerpoint presentation good. This is a three stage process. The stages in this process are dashboard, marketing, analysis, strategy, business.

Dashboard Ppt PowerPoint Presentation Picture
This is a dashboard ppt powerpoint presentation picture. This is a three stage process. The stages in this process are business, dashboard, marketing, strategy, analysis.

Performance Based Marketing Metrics To Measure Results Of Performance Marketing Demonstration PDF
This slide showcases metrics that can help organization to track the effectiveness of performance advertisement campaign. Its key components are cost per click, cost per sales, cost per impression and cost per lead. This Performance Based Marketing Metrics To Measure Results Of Performance Marketing Demonstration PDF is perfect for any presentation, be it in front of clients or colleagues. It is a versatile and stylish solution for organizing your meetings. The Performance Based Marketing Metrics To Measure Results Of Performance Marketing Demonstration PDF features a modern design for your presentation meetings. The adjustable and customizable slides provide unlimited possibilities for acing up your presentation. Slidegeeks has done all the homework before launching the product for you. So, dont wait, grab the presentation templates today.
Performance Measurement Vs Performance Management Ppt PowerPoint Presentation Icon Infographics Cpb
Presenting this set of slides with name performance measurement vs performance management ppt powerpoint presentation icon infographics cpb. This is an editable Powerpoint four stages graphic that deals with topics like performance measurement vs performance management to help convey your message better graphically. This product is a premium product available for immediate download and is 100 percent editable in Powerpoint. Download this now and use it in your presentations to impress your audience.
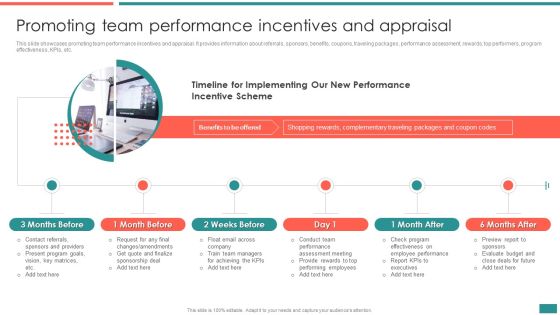
Promoting Team Performance Incentives And Appraisal Building Efficient Workplace Performance Clipart PDF
This slide illustrates learning and development programs for various teams. It provides information about communication, spreadsheet management, task management, reporting, finance, trading, analytics, dashboard, email writing, etc.If your project calls for a presentation, then Slidegeeks is your go-to partner because we have professionally designed, easy-to-edit templates that are perfect for any presentation. After downloading, you can easily edit Promoting Team Performance Incentives And Appraisal Building Efficient Workplace Performance Clipart PDF and make the changes accordingly. You can rearrange slides or fill them with different images. Check out all the handy templates.

Business Framework Key Performance Indicators Customer Service PowerPoint Presentation
Our above diagram provides framework of key performance indicators for customer service. It contains circular diagram in four segments depicting concepts of delivery problems, customer care training. Download this diagram to make professional presentations on customer service.

Cashless Payment Strategies To Enhance Business Performance Impact Of BNLP Payment Business Performance Mockup PDF
Mentioned slide demonstrates the impact of Buy Now Pay Later payment option adoption on business goals. It includes key performance indicators such as new customer engagement, market share, order level and conversion rate. Formulating a presentation can take up a lot of effort and time, so the content and message should always be the primary focus. The visuals of the PowerPoint can enhance the presenters message, so our Cashless Payment Strategies To Enhance Business Performance Impact Of BNLP Payment Business Performance Mockup PDF was created to help save time. Instead of worrying about the design, the presenter can concentrate on the message while our designers work on creating the ideal templates for whatever situation is needed. Slidegeeks has experts for everything from amazing designs to valuable content, we have put everything into Cashless Payment Strategies To Enhance Business Performance Impact Of BNLP Payment Business Performance Mockup PDF
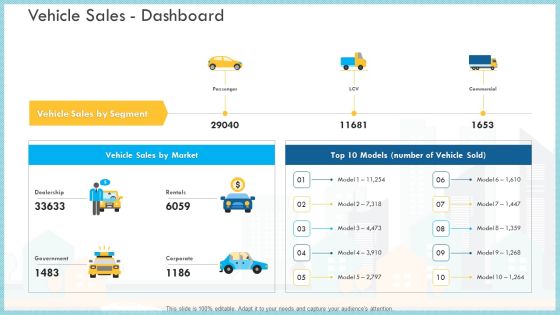
Loss Of Income And Financials Decline In An Automobile Organization Case Study Vehicle Sales Dashboard Infographics PDF
Deliver an awe-inspiring pitch with this creative loss of income and financials decline in an automobile organization case study vehicle sales dashboard infographics pdf bundle. Topics like vehicle sales by segment, vehicle sales by market, government can be discussed with this completely editable template. It is available for immediate download depending on the needs and requirements of the user.

Performance Analysis Of New Product Development Key Metrics For Understanding Product Performance Themes PDF
The following slide displays key metrics that can be used to understand the product, these metrics can be Revenues Generated by the product, the total units sold of the product and the total purchase value of the product. This is a performance analysis of new product development key metrics for understanding product performance themes pdf template with various stages. Focus and dispense information on three stages using this creative set, that comes with editable features. It contains large content boxes to add your information on topics like revenues generated, unit sold, purchase value. You can also showcase facts, figures, and other relevant content using this PPT layout. Grab it now.

Retail Kpi Dashboard Showing Sales Revenue Customers And Out Of Stock Items Ppt PowerPoint Presentation Outline Example
This is a retail kpi dashboard showing sales revenue customers and out of stock items ppt powerpoint presentation outline example. This is a three stage process. The stages in this process are finance, marketing, management, investment, analysis.

 Home
Home