AI PPT Maker
Templates
PPT Bundles
Design Services
Business PPTs
Business Plan
Management
Strategy
Introduction PPT
Roadmap
Self Introduction
Timelines
Process
Marketing
Agenda
Technology
Medical
Startup Business Plan
Cyber Security
Dashboards
SWOT
Proposals
Education
Pitch Deck
Digital Marketing
KPIs
Project Management
Product Management
Artificial Intelligence
Target Market
Communication
Supply Chain
Google Slides
Research Services
 One Pagers
All Categories
-
Home
- Customer Favorites
- Sales Leaderboard
Sales Leaderboard
Sales Performance Dashboard Ppt PowerPoint Presentation Pictures Icons
This is a sales performance dashboard ppt powerpoint presentation pictures icons. This is a six stage process. The stages in this process are top selling plans, top opportunities, new customer, sales funnel, top sales reps.
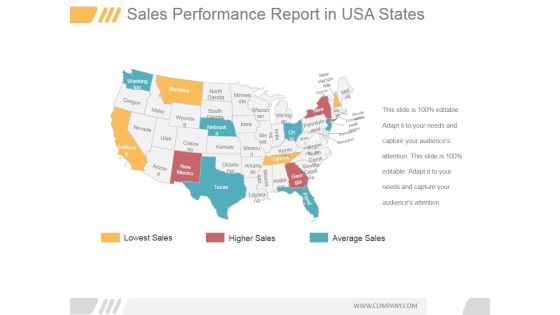
Sales Performance Report In Usa States Ppt PowerPoint Presentation Themes
This is a sales performance report in usa states ppt powerpoint presentation themes. This is a three stage process. The stages in this process are lowest sales, higher sales, average sales.
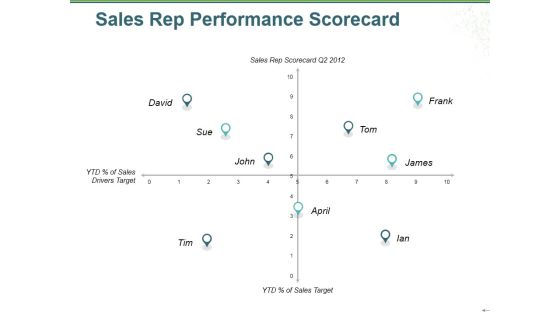
Sales Rep Performance Scorecard Ppt PowerPoint Presentation Infographic Template Layout
This is a sales rep performance scorecard ppt powerpoint presentation infographic template layout. This is a four stage process. The stages in this process are sales drivers target, sales target, sales rep scorecard, business, marketing.

Sales Performance Dashboard Template Ppt PowerPoint Presentation Professional Elements
This is a sales performance dashboard template ppt powerpoint presentation professional elements. This is a eight stage process. The stages in this process are sales comparison, sales by product category, sales by month, brand profitability, revenue.
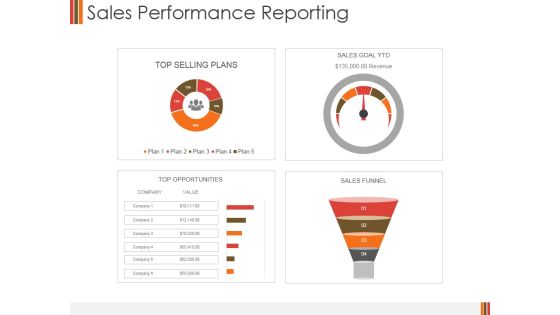
Sales Performance Reporting Ppt PowerPoint Presentation Slides Background Designs
This is a sales performance reporting ppt powerpoint presentation slides background designs. This is a four stage process. The stages in this process are top selling plans, sales goal ytd, top opportunities, sales funnel.
Sales Product Performance Dashboard Ppt PowerPoint Presentation Summary Icon
This is a sales product performance dashboard ppt powerpoint presentation infographics samples. This is a four stage process. The stages in this process are top products in revenue, incremental sales campaign, sales product performance, cost of goods sold.
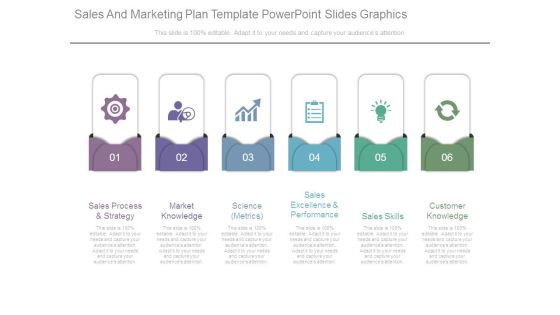
Sales And Marketing Plan Template Powerpoint Slides Graphics
This is a sales and marketing plan template powerpoint slides graphics. This is a six stage process. The stages in this process are sales process and strategy, market knowledge, science metrics, sales excellence and performance, sales skills, customer knowledge.
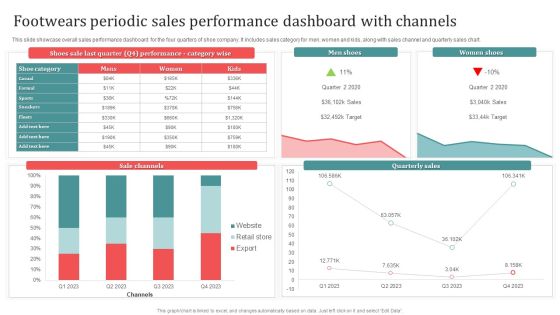
Footwears Periodic Sales Performance Dashboard With Channels Download PDF
This slide showcase overall sales performance dashboard for the four quarters of shoe company. It includes sales category for men, women and kids, along with sales channel and quarterly sales chart. Showcasing this set of slides titled Footwears Periodic Sales Performance Dashboard With Channels Download PDF. The topics addressed in these templates are Men Shoes, Women Shoes, Sale Channels. All the content presented in this PPT design is completely editable. Download it and make adjustments in color, background, font etc. as per your unique business setting.
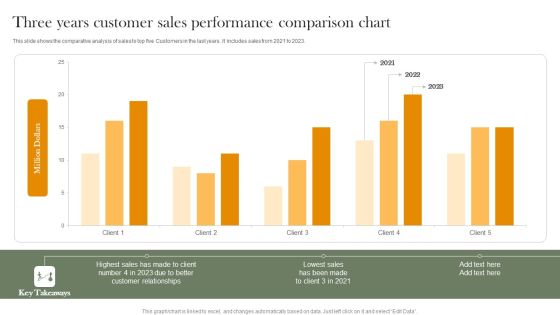
Three Years Customer Sales Performance Comparison Chart Professional PDF
This slide shows the comparative analysis of sales to top five Customers in the last years. It includes sales from 2021 to 2023. Pitch your topic with ease and precision using this Three Years Customer Sales Performance Comparison Chart Professional PDF. This layout presents information on Highest Sales, Customer Relationships, Lowest Sales. It is also available for immediate download and adjustment. So, changes can be made in the color, design, graphics or any other component to create a unique layout.

Sales Kpi Performance Summary Ppt PowerPoint Presentation Infographic Template Elements
This is a sales kpi performance summary ppt powerpoint presentation infographic template elements. This is a seven stage process. The stages in this process are revenue comparison, quantity comparison, product sales mix, regional sales mix, budget.
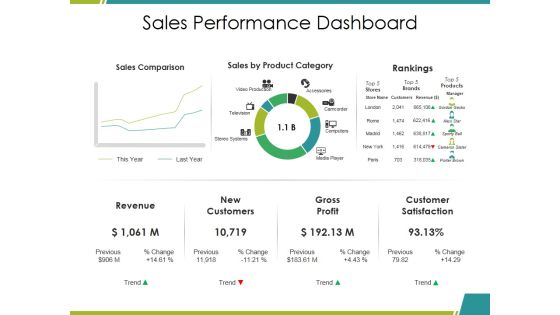
Sales Performance Dashboard Ppt PowerPoint Presentation Infographics Mockup
This is a sales performance dashboard ppt powerpoint presentation infographics mockup. This is a three stage process. The stages in this process are sales comparison, sales by product category, rankings, revenue, gross profit.

Sales Performance Dashboard Ppt PowerPoint Presentation Gallery Background
This is a sales performance dashboard ppt powerpoint presentation gallery backgroun. This is a six stage process. The stages in this process are sales comparison, sales by product category, rankings, revenue, new customers.

Sales Kpi Performance Summary Ppt PowerPoint Presentation Ideas Graphics Template
This is a sales kpi performance summary ppt powerpoint presentation ideas graphics template. This is a seven stage process. The stages in this process are revenue comparison, quantity comparison, product sales mix, regional sales mix.

Sales Kpi Performance Summary Ppt PowerPoint Presentation Show Inspiration
This is a sales kpi performance summary ppt powerpoint presentation show inspiration. This is a two stage process. The stages in this process are revenue comparison, quantity comparison, product sales mix, regional sales mix, budget.
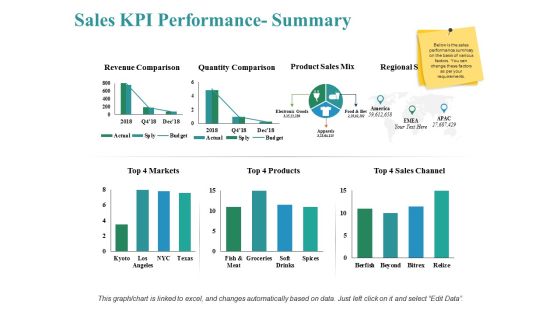
Sales Kpi Performance Summary Ppt PowerPoint Presentation Show Themes
This is a sales kpi performance summary ppt powerpoint presentation show themes. This is a three stage process. The stages in this process are revenue comparison, quantity comparison, product sales mix, markets, sales channel.
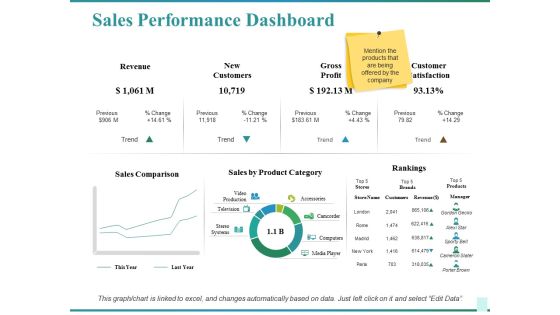
Sales Performance Dashboard Ppt PowerPoint Presentation Show Graphics Design
This is a sales performance dashboard ppt powerpoint presentation show graphics design. This is a two stage process. The stages in this process are sales comparison, sales by product category, rankings, customer satisfaction, revenue.
Determine Pipeline By Individual Sales Representative Performance Icons PDF
This slide provides information regarding monitoring of different sales representatives performance by determine sales duration at various pipeline stages. Deliver an awe inspiring pitch with this creative Determine Pipeline By Individual Sales Representative Performance Icons PDF bundle. Topics like Sales Representative, Sales Department, Shorter Sales Cycle can be discussed with this completely editable template. It is available for immediate download depending on the needs and requirements of the user.

Sales Performance Optimization Ppt PowerPoint Presentation Slides Graphics Cpb
This is a sales performance optimization ppt powerpoint presentation slides graphics cpb. This is a three stage process. The stages in this process are sales performance optimization.
Sales Team Performance Ppt PowerPoint Presentation File Layouts Cpb
This is a sales team performance ppt powerpoint presentation file layouts cpb. This is a seven stage process. The stages in this process are sales team performance.

Weekly Employee Representative Sales Performance Scorecard Guidelines PDF
Mentioned slide displays weekly employee sales performance scorecard for setting effective business sales goals. It includes key elements such as employees weekly sales, total sales, targeted sales and employee performance status. Showcasing this set of slides titled Weekly Employee Representative Sales Performance Scorecard Guidelines PDF. The topics addressed in these templates are Total Sales, Target Sales, Performance Status. All the content presented in this PPT design is completely editable. Download it and make adjustments in color, background, font etc. as per your unique business setting.
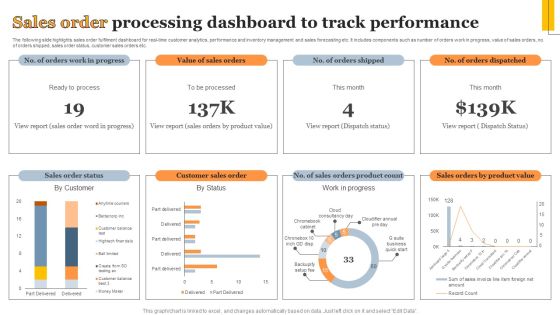
Sales Order Processing Dashboard To Track Performance Information PDF
The following slide highlights sales order fulfilment dashboard for real-time customer analytics, performance and inventory management and sales forecasting etc. It includes components such as number of orders work in progress, value of sales orders, no. of orders shipped, sales order status, customer sales orders etc. Showcasing this set of slides titled Sales Order Processing Dashboard To Track Performance Information PDF. The topics addressed in these templates are Sales Order Status, Customer Sales Order, Work Progress. All the content presented in this PPT design is completely editable. Download it and make adjustments in color, background, font etc. as per your unique business setting.
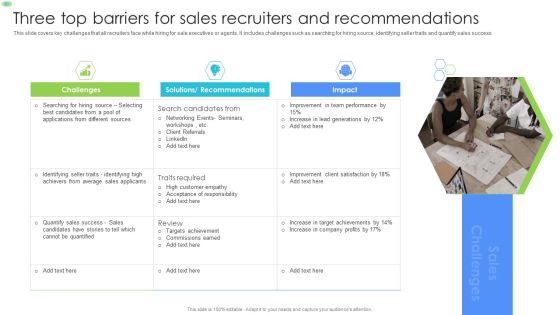
Three Top Barriers For Sales Recruiters And Recommendations Information PDF
This slide covers key challenges that all recruiters face while hiring for sale executives or agents. It includes challenges such as searching for hiring source, identifying seller traits and quantify sales success. Presenting Three Top Barriers For Sales Recruiters And Recommendations Information PDF to dispense important information. This template comprises three stages. It also presents valuable insights into the topics including Average Sales Applicants, Targets Achievement, Team Performance. This is a completely customizable PowerPoint theme that can be put to use immediately. So, download it and address the topic impactfully.

Sales Management Needs Analysis Solution Design Ppt Sample
This is a sales management needs analysis solution design ppt sample. This is a six stage process. The stages in this process are needs analysis solution design, sales activity management system, sales performance analysis, sales management, customer interaction, sales activity reports.

Sales Representative Barriers And Overcoming Solutions Designs PDF
This slide covers top sale agent challenges that disrupts company growth and performance. It includes challenges such as competing with competitors, inability to answer prospects queries, sales training, sales and marketing alignment, etc. Presenting Sales Representative Barriers And Overcoming Solutions Designs PDF to dispense important information. This template comprises three stages. It also presents valuable insights into the topics including Sales Rep Challenges, Competitive Market, Customer. This is a completely customizable PowerPoint theme that can be put to use immediately. So, download it and address the topic impactfully.
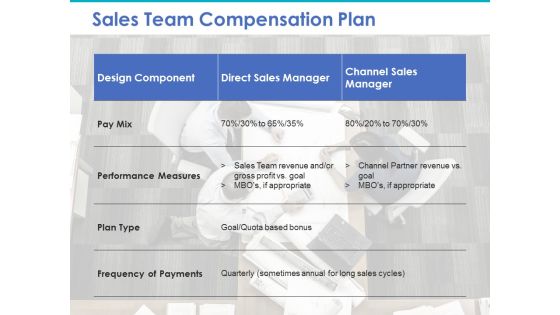
Sales Team Compensation Plan Ppt PowerPoint Presentation Outline Example File
This is a sales team compensation plan ppt powerpoint presentation outline example file. This is a three stage process. The stages in this process are design component, direct sales manager, channel sales manager, pay mix, performance measures.
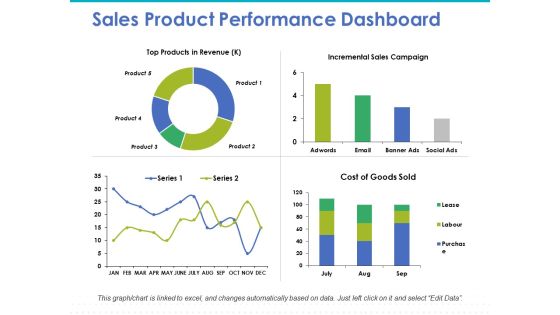
Sales Product Performance Dashboard Ppt PowerPoint Presentation Model Graphics Design
This is a sales product performance dashboard ppt powerpoint presentation model graphics design. This is a four stage process. The stages in this process are top products in revenue, incremental sales, cost of goods.

Table Of Contents For Sales Process Catalogue Template Graphics PDF
This is a table of contents for sales process catalogue template graphics pdf template with various stages. Focus and dispense information on seven stages using this creative set, that comes with editable features. It contains large content boxes to add your information on topics like sales performance, sales methodology, sales process, sales workforce, sales team productivity. You can also showcase facts, figures, and other relevant content using this PPT layout. Grab it now.
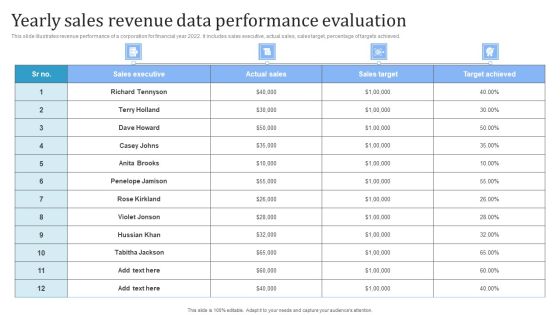
Yearly Sales Revenue Data Performance Evaluation Ideas PDF
Pitch your topic with ease and precision using this Yearly Sales Revenue Data Performance Evaluation Ideas PDF. This layout presents information on Sales Executive, Actual Sales, Sales Target. It is also available for immediate download and adjustment. So, changes can be made in the color, design, graphics or any other component to create a unique layout.

Suggestion Plan For Increasing Store Sales Professional PDF
This slide covers strategic action plan to achieve objectives for increasing sales of an apparel company having three sales channels such as in store, online and wholesale stores. It also includes elements such as product types, projected sales, recommended strategies, proposed deadlines and performance indicators or KPIs. Showcasing this set of slides titled Suggestion Plan For Increasing Store Sales Professional PDF. The topics addressed in these templates are Products, Sale Channel, Regular Customers. All the content presented in this PPT design is completely editable. Download it and make adjustments in color, background, font etc. as per your unique business setting.
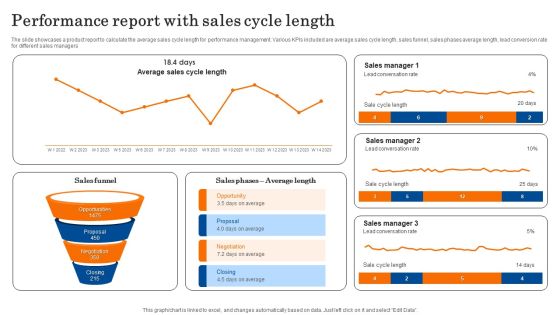
Performance Report With Sales Cycle Length Template PDF
The slide showcases a product report to calculate the average sales cycle length for performance management. Various KPIs included are average sales cycle length, sales funnel, sales phases average length, lead conversion rate for different sales managers. sPitch your topic with ease and precision using this Performance Report With Sales Cycle Length Template PDF. This layout presents information on Sales Manager, Conversation Rate, Opportunity. It is also available for immediate download and adjustment. So, changes can be made in the color, design, graphics or any other component to create a unique layout.
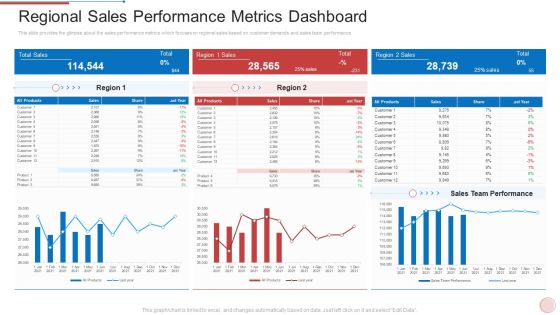
Regional Marketing Strategies Regional Sales Performance Metrics Dashboard Infographics PDF
This slide provides the glimpse about the sales performance metrics which focuses on regional sales based on customer demands and sales team performance. Deliver and pitch your topic in the best possible manner with this regional marketing strategies regional sales performance metrics dashboard infographics pdf. Use them to share invaluable insights on regional sales performance metrics dashboard and impress your audience. This template can be altered and modified as per your expectations. So, grab it now.
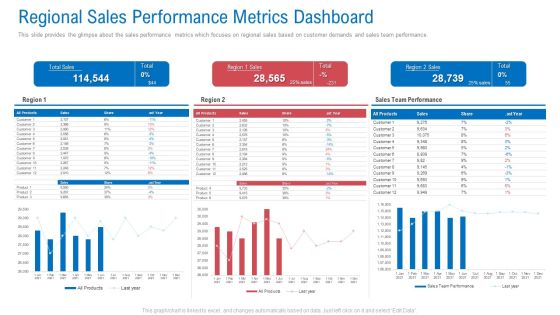
Regional Marketing Planning Regional Sales Performance Metrics Dashboard Information PDF
This slide provides the glimpse about the sales performance metrics which focuses on regional sales based on customer demands and sales team performance. Deliver an awe inspiring pitch with this creative regional marketing planning regional sales performance metrics dashboard information pdf bundle. Topics like regional sales performance metrics dashboard can be discussed with this completely editable template. It is available for immediate download depending on the needs and requirements of the user.
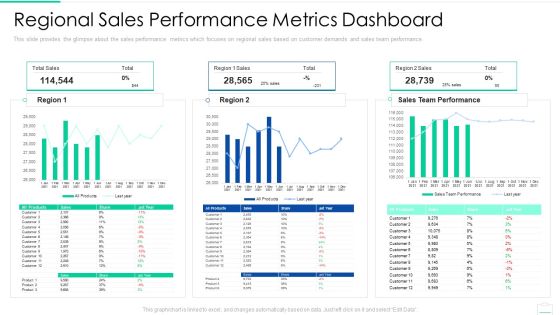
Market Area Analysis Regional Sales Performance Metrics Dashboard Designs PDF
This slide provides the glimpse about the sales performance metrics which focuses on regional sales based on customer demands and sales team performance. Deliver and pitch your topic in the best possible manner with this market area analysis regional sales performance metrics dashboard designs pdf. Use them to share invaluable insights on regional sales performance metrics dashboard and impress your audience. This template can be altered and modified as per your expectations. So, grab it now.

Actual And Forecasted Customer Sales Performance Comparison Elements PDF
This slide shows the actual and forecasted customer sales comparison. It also includes client name and variance in actual and forecasted sales. Showcasing this set of slides titled Actual And Forecasted Customer Sales Performance Comparison Elements PDF. The topics addressed in these templates are Forecasted Sales, Actual Sales, Price. All the content presented in this PPT design is completely editable. Download it and make adjustments in color, background, font etc. as per your unique business setting.

Annual Customer Sales Performance Comparison Graph Portrait PDF
This slide shows the annual sales comparison chart. It also includes total and monthly sales target. Pitch your topic with ease and precision using this Annual Customer Sales Performance Comparison Graph Portrait PDF. This layout presents information on Total Sales Target, Sales Target, Achievement. It is also available for immediate download and adjustment. So, changes can be made in the color, design, graphics or any other component to create a unique layout.
Pharma Medical Dashboard To Analyze Sales Strategy Performance Icons PDF
The following slide delineates a comprehensive medical dashboard which can be used by the pharma company to measure its sales strategy performance. The KPIs covered in the slide are top sales producers, sales channels, volume by product, etc. Showcasing this set of slides titled Pharma Medical Dashboard To Analyze Sales Strategy Performance Icons PDF. The topics addressed in these templates are Market Leaders, Sales Channels, Volume Product. All the content presented in this PPT design is completely editable. Download it and make adjustments in color, background, font etc. as per your unique business setting.
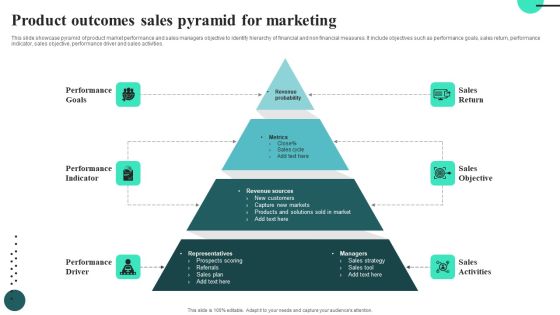
Product Outcomes Sales Pyramid For Marketing Information PDF
This slide showcase pyramid of product market performance and sales managers objective to identify hierarchy of financial and non financial measures. It include objectives such as performance goals, sales return, performance indicator, sales objective, performance driver and sales activities.Presenting Product Outcomes Sales Pyramid For Marketing Information PDF to dispense important information. This template comprises four stages. It also presents valuable insights into the topics including Sales Return, Sales Objective. This is a completely customizable PowerPoint theme that can be put to use immediately. So, download it and address the topic impactfully.

Dashboard For Tracking Sales Target Metrics Introduction PDF
This slide presents KPI dashboard for tracking Sales Target Metrics achievement monthly and region wise helpful in adjusting activities as per ongoing performance. It includes average weekly sales revenue, average sales target, annual sales growth, regional sales performance and average revenue per unit that should be regularly tracked. Showcasing this set of slides titled Dashboard For Tracking Sales Target Metrics Introduction PDF. The topics addressed in these templates are Average Revenue, Per Unit, Average Weekly, Sales Revenue. All the content presented in this PPT design is completely editable. Download it and make adjustments in color, background, font etc. as per your unique business setting.
Monthly Sales Performance Tracking And Monitoring Dashboard Diagrams PDF
This slide showcases a dashboard presenting various metrics to measure and analyze sales performance for revenue growth. It includes key components such as number of sales, revenue, profit, cost, sales revenue, sales increment, cost analysis and cross sell. Make sure to capture your audiences attention in your business displays with our gratis customizable Monthly Sales Performance Tracking And Monitoring Dashboard Diagrams PDF. These are great for business strategies, office conferences, capital raising or task suggestions. If you desire to acquire more customers for your tech business and ensure they stay satisfied, create your own sales presentation with these plain slides.
Monthly Sales Performance Tracking And Monitoring Dashboard Designs PDF
This slide showcases a dashboard presenting various metrics to measure and analyze sales performance for revenue growth. It includes key components such as number of sales, revenue, profit, cost, sales revenue, sales increment, cost analysis and cross sell. Make sure to capture your audiences attention in your business displays with our gratis customizable Monthly Sales Performance Tracking And Monitoring Dashboard Designs PDF. These are great for business strategies, office conferences, capital raising or task suggestions. If you desire to acquire more customers for your tech business and ensure they stay satisfied, create your own sales presentation with these plain slides.
Sales Performance Dashboard With Average Lead Tracking Time Background PDF
This slide showcases dashboard for sales performance that can help organization to analyze the effectiveness of sales campaigns and average response time of lead. Its key components are average contract value, average sales cycle length, follow up contract rate and sales activity. Showcasing this set of slides titled Sales Performance Dashboard With Average Lead Tracking Time Background PDF. The topics addressed in these templates are Avg Contract Value, Sales Activity, Contract Rate. All the content presented in this PPT design is completely editable. Download it and make adjustments in color, background, font etc. as per your unique business setting.

Company Sales And Revenue Performance Analysis Ppt Ideas Format PDF
This slide covers sales and revenue generated by a business entity. It also includes elements such profits earned, cost incurred, marketing and sales cost breakdown, annual sales revenue graph, sales generated through social media, revenue from up OR cross selling, etc. Pitch your topic with ease and precision using this Company Sales And Revenue Performance Analysis Ppt Ideas Format PDF. This layout presents information on Total Sales, Revenue Generation, Profit Earned, Cost Incurred. It is also available for immediate download and adjustment. So, changes can be made in the color, design, graphics or any other component to create a unique layout.
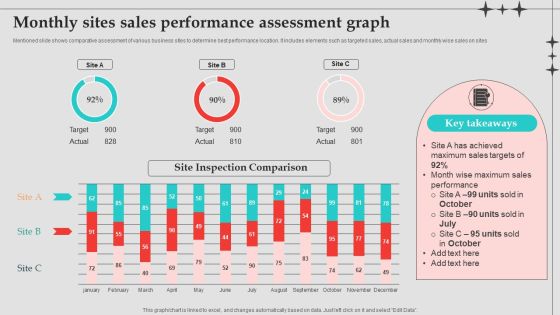
Monthly Sites Sales Performance Assessment Graph Designs PDF
Mentioned slide shows comparative assessment of various business sites to determine best performance location. It includes elements such as targeted sales, actual sales and monthly wise sales on sites. Pitch your topic with ease and precision using this Monthly Sites Sales Performance Assessment Graph Designs PDF. This layout presents information on Sales Performance, Sales Targets, Performance Assessment Graph . It is also available for immediate download and adjustment. So, changes can be made in the color, design, graphics or any other component to create a unique layout.

Sales Team Performance Management Pyramid Of Enterprise Brochure PDF
This slide represents the performance management pyramid of the sales team of an enterprise. It includes details related to performance goals, indicators and drivers along with sales results, objectives and activities. Persuade your audience using this Sales Team Performance Management Pyramid Of Enterprise Brochure PDF. This PPT design covers six stages, thus making it a great tool to use. It also caters to a variety of topics including Sales Results, Sales Objectives, Sales Activities. Download this PPT design now to present a convincing pitch that not only emphasizes the topic but also showcases your presentation skills.
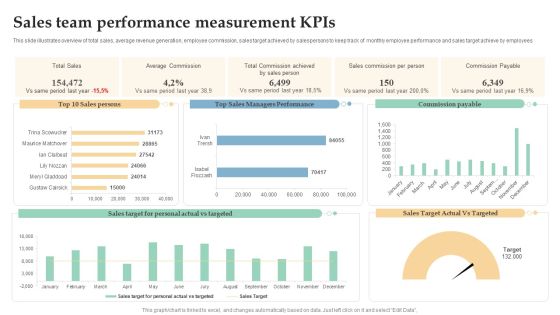
Sales Team Performance Measurement Kpis Ppt Professional Templates PDF
This slide illustrates overview of total sales, average revenue generation, employee commission, sales target achieved by salespersons to keep track of monthly employee performance and sales target achieve by employees. Showcasing this set of slides titled Sales Team Performance Measurement Kpis Ppt Professional Templates PDF. The topics addressed in these templates are Total Sales, Average Commission, Sales Commission, Per Person. All the content presented in this PPT design is completely editable. Download it and make adjustments in color, background, font etc. as per your unique business setting.

Sales KPI Framework Ppt PowerPoint Presentation Gallery Show PDF
The mentioned slide depicts the sales key performance indicators framework. This includes monthly sales growth, monthly calls and emails, leads to sales percentage and average conversion time. Presenting sales kpi framework ppt powerpoint presentation gallery show pdf to dispense important information. This template comprises four stages. It also presents valuable insights into the topics including growth, sales, emails This is a completely customizable PowerPoint theme that can be put to use immediately. So, download it and address the topic impactfully.

Customer And Product Sales Performance Comparison Matrix Introduction PDF
This slide shows client and product sales Performance comparison matrix. It includes top products and Customer of the organization. Showcasing this set of slides titled Customer And Product Sales Performance Comparison Matrix Introduction PDF. The topics addressed in these templates are Top Products, Top Customers, Sales. All the content presented in this PPT design is completely editable. Download it and make adjustments in color, background, font etc. as per your unique business setting.
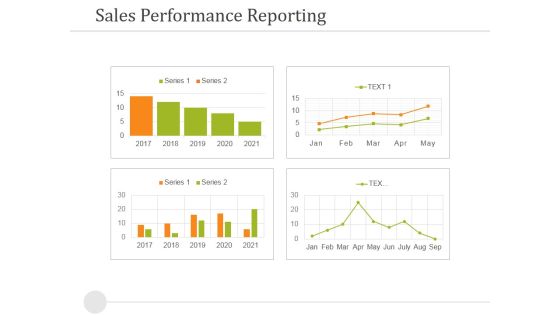
Sales Performance Reporting Ppt PowerPoint Presentation Outline Outfit
This is a sales performance reporting ppt powerpoint presentation outline outfit. This is a four stage process. The stages in this process are sales performance reporting, business, success, strategy, finance.

Waterfall Chart Indicating Sales Performance Ppt PowerPoint Presentation Outline Templates
This is a waterfall chart indicating sales performance ppt powerpoint presentation outline templates. This is a seven stage process. The stages in this process are sales waterfall, waterfall chart, business.

Sales Performance Dashboard Top Opportunities Ppt PowerPoint Presentation Layouts Template
This is a sales performance dashboard top opportunities ppt powerpoint presentation layouts template. This is a eight stage process. The stages in this process are revenue, new customer, gross profit, customer satisfaction, brand profitability.

Deliver Efficiency Innovation Dashboard Depicting Sales Product Performance Themes PDF
This slide focuses on dashboard that depicts sales product performance that includes top products in revenues, online verses offline purchases, incremental sales by campaign and cost of goods sold. Deliver an awe inspiring pitch with this creative Deliver Efficiency Innovation Dashboard Depicting Sales Product Performance Themes PDF bundle. Topics like Top Products Revenue, Online Vs Offline Purchases, Incremental Sales Campaign, Cost Goods Sold can be discussed with this completely editable template. It is available for immediate download depending on the needs and requirements of the user.
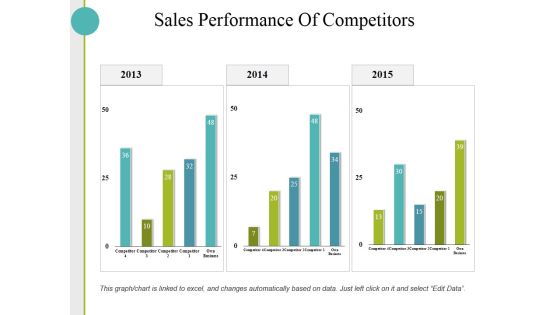
Sales Performance Of Competitors Ppt PowerPoint Presentation Show Graphics Download
This is a sales performance of competitors ppt powerpoint presentation show graphics download. This is a three stage process. The stages in this process are business, finance, marketing, strategy, sales.
Retail Sales Performance Chart Example Of Ppt Presentation
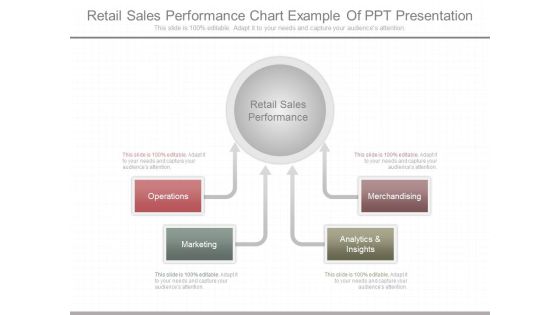
This is a retail sales performance chart example of ppt presentation. This is a four stage process. The stages in this process are operations, marketing, analytics and insights, merchandising, retail sales performance.
Sales Rep Performance Scorecard Ppt PowerPoint Presentation Icon Design Inspiration
This is a sales rep performance scorecard ppt powerpoint presentation icon design inspiration. This is a four stage process. The stages in this process are business, sales, performance, planning, management.

Sales Performance Versus Target Ppt PowerPoint Presentation File Vector
This is a sales performance versus target ppt powerpoint presentation file vector. This is a five stage process. The stages in this process are business, marketing, speed, meter, sales.
Sales KPI Performance Summary Ppt PowerPoint Presentation Infographics Model
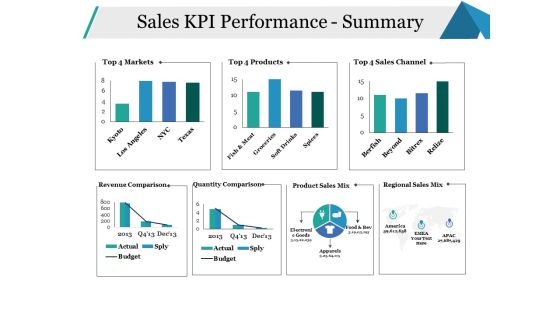
This is a sales kpi performance summary ppt powerpoint presentation infographics model. This is a seven stage process. The stages in this process are sales channel, revenue comparison, quantity comparison, business, marketing.

Sales Performance Of Competitors Ppt PowerPoint Presentation Portfolio Summary
This is a sales performance of competitors ppt powerpoint presentation portfolio summary. This is a three stage process. The stages in this process are business, management, sales, finance, analysis.

Company Sales And Performance Dashboard Ppt PowerPoint Presentation Show Structure
This is a company sales and performance dashboard ppt powerpoint presentation show structure. This is a four stage process. The stages in this process are year product sales, month growth in revenue, profit margins graph, year profits.

B2B Sales Representatives Performance Tracking Dashboard Elements PDF
This slide provides information regarding B2B sales representatives performance tracking dashboard to measure leads by region, revenue breakdown, top performers by leads, revenues, etc. Deliver an awe inspiring pitch with this creative B2B Sales Representatives Performance Tracking Dashboard Elements PDF bundle. Topics like Revenue Actual, Sales Representatives Performance, Tracking Dashboard can be discussed with this completely editable template. It is available for immediate download depending on the needs and requirements of the user.
Sales Performance Comparison Graph Of Top Customer Icons PDF
This slide shows the customer sales comparison graph along with the units of product purchased by the clients. Showcasing this set of slides titled Sales Performance Comparison Graph Of Top Customer Icons PDF. The topics addressed in these templates are Highest Units, Customer, Product. All the content presented in this PPT design is completely editable. Download it and make adjustments in color, background, font etc. as per your unique business setting.
