AI PPT Maker
Templates
PPT Bundles
Design Services
Business PPTs
Business Plan
Management
Strategy
Introduction PPT
Roadmap
Self Introduction
Timelines
Process
Marketing
Agenda
Technology
Medical
Startup Business Plan
Cyber Security
Dashboards
SWOT
Proposals
Education
Pitch Deck
Digital Marketing
KPIs
Project Management
Product Management
Artificial Intelligence
Target Market
Communication
Supply Chain
Google Slides
Research Services
 One Pagers
All Categories
-
Home
- Customer Favorites
- Sales Increase Or Decrease
Sales Increase Or Decrease

Business Diagram Circular Process Cycle Diagram Chart 7 Stages Sales Diagram
Our Business Diagram Circular Process Cycle Diagram Chart 7 Stages Sales Diagram Powerpoint Templates Team Are A Dogged Lot. They Keep At It Till They Get It Right.
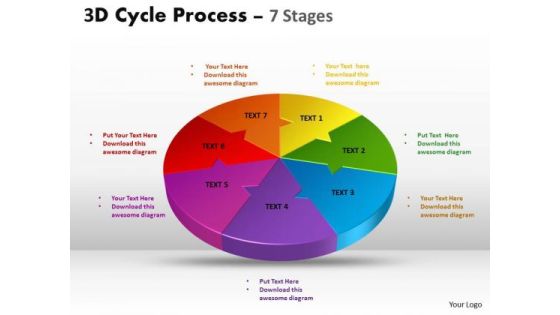
Business Framework Model 3d Cycle Process Flow Chart 7 Stages Sales Diagram
Establish The Dominance Of Your Ideas. Our Business Framework Model 3d Cycle Process Flow Chart 7 Stages Sales Diagram Powerpoint Templates Will Put Them On Top.
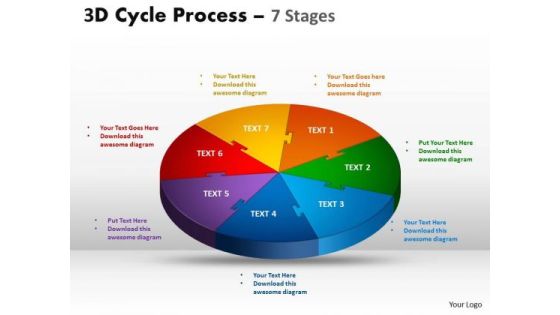
Strategic Management 3d Cycle Process Flow Chart 7 Stages Sales Diagram
Our Strategic Management 3d Cycle Process Flow Chart 7 Stages Sales Diagram Powerpoint Templates Deliver At Your Doorstep. Let Them In For A Wonderful Experience.

Business Cycle Diagram Men Silhouettes Standing On Pie Chart Sales Diagram
Get Out Of The Dock With Our Business Cycle Diagram men silhouettes standing on pie chart Sales Diagram Powerpoint Templates. Your Mind Will Be Set Free.
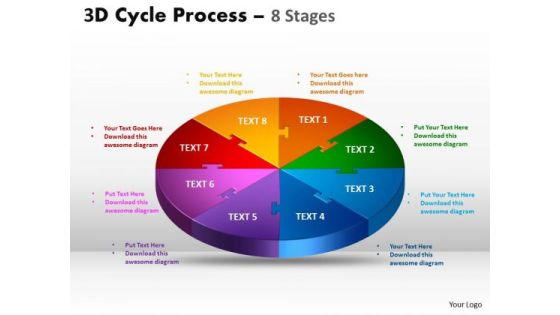
Business Diagram 3d Cycle Process Flow Chart 8 Stages Sales Diagram
Document The Process On Our Business Diagram 3D Cycle Process Flow Chart 8 Stages Sales Diagram Powerpoint Templates. Make A Record Of Every Detail.

Sales Diagram 3d Circular Process Cycle Diagram Chart 8 Stages Design 2 Strategic Management
Be A Donor Of Great Ideas. Display Your Charity On Our Sales Diagram 3D Circular Process Cycle Diagram Chart 8 Stages Design 2 Strategic Management Powerpoint Templates.
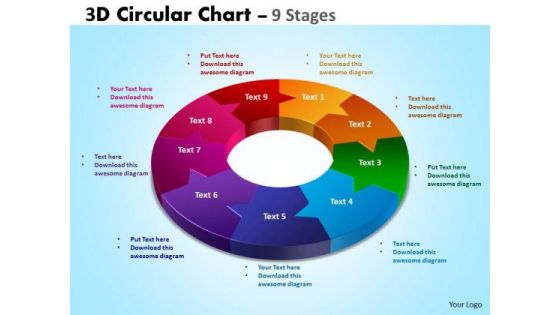
Mba Models And Frameworks 3d Circular Chart 9 Stages Sales Diagram
Put In A Dollop Of Our MBA models and frameworks 3D Circular Chart 9 Stages Sales Diagram Powerpoint Templates. Give Your Thoughts A Distinctive Flavor.

Sales Business 3d Circular Process Cycle Diagram Chart 9 Stages Business Diagram
Doll Up Your Thoughts With Our Sales Business 3D Circular Process Cycle Diagram Chart 9 Stages Business Diagram Powerpoint Templates. They Will Make A Pretty Picture.
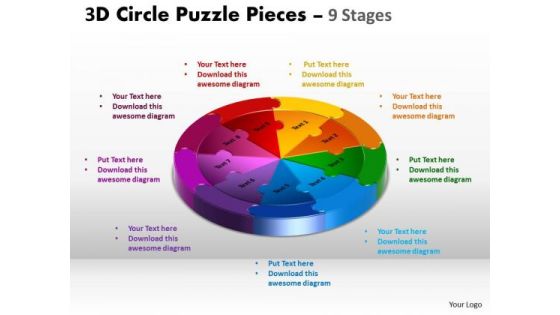
Sales Diagram 3d Circle Puzzle Diagram 9 Stages Mba Models And Frameworks
Establish The Dominance Of Your Ideas. Our Sales Diagram 3D Circle Puzzle Diagram 9 Stages MBA models and frameworks Powerpoint Templates Will Put Them On Top.

Business Cycle Diagram 3d Circle Puzzle Diagram 10 Stages Slide Layout Sales Diagram
Get Out Of The Dock With Our Business Cycle Diagram 3d Circle Puzzle Diagram 10 Stages Slide Layout Sales Diagram Powerpoint Templates. Your Mind Will Be Set Free.

Business Diagram 3d Circle Puzzle Diagram 10 Stages Slide Layout Sales Diagram
Document Your Views On Our Business Diagram 3d Circle Puzzle Diagram 10 Stages Slide Layout Sales Diagram Powerpoint Templates. They Will Create A Strong Impression.

Sales Diagram 3d Circular Process Cycle Diagram Chart 10 Stages Design 3 Business Diagram
Establish The Dominance Of Your Ideas. Our Sales Diagram 3d Circular Process Cycle Diagram Chart 10 Stages Design 3 Business Diagram Powerpoint Templates Will Put Them On Top.

Business Diagram 3d Circular Process Cycle Diagram Chart 11 Stages Sales Diagram
Document Your Views On Our Business Diagram 3d Circular Process Cycle Diagram Chart 11 Stages Sales Diagram Powerpoint Templates. They Will Create A Strong Impression.

Mba Models And Frameworks 3d Circle Puzzle Diagram 12 Stages Sales Diagram
Doll Up Your Thoughts With Our MBA models and frameworks 3D Circle Puzzle Diagram 12 Stages Sales Diagram Powerpoint Templates. They Will Make A Pretty Picture.
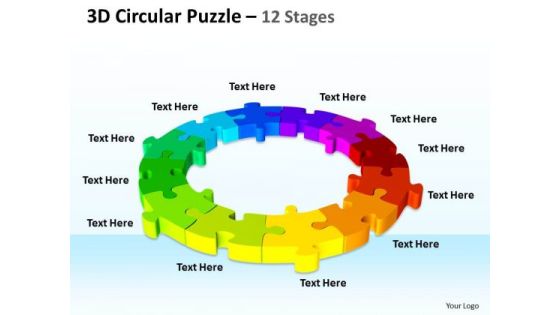
Mba Models And Frameworks 3d Circular Puzzle 12 Stages Sales Diagram
Establish The Dominance Of Your Ideas. Our MBA models and frameworks 3D Circular Puzzle 12 Stages Sales Diagram Powerpoint Templates Will Put Them On Top.
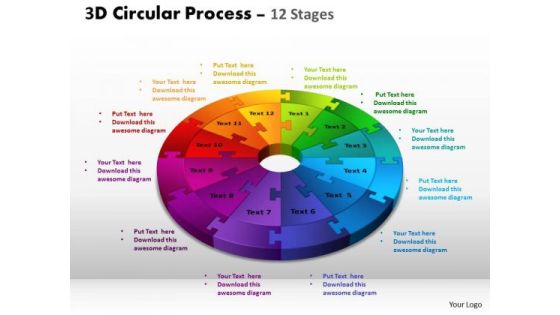
Sales Diagram 3d Circular Process Cycle Diagram Chart 12 Stages Strategic Management
Dominate Proceedings With Your Ideas. Our Sales Diagram 3D Circular Process Cycle Diagram Chart 12 Stages Strategic Management Powerpoint Templates Will Empower Your Thoughts.

Sales Diagram 3d Cycle Process Flow Chart 12 Stages Mba Models And Frameworks
Establish Your Dominion With Our Sales Diagram 3D Cycle Process Flow Chart 12 Stages MBA models and frameworks Powerpoint Templates. Rule The Stage With Your Thoughts.
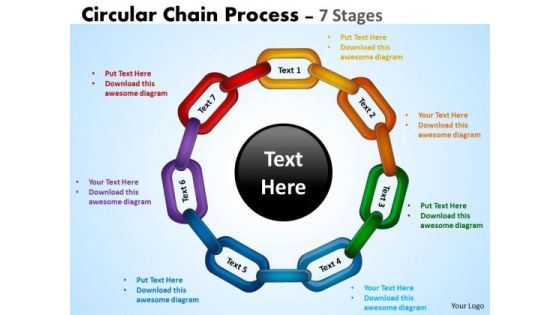
Mba Models And Frameworks Circular Chain Flowchart Process Diagram 7 Stages Sales Diagram
Be The Doer With Our MBA Models And Frameworks Circular Chain Flowchart Process Diagram 7 Stages Sales Diagram Powerpoint Templates. Put Your Thoughts Into Practice.
Sales Diagram Monitoring Of Supply Chain Activities Mba Models And Frameworks
Get The Doers Into Action. Activate Them With Our Sales Diagram Monitoring Of Supply Chain Activities MBA Models And Frameworks Powerpoint Templates.
Sales Diagram Circular Chain Flowchart Process Diagram 8 Stages Business Framework Model
Put In A Dollop Of Our Sales Diagram Circular Chain Flowchart Process Diagram 8 Stages Business Framework Model Powerpoint Templates. Give Your Thoughts A Distinctive Flavor.

Sales Diagram Circular Chain Flowchart Process Diagram 9 Stages Consulting Diagram
Our Sales Diagram Circular Chain Flowchart Process Diagram 9 Stages Consulting Diagram Powerpoint Templates Team Are A Dogged Lot. They Keep At It Till They Get It Right.

Business Framework Model Winners Podium With Trophy And Medal Sales Diagram
Get The Domestics Right With Our Business Framework Model Winners Podium With Trophy And Medal Sales Diagram Powerpoint Templates. Create The Base For Thoughts To Grow.
Sales Diagram Winners Podium With Trophy And Medal Business Framework Model
With Our Sales Diagram Winners Podium With Trophy And Medal Business Framework Model Powerpoint Templates You Will Be Doubly Sure. They Possess That Stamp Of Authority.

Mba Models And Frameworks Happy Face Smiley Reading Book Sales Diagram
Plan For All Contingencies With Our MBA Models And Frameworks Happy Face Smiley Reading Book Sales Diagram Powerpoint Templates. Douse The Fire Before It Catches.
Business Framework Model Results Display On Timeline Roadmap Diagram Sales Diagram
Your Listeners Will Never Doodle. Our Business Framework Model Results Display On Timeline Roadmap Diagram Sales Diagram Power point Templates Will Hold Their Concentration.

Business Diagram Customer Testimonials Quotes PowerPoint Slides And Diagrams Sales Diagram
Document Your Views On Our Business Diagram Customer Testimonials Quotes Powerpoint Slides And Diagrams Sales Diagram power point Templates. They Will Create A Strong Impression.

Mba Models And Frameworks Customer Testimonials Quotes PowerPoint Slides And Diagrams Sales Diagram
Establish The Dominance Of Your Ideas. Our MBA Models And Frameworks Customer Testimonials Quotes Powerpoint Slides And Diagrams Sales Diagram power point Templates Will Put Them On Top.

Sales Diagram 3d Puzzle Linear Flow Process 3 Stages Consulting Diagram
Be The Doer With Our Sales Diagram 3D Puzzle Linear Flow Process 3 Stages Consulting Diagram Powerpoint Templates. Put Your Thoughts Into Practice.
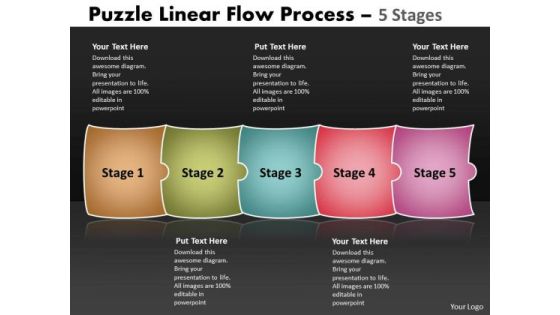
Business Framework Model Puzzle Linear Flow Process 5 Stages Sales Diagram
Document The Process On Our Business Framework Model Puzzle Linear Flow Process 5 Stages Sales Diagram Powerpoint Templates. Make A Record Of Every Detail.

Strategic Management 3d Puzzle Linear Flow Process 5 Stages Sales Diagram
Get The Doers Into Action. Activate Them With Our Strategic Management 3D Puzzle Linear Flow Process 5 Stages Sales Diagram Powerpoint Templates.

Business Framework Model Puzzle Linear Flow Process 8 Stages Sales Diagram
Document Your Views On Our Business Framework Model Puzzle Linear Flow Process 8 Stages Sales Diagram Powerpoint Templates. They Will Create A Strong Impression.

Business Cycle Diagram Four Staged Text Boxes With Agenda Sales Diagram
Get Out Of The Dock With Our Business Cycle Diagram Four Staged Text Boxes With Agenda Sales Diagram Powerpoint Templates. Your Mind Will Be Set Free.

Thank You Sales Methods And Techniques Ppt PowerPoint Presentation Portfolio Summary
This is a thank you sales methods and techniques ppt powerpoint presentation portfolio summary. This is a one stage process. The stages in this process are thank you.

Client Oriented Approach Execution In Sales Process Ppt PowerPoint Presentation File Ideas PDF
Presenting this set of slides with name client oriented approach execution in sales process ppt powerpoint presentation file ideas pdf. This is a seven stage process. The stages in this process are pre sales, sales, post sales, understand your needs solution customization, consultation with clients on needs solution matching, solution implementation, claims management and liaison with insurance companies, review and claims analysis, management of renewal process. This is a completely editable PowerPoint presentation and is available for immediate download. Download now and impress your audience.

Evaluating Rank Prospects Leads Scores Labeling Based On Sales Action Ppt Infographics Graphics Tutorials PDF
This slide portrays information regarding the labeling system that firm use to address various leads based on their sales actions. Sales representatives will determine whether the lead is sales or ready using visual cues by addressing leads key behaviors. Deliver an awe-inspiring pitch with this creative evaluating rank prospects leads scores labeling based on sales action ppt infographics graphics tutorials pdf bundle. Topics like lead, account, last interesting moment, status header, engagement can be discussed with this completely editable template. It is available for immediate download depending on the needs and requirements of the user.

How To Build A Revenue Funnel Leads Scores Labeling Based On Sales Action Guidelines PDF
This slide portrays information regarding the labeling system that firm use to address various leads based on their sales actions. Sales representatives will determine whether the lead is sales ready using visual cues by addressing leads key behaviors. Deliver an awe inspiring pitch with this creative how to build a revenue funnel leads scores labeling based on sales action guidelines pdf bundle. Topics like pricing, account, enterprise, analysis can be discussed with this completely editable template. It is available for immediate download depending on the needs and requirements of the user.
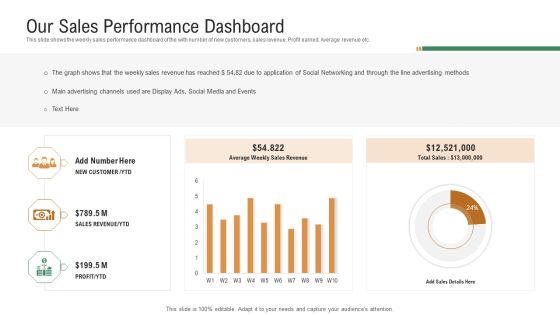
Investor Pitch Deck To Generate Venture Capital Funds Our Sales Performance Dashboard Ppt Show Format PDF
This slide shows the weekly sales performance dashboard of the with number of new customers, sales revenue, Profit earned, Average revenue etc. Deliver and pitch your topic in the best possible manner with this investor pitch deck to generate venture capital funds our sales performance dashboard ppt show format pdf. Use them to share invaluable insights on sales revenue, profit, main advertising channels, social networking, advertising methods and impress your audience. This template can be altered and modified as per your expectations. So, grab it now.

Addressing Sales And Distribution Channels For Customer Reach Ppt Professional Graphics Pictures PDF
This slide caters details about various sources or channels for sales and distribution in for customer outreach through online sales, retail, partners marketing and advertising. Presenting addressing sales and distribution channels for customer reach ppt professional graphics pictures pdf to provide visual cues and insights. Share and navigate important information on four stages that need your due attention. This template can be used to pitch topics like online sales, retail, marketing and advertising. In addtion, this PPT design contains high resolution images, graphics, etc, that are easily editable and available for immediate download.

QC Engineering Year Over Year Sales Highlights Ppt Styles Design Inspiration PDF
Mentioned slide illustrates sales performance stats of the firm over last three years. Here the graph indicates that sales performance of the firm gets declined in FY23 as compared to stats of FY22 and FY21. Deliver an awe inspiring pitch with this creative qc engineering year over year sales highlights ppt styles design inspiration pdf bundle. Topics like year over year sales highlights can be discussed with this completely editable template. It is available for immediate download depending on the needs and requirements of the user.

Past Trends In Sales Of ABC Carbonated Drink Company Globally Ppt Styles Master Slide PDF
This slide shows the past trends in sales of ABC Carbonated Beverage Company worldwide. The graph shows a constant decline in sales since 2017. Deliver and pitch your topic in the best possible manner with this past trends in sales of abc carbonated drink company globally ppt styles master slide pdf. Use them to share invaluable insights on past trends in sales of abc carbonated drink company globally and impress your audience. This template can be altered and modified as per your expectations. So, grab it now.

Master Plan For Opening Bistro Annual Sales Forecast Projection For Three Years Themes PDF
This slide shows the annual sales forecast projection for three years which includes products, cost of sales, gross margin, etc. Presenting master plan for opening bistro annual sales forecast projection for three years themes pdf to provide visual cues and insights. Share and navigate important information on one stages that need your due attention. This template can be used to pitch topics like annual sales forecast projection for three years. In addtion, this PPT design contains high resolution images, graphics, etc, that are easily editable and available for immediate download.
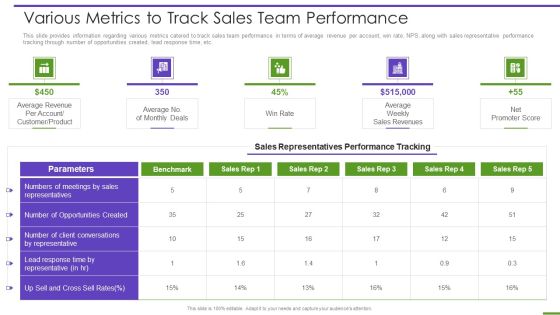
Marketing Playbook To Maximize ROI Various Metrics To Track Sales Team Performance Demonstration PDF
This slide provides information regarding various metrics catered to track sales team performance in terms of average revenue per account, win rate, NPS, along with sales representative performance tracking through number of opportunities created, lead response time, etc. Deliver an awe inspiring pitch with this creative marketing playbook to maximize roi various metrics to track sales team performance demonstration pdf bundle. Topics like various metrics to track sales team performance can be discussed with this completely editable template. It is available for immediate download depending on the needs and requirements of the user.

B2B Customers Journey Playbook Different Ways To Optimize Return On Sales Content Slides PDF
This slide provides information regarding different ways to optimize returns on sales content in terms of upgraded content generation process, reorganized sales content and organized content targeting, delivery and measurement. Deliver an awe inspiring pitch with this creative b2b customers journey playbook different ways to optimize return on sales content slides pdf bundle. Topics like upgrade content generation process, reorganizing sales content, organizing content targeting, delivery and measurement can be discussed with this completely editable template. It is available for immediate download depending on the needs and requirements of the user.
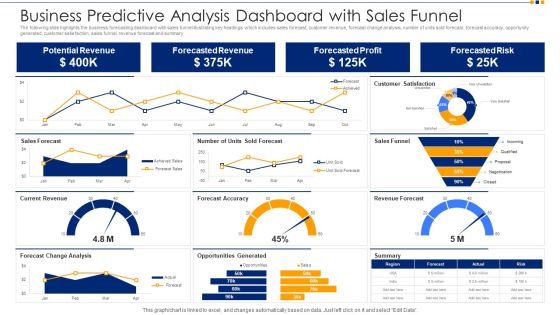
Business Predictive Analysis Dashboard With Sales Funnel Ppt Show Images PDF
The following slide highlights the business forecasting dashboard with sales funnel illustrating key headings which includes sales forecast, customer revenue, forecast change analysis, number of units sold forecast, forecast accuracy, opportunity generated, customer satisfaction, sales funnel, revenue forecast and summary. Pitch your topic with ease and precision using this business predictive analysis dashboard with sales funnel ppt show images pdf. This layout presents information on potential revenue, forecasted revenue, forecasted profit, forecasted risk. It is also available for immediate download and adjustment. So, changes can be made in the color, design, graphics or any other component to create a unique layout.

Business Sales Comparison With Actual And Predictive Data Ppt Model Slide PDF
The following slide highlights the annual sales forecast report for business illustrating key headings which includes product, last year, forecast, actual, number of customers, average sales per customer and net sales. Showcasing this set of slides titled business sales comparison with actual and predictive data ppt model slide pdf. The topics addressed in these templates are antivirus protection, cloud solutions, system controls. All the content presented in this PPT design is completely editable. Download it and make adjustments in color, background, font etc. as per your unique business setting.
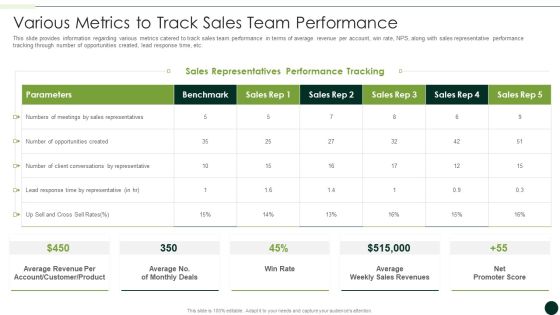
Salesman Principles Playbook Various Metrics To Track Sales Team Performance Summary PDF
This slide provides information regarding various metrics catered to track sales team performance in terms of average revenue per account, win rate, NPS, along with sales representative performance tracking through number of opportunities created, lead response time, etc. Deliver an awe inspiring pitch with this creative salesman principles playbook various metrics to track sales team performance summary pdf bundle. Topics like various metrics to track sales team performance can be discussed with this completely editable template. It is available for immediate download depending on the needs and requirements of the user.

Business To Business Account Metrices To Track Sales Team Performance Background PDF
This slide provides information regarding various metrics catered to track sales team performance in terms of average revenue per account, win rate, NPS, along with sales representative performance tracking through number of opportunities created, lead response time, etc. Deliver an awe inspiring pitch with this creative Business To Business Account Metrices To Track Sales Team Performance Background PDF bundle. Topics like Average Revenue Per Account, Customer, Product, Sales Representatives Performance Tracking can be discussed with this completely editable template. It is available for immediate download depending on the needs and requirements of the user.
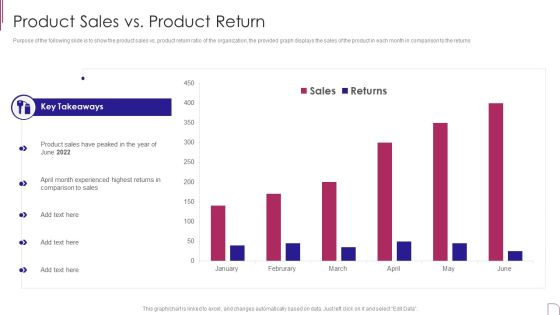
Yearly Product Performance Assessment Repor Product Sales Vs Product Return Information PDF
Purpose of the following slide is to show the product sales vs. product return ratio of the organization, the provided graph displays the sales of the product in each month in comparison to the returns.Deliver an awe inspiring pitch with this creative Yearly Product Performance Assessment Repor Product Sales Vs Product Return Information PDF bundle. Topics like Key Takeaways, Experienced Highest, Comparison Sales can be discussed with this completely editable template. It is available for immediate download depending on the needs and requirements of the user.

Business Monthly Sales Report Summary Dashboard With Churn Rate Background PDF
The following slide highlights the monthly sales report dashboard with churn rate. It showcases details for current month sales, total revenue, current month profit, current month cost, sales revenue, current month expense, revenue churn rate and accumulated revenue.Pitch your topic with ease and precision using this Business Monthly Sales Report Summary Dashboard With Churn Rate Background PDF This layout presents information on Total Revenue, Accumulated Revenue, Marketing Medium It is also available for immediate download and adjustment. So, changes can be made in the color, design, graphics or any other component to create a unique layout.

Sales Team Report To Identify Employees With Low Output Brochure PDF
This slide depicts the analysis report formulated by sales team to track employee productiveness and pinpoint underproductive members. It considers target vs actual sales and target vs actual hours worked and performance status. Showcasing this set of slides titled Sales Team Report To Identify Employees With Low Output Brochure PDF. The topics addressed in these templates are Target Sales, Target Hours, Actual Hours. All the content presented in this PPT design is completely editable. Download it and make adjustments in color, background, font etc. as per your unique business setting.

Data Processing Services Delivery Machine Learning Solutions For Sales And Marketing Introduction PDF
This template covers the Machine Learning Solutions for sales and marketing team such as Machine learning employs a learning algorithm to examine prior CRM or ERP data in order to determine the best pricing optimization method. Presenting Data Processing Services Delivery Machine Learning Solutions For Sales And Marketing Introduction PDF to provide visual cues and insights. Share and navigate important information on one stages that need your due attention. This template can be used to pitch topics like Sales Executives, Historical Data, Sales Team, Considerable Time. In addtion, this PPT design contains high resolution images, graphics, etc, that are easily editable and available for immediate download.

Business Performance Review Report To Evaluate Performance Of Sales Rep Infographics PDF
The following slide highlights quarterly business review QBR report which can be used by firm to evaluate the efficiency of sales rep. information covered in this slide is related to total sales by employees in different quarters, number of calls made. Pitch your topic with ease and precision using this Business Performance Review Report To Evaluate Performance Of Sales Rep Infographics PDF. This layout presents information on Revenue Sales, Tim Paine, Number Colds Calls. It is also available for immediate download and adjustment. So, changes can be made in the color, design, graphics or any other component to create a unique layout.

Global Automobile Sector Overview Global Electric Vehicle Sales With Market Share In 2021 Designs PDF
This slide covers the graphical representation of the global EV market share along with BEV and PHEV sales. It also includes key insights about the global plugin electric car sales, chinas share in global EV sales, etc. Deliver and pitch your topic in the best possible manner with this Global Automobile Sector Overview Global Electric Vehicle Sales With Market Share In 2021 Designs PDF. Use them to share invaluable insights on Electric Vehicles, Battery Electric, Electric Vehicle and impress your audience. This template can be altered and modified as per your expectations. So, grab it now.
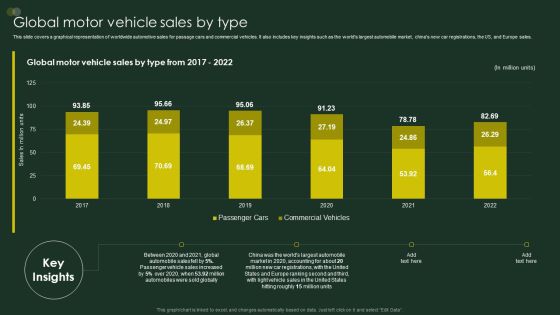
Global Automobile Sector Overview Global Motor Vehicle Sales By Type Mockup PDF
This slide covers a graphical representation of worldwide automotive sales for passage cars and commercial vehicles. It also includes key insights such as the worlds largest automobile market, chinas new car registrations, the US, and Europe sales. Deliver an awe inspiring pitch with this creative Global Automobile Sector Overview Global Motor Vehicle Sales By Type Mockup PDF bundle. Topics like Automobile Sales, Automobiles Were, Hitting Roughly can be discussed with this completely editable template. It is available for immediate download depending on the needs and requirements of the user.
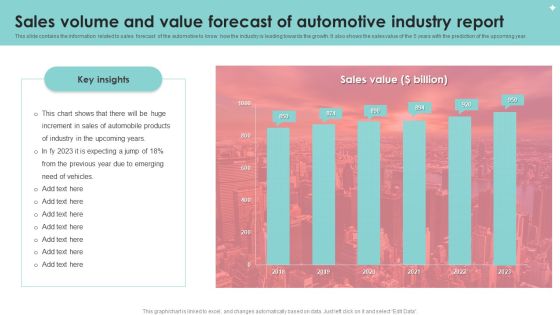
Sales Volume And Value Forecast Of Automotive Industry Report Diagrams PDF
This slide contains the information related to sales forecast of the automotive to know how the industry is leading towards the growth. It also shows the sales value of the 5 years with the prediction of the upcoming year. Showcasing this set of slides titled Sales Volume And Value Forecast Of Automotive Industry Report Diagrams PDF. The topics addressed in these templates are Sales Volume, Value Forecast, Automotive Industry Report. All the content presented in this PPT design is completely editable. Download it and make adjustments in color, background, font etc. as per your unique business setting.
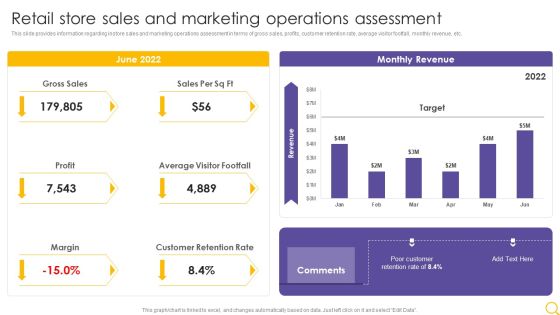
Retail Outlet Operational Efficiency Analytics Retail Store Sales And Marketing Operations Assessment Designs PDF
This slide provides information regarding instore sales and marketing operations assessment in terms of gross sales, profits, customer retention rate, average visitor footfall, monthly revenue, etc. Deliver and pitch your topic in the best possible manner with this Retail Outlet Operational Efficiency Analytics Retail Store Sales And Marketing Operations Assessment Designs PDF. Use them to share invaluable insights on Gross Sales, Profit, Average Visitor Footfall and impress your audience. This template can be altered and modified as per your expectations. So, grab it now.

Retail Outlet Operational Efficiency Analytics Sales Dashboards For Retail Store Inspiration PDF
This slide illustrates the dashboard retail store sales forecasting providing information regarding sales per employee, price unit every transaction, total number of customers and average value of customer transaction. Deliver and pitch your topic in the best possible manner with this Retail Outlet Operational Efficiency Analytics Sales Dashboards For Retail Store Inspiration PDF. Use them to share invaluable insights on Gross Sales, Total No Customers, Value Customer and impress your audience. This template can be altered and modified as per your expectations. So, grab it now.

5 Years Sales And Profit Growth Comparative Analysis Chart Of Private Banks Infographics PDF
This slide shows the table representing the comparison between sales and profit growth of five years of various private banks. It includes details related to names of private banks and their five years sales growth and profit growth. Pitch your topic with ease and precision using this 5 Years Sales And Profit Growth Comparative Analysis Chart Of Private Banks Infographics PDF. This layout presents information on Private Banks, Sales Growth, Profit Growth. It is also available for immediate download and adjustment. So, changes can be made in the color, design, graphics or any other component to create a unique layout.

New Product Sales Assessment Summary Tips Ppt PowerPoint Presentation Visual Aids Example 2015 PDF
This slide showcase analysis of new product sales report for optimizing sales process. It include product feature, durability, temperature resistance, water resistance, price and consumer rating.Pitch your topic with ease and precision using this New Product Sales Assessment Summary Tips Ppt PowerPoint Presentation Visual Aids Example 2015 PDF. This layout presents information on New Product, Sales Assessment Summary. It is also available for immediate download and adjustment. So, changes can be made in the color, design, graphics or any other component to create a unique layout.

Unit Market And Earnings Share From Brand Product Sales Clipart PDF
This slide covers market share and revenue earned from multi brands. It also includes number of sales along with percentage of revenue market share. Pitch your topic with ease and precision using this Unit Market And Earnings Share From Brand Product Sales Clipart PDF. This layout presents information on Unit Sales, Unit Market Share, Sales Revenue. It is also available for immediate download and adjustment. So, changes can be made in the color, design, graphics or any other component to create a unique layout.
