Sales Icons

Monthly Internal Corporate Audit Schedule Plan Formats PDF
This slide covers audit review schedule plan on month basis. It includes process review of customer requirements, design, development, purchasing, etc. Presenting Monthly Internal Corporate Audit Schedule Plan Formats PDF to dispense important information. This template comprises one stages. It also presents valuable insights into the topics including Purchasing, Customer Requirements, Design And Development. This is a completely customizable PowerPoint theme that can be put to use immediately. So, download it and address the topic impactfully.
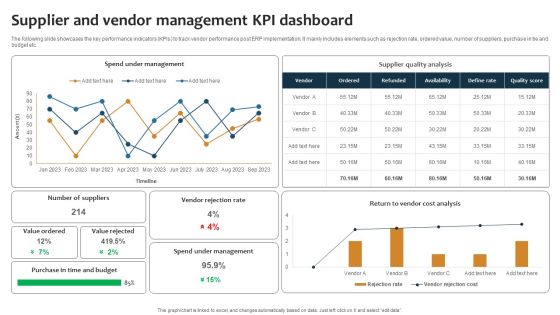
Improving Business Procedures Enterprise Resource Planning System Supplier And Vendor Management Ideas PDF
The following slide showcases the key performance indicators KPIs to track vendor performance post ERP implementation. It mainly includes elements such as rejection rate, ordered value, number of suppliers, purchase in tie and budget etc. Do you know about Slidesgeeks Improving Business Procedures Enterprise Resource Planning System Supplier And Vendor Management Ideas PDF. These are perfect for delivering any kind od presentation. Using it, create PowerPoint presentations that communicate your ideas and engage audiences. Save time and effort by using our pre designed presentation templates that are perfect for a wide range of topic. Our vast selection of designs covers a range of styles, from creative to business, and are all highly customizable and easy to edit. Download as a PowerPoint template or use them as Google Slides themes.
Strategic Toolkit For Brand Performance Enhancement Overall Brand Performance Tracking Dashboard Professional PDF
This slide provides information regarding brand performance tracking dashboard capturing KPIs such as brand metric, brand commitment, advertising metrics, and purchase metrics. Whether you have daily or monthly meetings, a brilliant presentation is necessary. Strategic Toolkit For Brand Performance Enhancement Overall Brand Performance Tracking Dashboard Professional PDF can be your best option for delivering a presentation. Represent everything in detail using Strategic Toolkit For Brand Performance Enhancement Overall Brand Performance Tracking Dashboard Professional PDF and make yourself stand out in meetings. The template is versatile and follows a structure that will cater to your requirements. All the templates prepared by Slidegeeks are easy to download and edit. Our research experts have taken care of the corporate themes as well. So, give it a try and see the results.

Gantt Chart Presenting IT Risk Control Strategies Project Risk Management Sample PDF
This slide shows the gantt chart that represents the IT project risk management which covers the project tasks such as contracts, design and procurement with proposals, documents review, feasibility study, apply for permission, initiating design work, ordering equipment and items. Showcasing this set of slides titled Gantt Chart Presenting IT Risk Control Strategies Project Risk Management Sample PDF. The topics addressed in these templates are IT Project Tasks, Reviewing Documents, Conduct Feasibility Study. All the content presented in this PPT design is completely editable. Download it and make adjustments in color, background, font etc. as per your unique business setting.

Convertible Note Pitch Deck Funding Strategy Financial Graph Historical And Projection Ppt PowerPoint Presentation Infographics Layouts PDF
Presenting this set of slides with name convertible note pitch deck funding strategy financial graph historical and projection ppt powerpoint presentation infographics layouts pdf. The topics discussed in these slides are financials, revenue, operating income, net income, forecasted. This is a completely editable PowerPoint presentation and is available for immediate download. Download now and impress your audience.

Convertible Market Notes Financial Graph Historical And Projection Ppt Summary Show PDF
Deliver an awe inspiring pitch with this creative convertible market notes financial graph historical and projection ppt summary show pdf bundle. Topics like revenue, operating income, net income, financial can be discussed with this completely editable template. It is available for immediate download depending on the needs and requirements of the user.
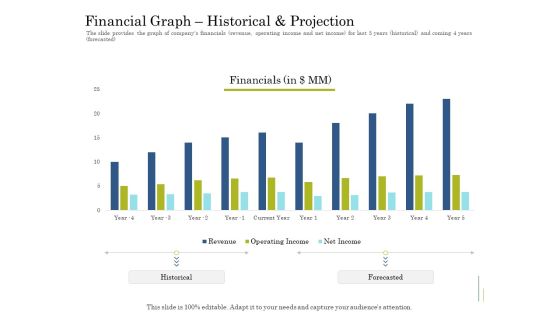
Supplementary Debt Financing Pitch Deck Financial Graph Historical And Projection Brochure PDF
Deliver an awe inspiring pitch with this creative supplementary debt financing pitch deck financial graph historical and projection brochure pdf bundle. Topics like financial, revenue, operating income, net income can be discussed with this completely editable template. It is available for immediate download depending on the needs and requirements of the user.

Convertible Debt Financing Pitch Deck Financial Graph Historical And Projection Clipart PDF
Deliver an awe-inspiring pitch with this creative convertible debt financing pitch deck financial graph historical and projection clipart pdf bundle. Topics like revenue, operating income, net income can be discussed with this completely editable template. It is available for immediate download depending on the needs and requirements of the user.
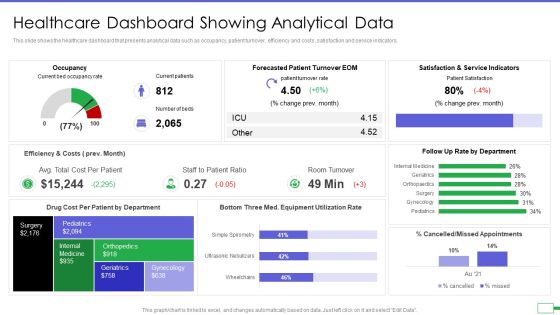
Iot And Digital Twin To Reduce Costs Post Covid Healthcare Dashboard Showing Analytical Data Elements PDF
This slide shows the healthcare dashboard that presents analytical data such as occupancy, patient turnover, efficiency and costs, satisfaction and service indicators. Deliver and pitch your topic in the best possible manner with this iot and digital twin to reduce costs post covid healthcare dashboard showing analytical data elements pdf. Use them to share invaluable insights on occupancy, patient turnover, efficiency and costs, satisfaction and service indicators and impress your audience. This template can be altered and modified as per your expectations. So, grab it now.

Hiring Project Periodically Analytics Dashboard Summary PDF
The following slide highlights the hiring project quarterly analytics dashboard illustrating gender distribution, hiring by gender, turnover by gender, ethnicity distribution, hires by ethnicity and turnover by ethnicity. It assist organization to assess the diversity in company Showcasing this set of slides titled hiring project periodically analytics dashboard summary pdf. The topics addressed in these templates are hiring project periodically analytics dashboard. All the content presented in this PPT design is completely editable. Download it and make adjustments in color, background, font etc. as per your unique business setting.

Workforce Department Performance Graph Ppt Model Graphics Pictures PDF
This slide shows performance graph of HR department. Information covered in this slide is related to total hirings and turnover in the last four years. Pitch your topic with ease and precision using this Workforce Department Performance Graph Ppt Model Graphics Pictures PDF. This layout presents information on New Hiring, Continuous Increase, Employee Turnover, 2019 To 2022. It is also available for immediate download and adjustment. So, changes can be made in the color, design, graphics or any other component to create a unique layout.

Actual And Target Stock Ratio Comparison Ppt Visual Aids Ideas PDF
This slide shows the difference between actual Stock ratio and target in last eight months. No sudden increase or decrease has been observed in turnover ratio through out this time. Showcasing this set of slides titled Actual And Target Stock Ratio Comparison Ppt Visual Aids Ideas PDF. The topics addressed in these templates are Turnover Ratio, Price, 2015 To 2022. All the content presented in this PPT design is completely editable. Download it and make adjustments in color, background, font etc. as per your unique business setting.

Impact Of Effective Improving Human Resources Communication On HR Talent Management System Designs PDF
This slide represents dashboard showing the impact of effective communication on talent management by the human resource team of the organization. It shows details related to employees, monthly salaries, vacancies, hiring stats, talent turnover rate, fired talents, talent satisfaction and their ratings. Showcasing this set of slides titled Impact Of Effective Improving Human Resources Communication On HR Talent Management System Designs PDF. The topics addressed in these templates are Talent Management, Talent Turnover Rate, Talent Rating. All the content presented in this PPT design is completely editable. Download it and make adjustments in color, background, font etc. as per your unique business setting.

Financial Highlights For Construction Company Yearly Report Template PDF
This slide showcases report for construction company annual financial highlights that can help in analyzing the financial health of organization and help investors to make informed decisions. It outlines information about turnover, profit before tax, profit after, equity capital and reserves. Pitch your topic with ease and precision using this Financial Highlights For Construction Company Yearly Report Template PDF. This layout presents information on Reserve And Surplus, Profit, Turnover. It is also available for immediate download and adjustment. So, changes can be made in the color, design, graphics or any other component to create a unique layout.

Dashboard For Big Healthcare Data Analytics Graphics PDF
This slide showcase the dashboard for big data analytics in healthcare. It includes elements such as bed occupancy rate, patient turnover rate, efficiency and costs, missed and cancelled appointment rate. Showcasing this set of slides titled Dashboard For Big Healthcare Data Analytics Graphics PDF. The topics addressed in these templates are Satisfaction Service Indicators, Occupancy, Forecasted Patient Turnover. All the content presented in this PPT design is completely editable. Download it and make adjustments in color, background, font etc. as per your unique business setting.
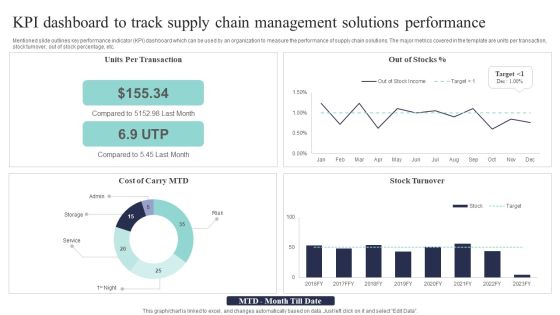
KPI Dashboard To Track Supply Chain Management Solutions Performance Background PDF
Mentioned slide outlines key performance indicator KPI dashboard which can be used by an organization to measure the performance of supply chain solutions. The major metrics covered in the template are units per transaction, stock turnover, out of stock percentage, etc. Pitch your topic with ease and precision using this KPI Dashboard To Track Supply Chain Management Solutions Performance Background PDF. This layout presents information on Per Transaction, Compared Last, Stock Turnover. It is also available for immediate download and adjustment. So, changes can be made in the color, design, graphics or any other component to create a unique layout.
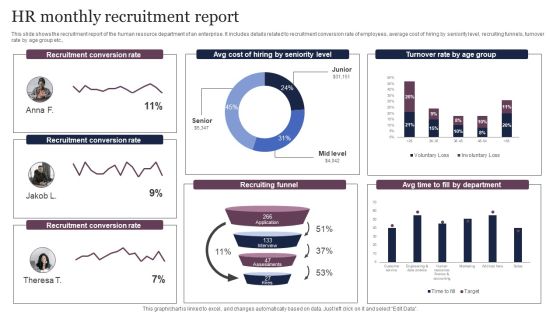
HR Monthly Recruitment Report Inspiration PDF
This slide shows the recruitment report of the human resource department of an enterprise. It includes details related to recruitment conversion rate of employees, average cost of hiring by seniority level, recruiting funnels, turnover rate by age group etc. Showcasing this set of slides titled HR Monthly Recruitment Report Inspiration PDF. The topics addressed in these templates are Recruitment Conversion Rate, Cost, Turnover Rate. All the content presented in this PPT design is completely editable. Download it and make adjustments in color, background, font etc. as per your unique business setting.

Creating Employee Value Proposition Statistics Showing Effectiveness Of Employee Value Ideas PDF
The slide outlines impact of building strong and attractive employee value proposition on business. It provides information about need of compensation premium to recruit workers, categories of compensation premium, annual turnover, attraction savings and turnover cost savings. There are so many reasons you need a Creating Employee Value Proposition Statistics Showing Effectiveness Of Employee Value Ideas PDF. The first reason is you cant spend time making everything from scratch, Thus, Slidegeeks has made presentation templates for you too. You can easily download these templates from our website easily.

Corporate Conditions And Evaluation Survey Summary Report Survey SS
Following slide demonstrates summarized report for business insights and conditions to evaluate business cost efficiency. It includes key elements such as present and future demand for products and services offered and present and future business turnover assessment. Showcasing this set of slides titled Corporate Conditions And Evaluation Survey Summary Report Survey SS. The topics addressed in these templates are Business Turnover Insights, Demand For Goods And Services. All the content presented in this PPT design is completely editable. Download it and make adjustments in color, background, font etc. as per your unique business setting.

Identifying The Need For Warehouse Performance Management Ideas PDF
This slide identifies the current challenges leading to decline in business performance and suggest solution for optimizing the same. It also analyzes warehouse inventory turnover and identifies gap between the target state and actual turnover rate. There are so many reasons you need a Identifying The Need For Warehouse Performance Management Ideas PDF. The first reason is you can not spend time making everything from scratch, Thus, Slidegeeks has made presentation templates for you too. You can easily download these templates from our website easily.
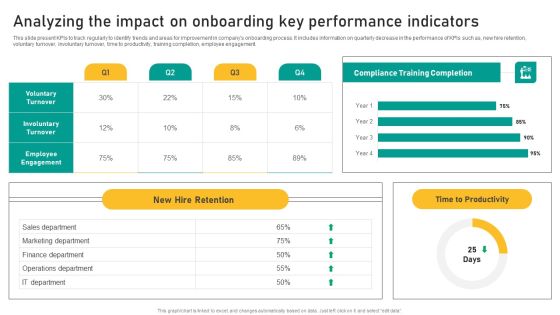
Talent Retention Initiatives For New Hire Onboarding Analyzing The Impact On Onboarding Background PDF
This slide present KPIs to track regularly to identify trends and areas for improvement in companys onboarding process. It includes information on quarterly decrease in the performance of KPIs such as, new hire retention, voluntary turnover, involuntary turnover, time to productivity, training completion, employee engagement. Find a pre designed and impeccable Talent Retention Initiatives For New Hire Onboarding Analyzing The Impact On Onboarding Background PDF. The templates can ace your presentation without additional effort. You can download these easy to edit presentation templates to make your presentation stand out from others. So, what are you waiting for Download the template from Slidegeeks today and give a unique touch to your presentation.

KPI Dashboard To Monitor Workforce Diversity Data And Inclusion Of IT Firm Slides PDF
Following slide demonstrates KPI dashboard to track diversity and inclusion which can be used by managers to develop workforce for business . It includes elements such as hiring data diversity, performance rating, promotion rate, promotion percentage, employee turnover, top management gender diversity, etc. Showcasing this set of slides titled KPI Dashboard To Monitor Workforce Diversity Data And Inclusion Of IT Firm Slides PDF. The topics addressed in these templates are Employee Turnover, Management, Promotion Rate. All the content presented in this PPT design is completely editable. Download it and make adjustments in color, background, font etc. as per your unique business setting.

Dashboard Illustrating Attrition Risk And Expenses Of Employee Attrition Clipart PDF
This slide represents a dashboard that help predict attrition risks and turnover costs incurred by companies. It includes various aspects such as current high risk employees, key prospects at high risk for leaving, cost of turnover, risk by country, etc. Pitch your topic with ease and precision using this Dashboard Illustrating Attrition Risk And Expenses Of Employee Attrition Clipart PDF. This layout presents information on Dashboard Illustrating Attrition Risk, Expenses Of Employee Attrition . It is also available for immediate download and adjustment. So, changes can be made in the color, design, graphics or any other component to create a unique layout.
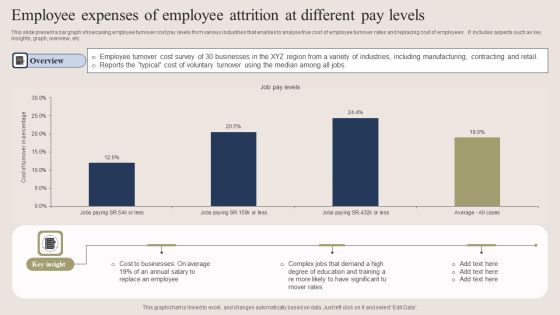
Employee Expenses Of Employee Attrition At Different Pay Levels Formats PDF
This slide present a bar graph showcasing employee turnover cost pay levels from various industries that enables to analyse true cost of employee turnover rates and replacing cost of employees . It includes aspects such as key insights, graph, overview, etc. Showcasing this set of slides titled Employee Expenses Of Employee Attrition At Different Pay Levels Formats PDF. The topics addressed in these templates are Cost To Businesses, Average, Employee. All the content presented in this PPT design is completely editable. Download it and make adjustments in color, background, font etc. as per your unique business setting.

Implementing Client Onboarding Process Utilizing User Experience Map For Improved Consumer Support Themes PDF
This slide provides glimpse about a customer experience journey map that can help our business to understand different potential customers and their motivations. It includes stages such as awareness, consideration, proposal, purchase, etc. Present like a pro with Implementing Client Onboarding Process Utilizing User Experience Map For Improved Consumer Support Themes PDF Create beautiful presentations together with your team, using our easy to use presentation slides. Share your ideas in real time and make changes on the fly by downloading our templates. So whether you are in the office, on the go, or in a remote location, you can stay in sync with your team and present your ideas with confidence. With Slidegeeks presentation got a whole lot easier. Grab these presentations today.

Introduction To Customer Reward Programs To Improve Client Loyalty Themes PDF
This slide covers an overview of customer loyalty programs to increase customer engagement and purchases in exchange for discounts and other benefits. It includes various types of programs, such as referrals, VIPs, and other loyalty programs. Present like a pro with Introduction To Customer Reward Programs To Improve Client Loyalty Themes PDF Create beautiful presentations together with your team, using our easy to use presentation slides. Share your ideas in real time and make changes on the fly by downloading our templates. So whether you are in the office, on the go, or in a remote location, you can stay in sync with your team and present your ideas with confidence. With Slidegeeks presentation got a whole lot easier. Grab these presentations today.

Business Diagram Arrows Around World Map For Geography Presentation Template
This PowerPoint template has been designed with arrows around world map. Use this image, in your presentations to express views on globalization, global business, world trade and global industry. This diagram slide will help you express your views to target audience.

Control Process For Supply Chain Segmentation Diagram Powerpoint Guide
This is a control process for supply chain segmentation diagram powerpoint guide. This is a twelve stage process. The stages in this process are dynamic trade offs, efficiency, cost, agility, speed, services, profits, likely no interest, very interested target, possible, aligned to value, control process for supply chain segmentation.
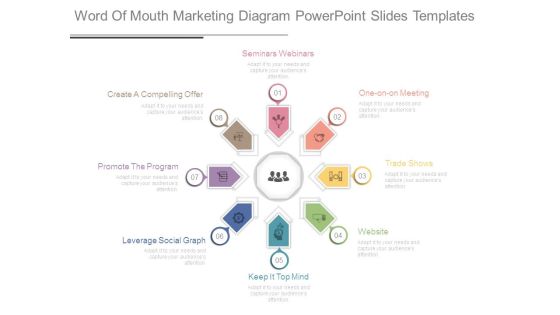
Word Of Mouth Marketing Diagram Powerpoint Slides Templates
This is a word of mouth marketing diagram powerpoint slides templates. This is a eight stage process. The stages in this process are create a compelling offer, promote the program, leverage social graph, keep it top mind, website, trade shows, one on one meeting, seminars webinars.

Web Based Quality Management System Diagram Presentation Ideas
This is a web based quality management system diagram presentation ideas. This is a six stage process. The stages in this process are audit management, trading management, deviation and incidents, complaint handling, supplier quality management, training management, effectively analysis, investigation, root cause analysis, capa, change control, adverse event reporting, product registration tracking.
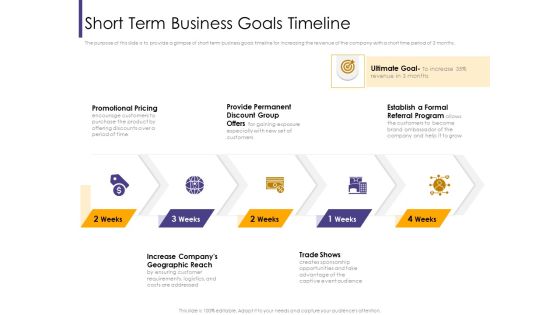
Progressive Short Term Business Goals Timeline Ppt Slides Diagrams PDF
Presenting this set of slides with name progressive short term business goals timeline ppt slides diagrams pdf. This is a five stage process. The stages in this process are promotional pricing, geographic reach, permanent, trade shows, referral program. This is a completely editable PowerPoint presentation and is available for immediate download. Download now and impress your audience.
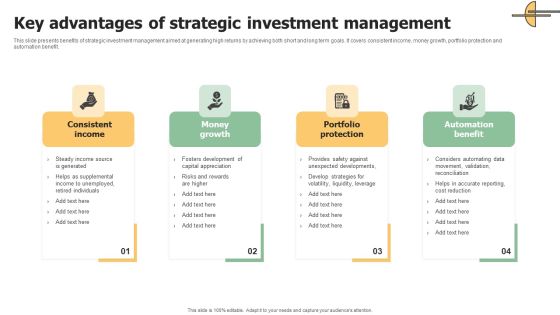
Key Advantages Of Strategic Investment Management Brochure PDF
This slide presents benefits of strategic investment management aimed at generating high returns by achieving both short and long term goals. It covers consistent income, money growth, portfolio protection and automation benefit. Presenting Key Advantages Of Strategic Investment Management Brochure PDF to dispense important information. This template comprises four stages. It also presents valuable insights into the topics including Automation Benefit, Portfolio Protection, Money Growth. This is a completely customizable PowerPoint theme that can be put to use immediately. So, download it and address the topic impactfully.
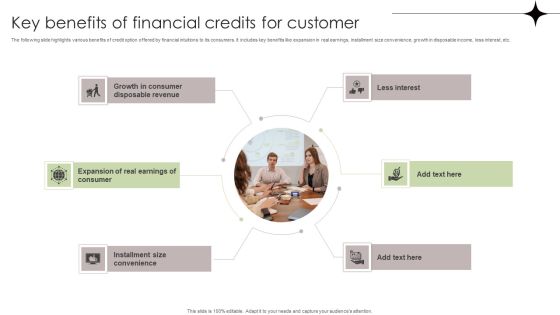
Key Benefits Of Financial Credits For Customer Elements PDF
The following slide highlights various benefits of credit option offered by financial intuitions to its consumers. It includes key benefits like expansion in real earnings, installment size convenience, growth in disposable income, less interest, etc. Presenting Key Benefits Of Financial Credits For Customer Elements PDF to dispense important information. This template comprises six stages. It also presents valuable insights into the topics including Less Interest, Growth, Installment Size Convenience. This is a completely customizable PowerPoint theme that can be put to use immediately. So, download it and address the topic impactfully.
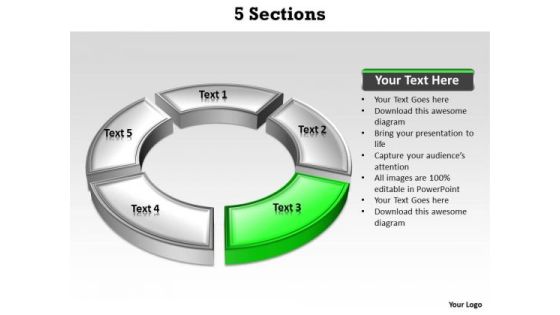
Ppt Green Section Highlighted In Circular PowerPoint Menu Template Manner Templates
PPT green section highlighted in circular powerpoint menu template manner Templates-This Diagram shows you the five factors responsible for economic growth in Business .It can be used for creating Business presentations where five factors combined to result in one factor.-Can be used for presentations on 5, around, arrows, border, center, circle, circular, concept, connect, connections, curve, cycle, distribution, five, flow, group, illustration, management, middle, objects, plan, process, recycle, rounded, sections, sectors, shape, symbol, workflow-PPT green section highlighted in circular powerpoint menu template manner Templates

Ppt Orange Section Highlighted In PowerPoint Presentation Circular Manner Templates
PPT orange section highlighted in powerpoint presentation circular manner Templates-This PowerPoint Diagram shows you the five factors responsible for economic growth in Business .It can be used for creating Business presentations where five factors combined to result in one factor. This illustrates orange part of the process.-Can be used for presentations on 5, around, arrows, border, center, circle, circular, concept, connect, connections, curve, cycle, distribution, five, flow, group, illustration, management, middle, objects, plan, process, recycle, rounded, sections, sectors, shape, symbol, vector, workflow-PPT orange section highlighted in powerpoint presentation circular manner Templates

Web Design Company Overview SWOT Analysis Diagrams PDF
This slide focuses on strengths, weakness, opportunities and threats to evaluate competitive position of our web design company which includes diverse services, global presence, projected market growth, etc This Web Design Company Overview SWOT Analysis Diagrams PDF is perfect for any presentation, be it in front of clients or colleagues. It is a versatile and stylish solution for organizing your meetings. The Web Design Company Overview SWOT Analysis Diagrams PDF features a modern design for your presentation meetings. The adjustable and customizable slides provide unlimited possibilities for acing up your presentation. Slidegeeks has done all the homework before launching the product for you. So, do not wait, grab the presentation templates today.

Why Training And Development Is Essential Key Tactics To Drive Employee High Performance Diagrams PDF
This slide covers need of training and development programs to drive employee performance. It involves reasons such as boost employee productivity, reduce employee turnover and improve company culture. Showcasing this set of slides titled Why Training And Development Is Essential Key Tactics To Drive Employee High Performance Diagrams PDF. The topics addressed in these templates are Boost Employee Productivity, Reduce Employee Turnover, Improve Company Culture. All the content presented in this PPT design is completely editable. Download it and make adjustments in color, background, font etc. as per your unique business setting.
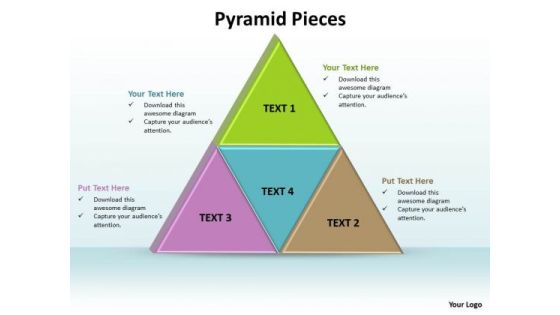
Ppt Pyramid Puzzle Pieces PowerPoint Template Or Components Templates
PPT pyramid puzzle pieces powerpoint template or components Templates--PowerPoint presentations on Abstract, Background, Business, Chart, Color, Conceptual, Design, Diagram, Graph, Graphic, Grow, Growth, Illustration, Layer, Level, Multicolored, Organization, Performance, Pile, Progress, Pyramid, Reflection, Render, Rendered, Section, Shape, Slice, Sliced, Statistics, Step, Structure-PPT pyramid puzzle pieces powerpoint template or components Templates
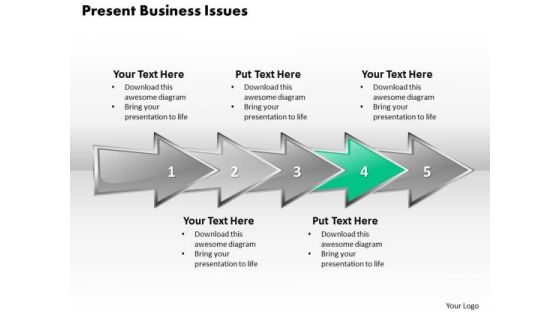
Ppt 3d Horizontal Abstraction To Present Business Issues Six Steps PowerPoint Templates
PPT 3d horizontal abstraction to present business issues six steps PowerPoint Templates-Use this 3D Arrow Diagram to Illustrate Processes Step by Step in PowerPoint Presentations -PPT 3d horizontal abstraction to present business issues six steps PowerPoint Templates-analysis, arrow, background, business, chart, communication, concept, construction, delivery, design, development, engineering, fabrication, feasibiliti, generated, growth, idea, industry, making, production, products, science, sequence, shape
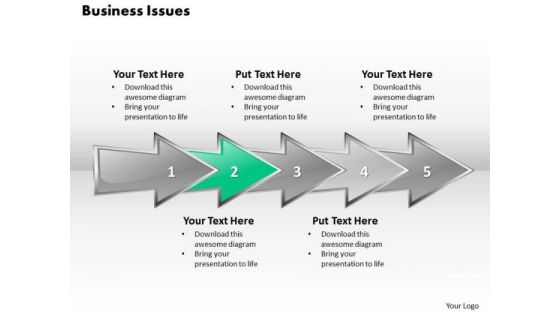
Ppt 3d Linear Abstraction To Demonstrate Business Issues Six Steps PowerPoint Templates
PPT 3d linear abstraction to demonstrate business issues six steps PowerPoint Templates-Use this 3D Arrow Diagram to Illustrate Processes Step by Step in PowerPoint Presentations -PPT 3d linear abstraction to demonstrate business issues six steps PowerPoint Templates-analysis, arrow, background, business, chart, communication, concept, construction, delivery, design, development, engineering, fabrication, feasibiliti, generated, growth, idea, industry, making, production, products, science, sequence, shape
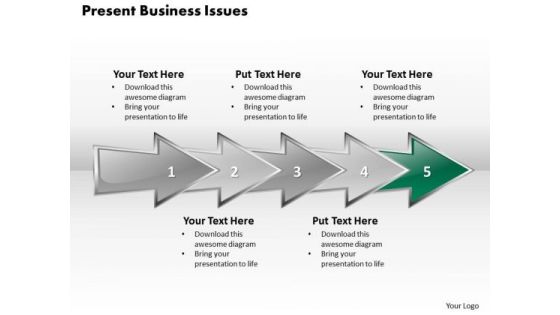
Ppt 3d Linear Abstraction To Present Business Issues Six Steps PowerPoint Templates
PPT 3d linear abstraction to present business issues six steps PowerPoint Templates-Use this 3D Arrow Diagram to Illustrate Processes Step by Step in PowerPoint Presentations -PPT 3d linear abstraction to present business issues six steps PowerPoint Templates-analysis, arrow, background, business, chart, communication, concept, construction, delivery, design, development, engineering, fabrication, feasibiliti, generated, growth, idea, industry, making, production, products, science, sequence, shape
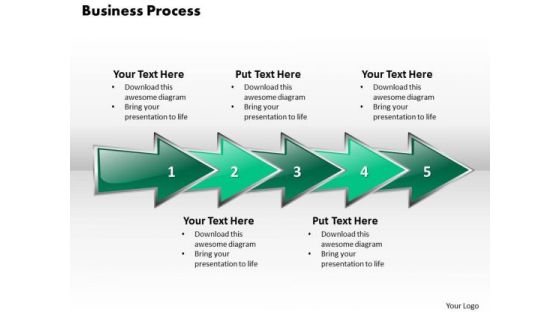
Ppt 3d Linear Abstraction To Show Business Issues Six Steps PowerPoint Templates
PPT 3d linear abstraction to show business issues six steps PowerPoint Templates-Use this 3D Arrow Diagram to Illustrate Processes Step by Step in PowerPoint Presentations -PPT 3d linear abstraction to show business issues six steps PowerPoint Templates-analysis, arrow, background, business, chart, communication, concept, construction, delivery, design, development, engineering, fabrication, feasibiliti, generated, growth, idea, industry, making, production, products, science, sequence, shape

Ppt Colorful Arrows PowerPoint 2010 Describing Seven Stage Templates
PPT colorful arrows powerpoint 2010 describing seven stage Templates-This PowerPoint Diagram shows you the Successive Representation of Management Procedures using Circular arrows. It consists of Seven stages or approaches or factors or components.-PPT colorful arrows powerpoint 2010 describing seven stage Templates-analysis, arrow, background, business, chart, communication, concept, construction, delivery, design, development, engineering, fabrication, feasibiliti, generated, growth, idea, industry, making, production, products, science, sequence, shape
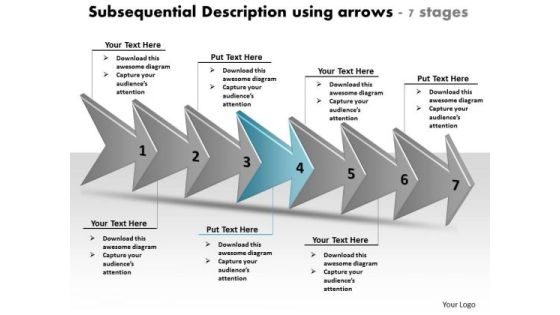
Subsequential Description Using Arrows 7 Stages Order Flow Chart PowerPoint Slides
We present our subsequential description using arrows 7 stages order flow chart PowerPoint Slides.Use our Arrows PowerPoint Templates because,This one depicts the popular chart. Use our Leadership PowerPoint Templates because,you can Master them all and you have it made. Use our Business PowerPoint Templates because,You can Flutter your wings and enchant the world. Impress them with the innate attractiveness of your thoughts and words Use our Symbol PowerPoint Templates because,This slide represents the Tools of the Trade. Use our Process and Flows PowerPoint Templates because,This business powerpoint template helps expound on the logic of your detailed thought process to take your company forward.Use these PowerPoint slides for presentations relating to Arrow, Arrows, Block, Business, Chart, Design, Development, Diagram, Direction, Element, Flow, Flowchart, Graph, Linear, Management, Organization, Process, Program, Section, Sign, Solution, Symbol. The prominent colors used in the PowerPoint template are Red, Gray, Black. People tell us our subsequential description using arrows 7 stages order flow chart PowerPoint Slides are visually appealing. PowerPoint presentation experts tell us our Development PowerPoint templates and PPT Slides are Tranquil. PowerPoint presentation experts tell us our subsequential description using arrows 7 stages order flow chart PowerPoint Slides are Excellent. Professionals tell us our Development PowerPoint templates and PPT Slides are Wistful. Professionals tell us our subsequential description using arrows 7 stages order flow chart PowerPoint Slides will help you be quick off the draw. Just enter your specific text and see your points hit home. People tell us our Direction PowerPoint templates and PPT Slides are Multicolored.

Indirect Benefits Of It In E Commerce Sample Diagram Powerpoint Guide
This is a indirect benefits of it in e commerce sample diagram powerpoint guide. This is a three stage process. The stages in this process are competitors, direct benefits, reduced errors, reduced cost, customer, increased operational efficiency, trading partner.

Corporate Objectives And Strategy Sample Diagram Presentation Deck
This is a corporate objectives and strategy sample diagram presentation deck. This is a ten stage process. The stages in this process are procurement, product design, location, layout, process design, human resources and job design, inventory, reliability and maintenance, schedule, quality management, operations mission and strategy.

Planning For A Sustainable Future Diagram Example Of Ppt
This is a planning for a sustainable future diagram example of ppt. This is a four stage process. The stages in this process are sustainable development vision, greenhouse gas ghg emission reduction, green procurement, sustainable workplace operation, greening services to client.

Introduction To Sustainable Supply Chain Management Diagram Templates
This is a introduction to sustainable supply chain management diagram templates. This is a seven stage process. The stages in this process are logistics, supply chain strategy, supply chain management, product lifecycle management, supply chain planning, asset management, supply chain enterprises application, procurement.

Allowance Execution Model Diagram Powerpoint Slide Presentation Sample
This is a allowance execution model diagram powerpoint slide presentation sample. This is a eight stage process. The stages in this process are determine results, procurement process, impact measurement process, clarify result definitions, value programs based on results, audit and legislative oversight process, identify programs, budget execution process.

Strategic Management Of Assets Asset Lifecycle Management Software Diagrams PDF
Presenting this set of slides with name strategic management of assets asset lifecycle management software diagrams pdf. The topics discussed in these slides are asset, management, service, procurement, cost. This is a completely editable PowerPoint presentation and is available for immediate download. Download now and impress your audience.
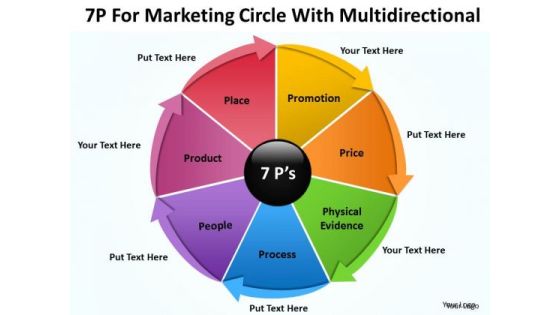
Consulting PowerPoint Template For Marketing Circle With Multidirectional Ppt Slides
Touch base with our consulting PowerPoint template for marketing circle with multidirectional ppt Slides. Review your growth with your audience. Take a deep dive with our Advertising PowerPoint Templates. Get into the nitty-gritty of it all. Plan your storyboard with our Finance PowerPoint Templates. Give an outline to the solutions you have.

Product Portfolio Matrix With Text Holders Ppt PowerPoint Presentation Infographics Guidelines
Presenting this set of slides with name product portfolio matrix with text holders ppt powerpoint presentation infographics guidelines. This is a four stage process. The stages in this process are introduction, growth, decline, maternity. This is a completely editable PowerPoint presentation and is available for immediate download. Download now and impress your audience.
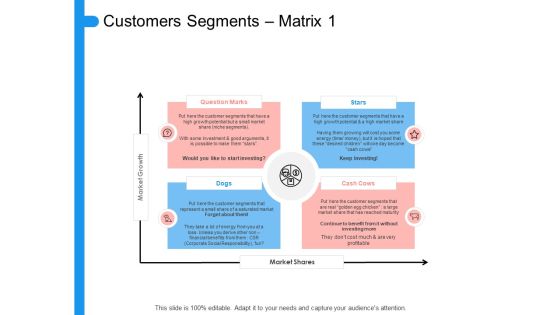
Target Persona Customers Segments Matrix Ppt Slides Example Topics PDF
Presenting target persona customers segments matrix ppt slides example topics pdf to provide visual cues and insights. Share and navigate important information on four stages that need your due attention. This template can be used to pitch topics like market shares, market growth. In addition, this PPT design contains high-resolution images, graphics, etc, that are easily editable and available for immediate download.

Reach Your Target Audience Customers Segments Matrix Marks Guidelines PDF
Presenting reach your target audience customers segments matrix marks guidelines pdf to provide visual cues and insights. Share and navigate important information on four stages that need your due attention. This template can be used to pitch topics like market growth, market shares. In addition, this PPT design contains high-resolution images, graphics, etc, that are easily editable and available for immediate download.
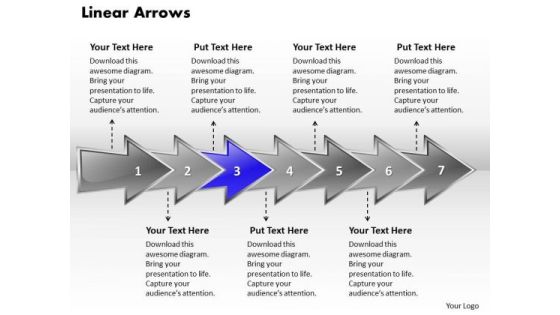
Ppt Linear 3d Arrows PowerPoint Describing Seven Aspects Templates
PPT linear 3d arrows powerpoint describing seven aspects Templates-This diagram shows an organized view of business services and processes. This diagram provides an overview of the interactions of different factors in a company. Use this diagram to present your contents in a clear and structured manner.-PPT linear 3d arrows powerpoint describing seven aspects Templates-analysis, arrow, background, business, chart, communication, concept, construction, delivery, design, development, engineering, fabrication, feasibiliti, generated, growth, idea, industry, making, production, products, science, sequence, shape

Swot Analysis Of Ibn Outsourcing Company Opportunity Diagrams PDF
This slide shows some opportunities of IBN Outsourcing Company that that can lead to growth in future such as Increasing Awareness of Outsourcing , Ensure Proper Onboarding , Engage in Customer Loyalty Reward Programs and Gift Offers etc. Presenting swot analysis of ibn outsourcing company opportunity diagrams pdf. to provide visual cues and insights. Share and navigate important information on four stages that need your due attention. This template can be used to pitch topics like process, measures, product, implement, programs. In addtion, this PPT design contains high resolution images, graphics, etc, that are easily editable and available for immediate download.

Key Drivers That Push The Recruitment Industry Diagrams PDF
Purpose of the following slide is to show the key growth drivers for Recruitment Industry This is a key drivers that push the recruitment industry diagrams pdf template with various stages. Focus and dispense information on five stages using this creative set, that comes with editable features. It contains large content boxes to add your information on topics like implantation and utilization, integration with software, platform instead of desktop. You can also showcase facts, figures, and other relevant content using this PPT layout. Grab it now.
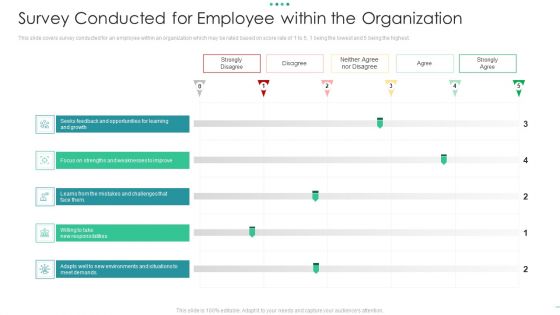
Survey Conducted For Employee Within The Organization Diagrams PDF
This slide covers survey conducted for an employee within an organization which may be rated based on score rate of 1 to 5, 1 being the lowest and 5 being the highest. This is a survey conducted for employee within the organization diagrams pdf template with various stages. Focus and dispense information on four stages using this creative set, that comes with editable features. It contains large content boxes to add your information on topics like environments, demands, growth. You can also showcase facts, figures, and other relevant content using this PPT layout. Grab it now.

Global Market Insights Cybersecurity Ppt Infographic Template Diagrams PDF
Following slide illustrates the global market insights of cybersecurity covering statistics related to integrated risk management, investment in cybersecurity and digital transformation. Presenting global market insights cybersecurity ppt infographic template diagrams pdf to provide visual cues and insights. Share and navigate important information on three stages that need your due attention. This template can be used to pitch topics like risk management, growth, organizational, information. In addtion, this PPT design contains high resolution images, graphics, etc, that are easily editable and available for immediate download.
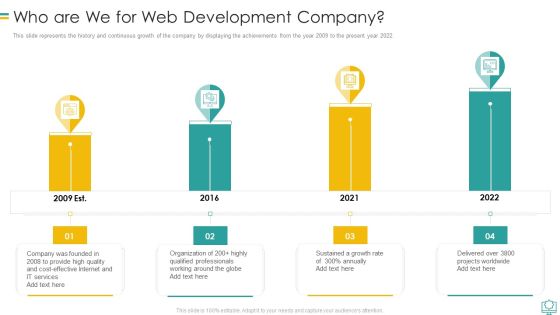
Who Are We For Web Development Company Diagrams PDF
This slide represents the history and continuous growth of the company by displaying the achievements from the year 2009 to the present year 2022.Presenting Who Are We For Web Development Company Diagrams PDF to provide visual cues and insights. Share and navigate important information on four stages that need your due attention. This template can be used to pitch topics like Qualified Professionals, Cost Effective Internet, Projects Worldwide In addtion, this PPT design contains high resolution images, graphics, etc, that are easily editable and available for immediate download.
 Home
Home