AI PPT Maker
Templates
PPT Bundles
Design Services
Business PPTs
Business Plan
Management
Strategy
Introduction PPT
Roadmap
Self Introduction
Timelines
Process
Marketing
Agenda
Technology
Medical
Startup Business Plan
Cyber Security
Dashboards
SWOT
Proposals
Education
Pitch Deck
Digital Marketing
KPIs
Project Management
Product Management
Artificial Intelligence
Target Market
Communication
Supply Chain
Google Slides
Research Services
 One Pagers
All Categories
-
Home
- Customer Favorites
- Sales Data Analysis
Sales Data Analysis

Demand Generation Tactics For Business Development Ppt Slides Graphics Pictures PDF
This slide covers the strategies implemented for developing business and generating demand. The purpose of this template is to define the demand generating strategies adopted by business for its growth. It covers information about demand creation, lead conversion and account development. Persuade your audience using this Demand Generation Tactics For Business Development Ppt Slides Graphics Pictures PDF. This PPT design covers three stages, thus making it a great tool to use. It also caters to a variety of topics including Strategy, Sales Process, Sales People, Sales Management. Download this PPT design now to present a convincing pitch that not only emphasizes the topic but also showcases your presentation skills.
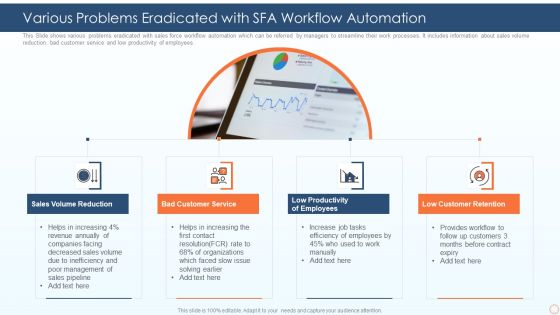
Various Problems Eradicated With SFA Workflow Automation Ppt PowerPoint Presentation File Skills PDF
This Slide shows various problems eradicated with sales force workflow automation which can be referred by managers to streamline their work processes. It includes information about sales volume reduction, bad customer service and low productivity of employees. Persuade your audience using this various problems eradicated with sfa workflow automation ppt powerpoint presentation file skills pdf. This PPT design covers four stages, thus making it a great tool to use. It also caters to a variety of topics including sales volume reduction, bad customer service, low productivity of employees, low customer retention. Download this PPT design now to present a convincing pitch that not only emphasizes the topic but also showcases your presentation skills.

Stages Of CRM Process Customer Relation Management Lifecycle Sample PDF
The following slide highlights the stages of CRM process lifecycle phases illustrating key headings which includes marketing stage, sales stage, product stage and support stage. Presenting Stages Of CRM Process Customer Relation Management Lifecycle Sample PDF to dispense important information. This template comprises four stages. It also presents valuable insights into the topics including Marketing Stage, Sales Stage, Support Stage, Sales Stage. This is a completely customizable PowerPoint theme that can be put to use immediately. So, download it and address the topic impactfully.
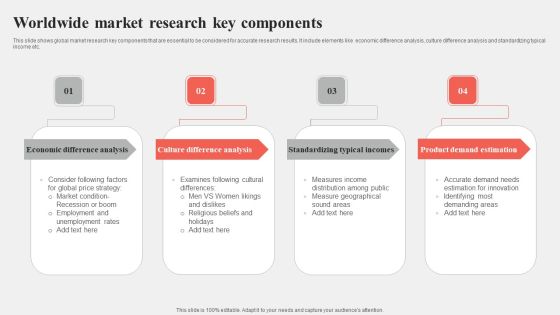
Worldwide Market Research Key Components Sample PDF
This slide shows global market research key components that are essential to be considered for accurate research results. It include elements like economic difference analysis, culture difference analysis and standardizing typical income etc. Presenting Worldwide Market Research Key Components Sample PDF to dispense important information. This template comprises four stages. It also presents valuable insights into the topics including Difference Analysis, Typical Incomes, Estimation. This is a completely customizable PowerPoint theme that can be put to use immediately. So, download it and address the topic impactfully.
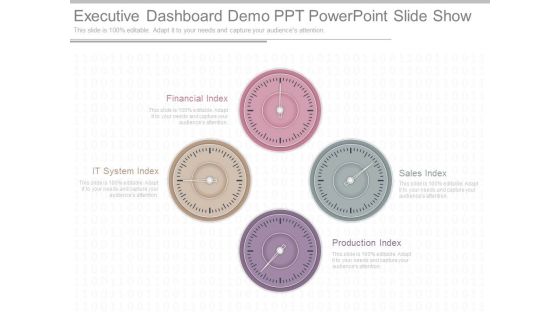
Executive Dashboard Demo Ppt Powerpoint Slide Show
This is a executive dashboard demo ppt powerpoint slide show. This is a four stage process. The stages in this process are financial index, it system index, production index, sales index.

Deployment Of Cloud Project Management Model Integrating Cloud Computing To Enhance Projects Effectiveness Themes PDF
This slide showcases deployment of cloud project management model. It provides information about public, private, hybrid, setup, data security, data control, privacy, scalability, integration, etc. Slidegeeks is here to make your presentations a breeze with Deployment Of Cloud Project Management Model Integrating Cloud Computing To Enhance Projects Effectiveness Themes PDF With our easy to use and customizable templates, you can focus on delivering your ideas rather than worrying about formatting. With a variety of designs to choose from, you are sure to find one that suits your needs. And with animations and unique photos, illustrations, and fonts, you can make your presentation pop. So whether you are giving a sales pitch or presenting to the board, make sure to check out Slidegeeks first.

Increasing Consumer Engagement With Database Selecting Database Marketing Software Slides PDF
The purpose of this slide is to showcase comparative assessment of various tools used in database marketing. The comparison is drawn on basis of major characteristics such as omnichannel solution, sales pipeline automation, personalization, data management, email integration, etc. The Increasing Consumer Engagement With Database Selecting Database Marketing Software Slides PDF is a compilation of the most recent design trends as a series of slides. It is suitable for any subject or industry presentation, containing attractive visuals and photo spots for businesses to clearly express their messages. This template contains a variety of slides for the user to input data, such as structures to contrast two elements, bullet points, and slides for written information. Slidegeeks is prepared to create an impression.

Project Management Dashboard Ppt Slides
This is a project management dashboard ppt slides. This is a three stage process. The stages in this process are customer survey project, implement new sales force software, new order system.
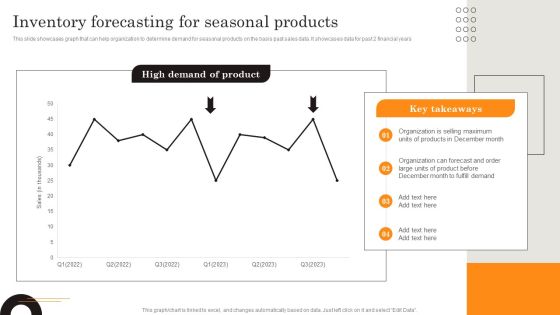
Procurement Strategies For Reducing Stock Wastage Inventory Forecasting For Seasonal Ideas PDF
This slide showcases graph that can help organization to determine demand for seasonal products on the basis past sales data. It showcases data for past 2 financial years. Do you have to make sure that everyone on your team knows about any specific topic I yes, then you should give Procurement Strategies For Reducing Stock Wastage Inventory Forecasting For Seasonal Ideas PDF a try. Our experts have put a lot of knowledge and effort into creating this impeccable Procurement Strategies For Reducing Stock Wastage Inventory Forecasting For Seasonal Ideas PDF. You can use this template for your upcoming presentations, as the slides are perfect to represent even the tiniest detail. You can download these templates from the Slidegeeks website and these are easy to edit. So grab these today.
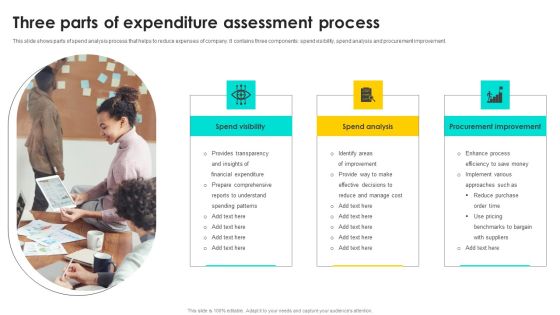
Three Parts Of Expenditure Assessment Process Rules PDF
This slide shows parts of spend analysis process that helps to reduce expenses of company. It contains three components spend visibility, spend analysis and procurement improvement. Persuade your audience using this Three Parts Of Expenditure Assessment Process Rules PDF. This PPT design covers Three stages, thus making it a great tool to use. It also caters to a variety of topics including Spend Visibility, Spend Analysis, Procurement Improvement. Download this PPT design now to present a convincing pitch that not only emphasizes the topic but also showcases your presentation skills.

Strategies To Order And Manage Ideal Inventory Levels Inventory Forecasting Elements PDF
This slide showcases graph that can help organization to determine demand for seasonal products on the basis past sales data. It showcases data for past 2 financial years. Do you have to make sure that everyone on your team knows about any specific topic I yes, then you should give Strategies To Order And Manage Ideal Inventory Levels Inventory Forecasting Elements PDF a try. Our experts have put a lot of knowledge and effort into creating this impeccable Strategies To Order And Manage Ideal Inventory Levels Inventory Forecasting Elements PDF. You can use this template for your upcoming presentations, as the slides are perfect to represent even the tiniest detail. You can download these templates from the Slidegeeks website and these are easy to edit. So grab these today.
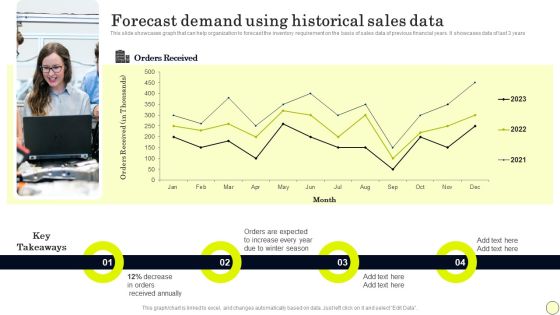
Strategies To Order And Manage Ideal Inventory Levels Forecast Demand Using Historical Template PDF
This slide showcases graph that can help organization to forecast the inventory requirement on the basis of sales data of previous financial years. It showcases data of last 3 years. Do you know about Slidesgeeks Strategies To Order And Manage Ideal Inventory Levels Forecast Demand Using Historical Template PDF These are perfect for delivering any kind od presentation. Using it, create PowerPoint presentations that communicate your ideas and engage audiences. Save time and effort by using our pre designed presentation templates that are perfect for a wide range of topic. Our vast selection of designs covers a range of styles, from creative to business, and are all highly customizable and easy to edit. Download as a PowerPoint template or use them as Google Slides themes.
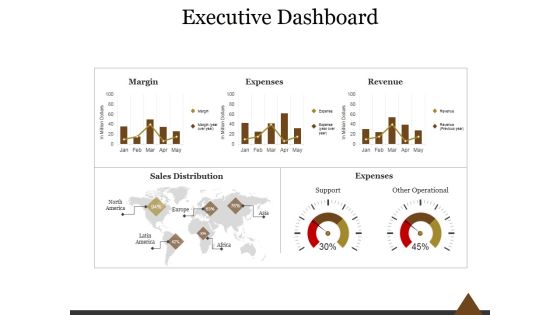
Executive Dashboard Ppt PowerPoint Presentation Professional
This is a executive dashboard ppt powerpoint presentation professional. This is a five stage process. The stages in this process are margin, expenses, revenue, sales distribution, expenses, support, other operational.

Departmental Goals And Progress Status Dashboard Ppt Portfolio Samples PDF
This slide illustrates statistics and graphical representation of team progress. It includes testing team, sales team, development team, members and progress status graphs etc. Pitch your topic with ease and precision using this Departmental Goals And Progress Status Dashboard Ppt Portfolio Samples PDF. This layout presents information on Testing Team, Sales Team, Development Team. It is also available for immediate download and adjustment. So, changes can be made in the color, design, graphics or any other component to create a unique layout.

Dashboard Program Ppt Presentation Powerpoint
This is a dashboard program ppt presentation powerpoint. This is a six stage process. The stages in this process are tasks, progress, matrix, resource, utilization, time, safety, progress, sales rate.
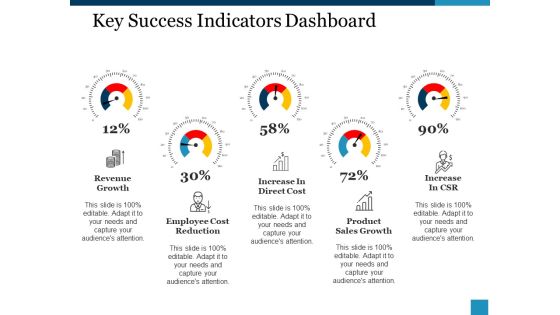
Key Success Indicators Dashboard Ppt PowerPoint Presentation Inspiration Guide
This is a key success indicators dashboard ppt powerpoint presentation inspiration guide. This is a five stage process. The stages in this process are revenue growth, increase in direct cost, increase in csr, employee cost reduction, product, sales growth.

Enterprise Statistic Model Ppt Layout Presentation Outline
This is a Enterprise Statistic Model Ppt Layout Presentation Outline. This is a five stage process. The stages in this process are interactive marketing, sales forecasting, market research, marketing intelligence, distributing information.
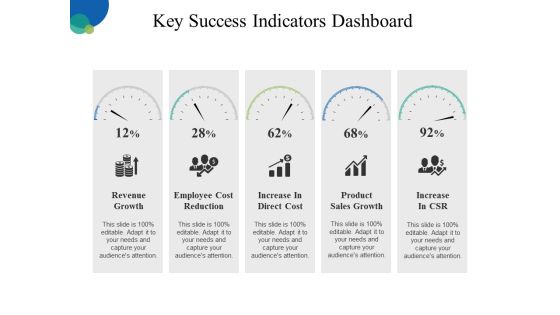
Key Success Indicators Dashboard Ppt PowerPoint Presentation Outline Slideshow
This is a key success indicators dashboard ppt powerpoint presentation outline slideshow. This is a five stage process. The stages in this process are revenue growth, employee cost reduction, increase in direct cost, product sales growth, increase in csr.

Selling Forecasts Dashboard With Revenue Predictions Elements PDF
This slide covers estimated sales projections based on different regions. It includes elements such as potential revenue and predicted revenue, predicted risks, sales forecasted by agents , etc. Showcasing this set of slides titled Selling Forecasts Dashboard With Revenue Predictions Elements PDF. The topics addressed in these templates are Forecasted Value, Potential Revenue, Predicted Risk. All the content presented in this PPT design is completely editable. Download it and make adjustments in color, background, font etc. as per your unique business setting.
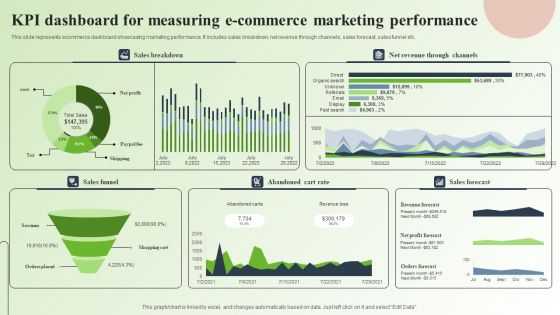
Strategic Guide For Mastering E Commerce Marketing Kpi Dashboard For Measuring E Commerce Marketing Performance Infographics PDF
This slide represents ecommerce dashboard showcasing marketing performance. It includes sales breakdown, net revenue through channels, sales forecast, sales funnel etc. Slidegeeks is here to make your presentations a breeze with Strategic Guide For Mastering E Commerce Marketing Kpi Dashboard For Measuring E Commerce Marketing Performance Infographics PDF With our easy to use and customizable templates, you can focus on delivering your ideas rather than worrying about formatting. With a variety of designs to choose from, you are sure to find one that suits your needs. And with animations and unique photos, illustrations, and fonts, you can make your presentation pop. So whether you are giving a sales pitch or presenting to the board, make sure to check out Slidegeeks first.

Executive Marketing And Operations Dashboard For Inventory Management Template PDF
This slide covers executive sales and operations dashboard for inventory management. It involves total number of accounts, monthly recuring revenue, conversion rate and monthly recurring revenue retention rate. Showcasing this set of slides titled Executive Marketing And Operations Dashboard For Inventory Management Template PDF. The topics addressed in these templates are Product, Marketing, Sales. All the content presented in this PPT design is completely editable. Download it and make adjustments in color, background, font etc. as per your unique business setting.

Example Of Management Strategy For Information Technology Diagram Presentation Images
This is a example of management strategy for information technology diagram presentation images. This is a six stage process. The stages in this process are human resources, finance, sales and marketing, admin and operations, production, shipping, information technology.
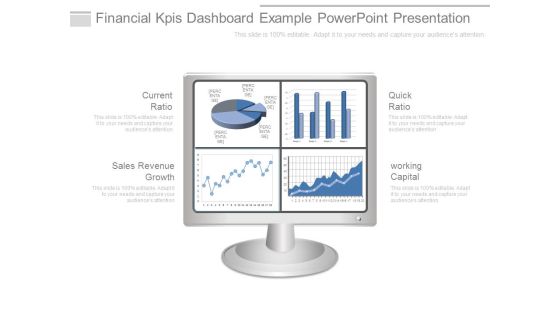
Financial Kpis Dashboard Example Powerpoint Presentation
This is a financial kpis dashboard example powerpoint presentation. This is a four stage process. The stages in this process are current ratio, sales revenue growth, quick ratio, working capital.

Operational Dashboard Powerpoint Images
This is a operational dashboard powerpoint images. This is a four stage process. The stages in this process are cash and equivalents, revenue and expenses actual and forecast, store sales vs budget, expenses actual budget forecast.

Business Process Metrics Ppt Sample Presentations
This is a business process metrics ppt sample presentations. This is a five stage process. The stages in this process are communication study, goal process, success, strategic system, sales review.
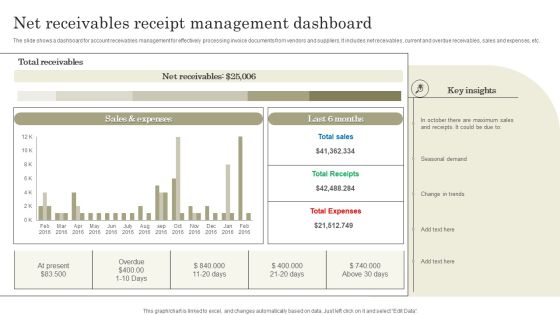
Net Receivables Receipt Management Dashboard Information PDF
The slide shows a dashboard for account receivables management for effectively processing invoice documents from vendors and suppliers. It includes net receivables, current and overdue receivables, sales and expenses, etc. Showcasing this set of slides titled Net Receivables Receipt Management Dashboard Information PDF. The topics addressed in these templates are Total sales, Total Receipts, Total Expenses. All the content presented in this PPT design is completely editable. Download it and make adjustments in color, background, font etc. as per your unique business setting.
Six Text Boxes With Icons Powerpoint Template
This business slide contains pie chart infographic layout. This diagram is suitable to present business deal and analysis This diagram provides schematic representation of any information and provides more clarity to the subject.
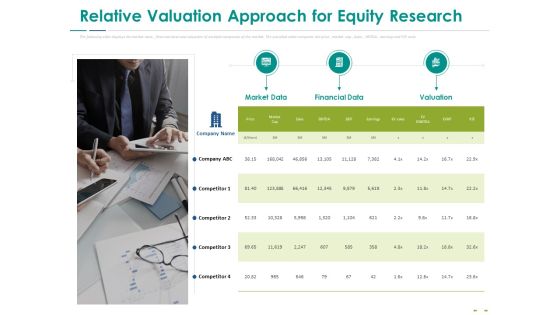
Stock Market Research Report Relative Valuation Approach For Equity Research Inspiration PDF
The following slide displays the market data, financial data and valuation of multiple companies of the market. The provided table compares the price, market cap, Sales, EBITDA, earning and P or E ratio. Presenting stock market research report relative valuation approach for equity research inspiration pdf to provide visual cues and insights. Share and navigate important information on one stages that need your due attention. This template can be used to pitch topics like market data, financial data, valuation. In addition, this PPT design contains high-resolution images, graphics, etc, that are easily editable and available for immediate download.

Department Information Ppt PowerPoint Presentation Designs
This is a department information ppt powerpoint presentation designs. This is a four stage process. The stages in this process are manager, web designer, financial consultant, sales consultant, graphic designer.

Department Information Ppt PowerPoint Presentation Inspiration Model
This is a department information ppt powerpoint presentation inspiration model. This is a three stage process. The stages in this process are graphic designer, ceo, web designer, sales marketing, director, manager.

Bar Chart Ppt PowerPoint Presentation Icon Information
This is a bar chart ppt powerpoint presentation icon information. This is a one stage process. The stages in this process are product, sales in percentage, financial years, bar graph, growth.

Area Chart Ppt PowerPoint Presentation Summary Information
This is a area chart ppt powerpoint presentation summary information. This is a two stage process. The stages in this process are business, sales in percentage, percentage, marketing, graph.
Interpreting Market Kinetics Influence Customer Purchasing KPI Dashboard To Monitor Icons PDF
Mentioned slide shows the KPI dashboard that can be used to track win and lost sales opportunities. It includes metrics namely won opportunities, lost opportunities, pipeline by territory, total opportunities. Deliver an awe inspiring pitch with this creative interpreting market kinetics influence customer purchasing kpi dashboard to monitor icons pdf bundle. Topics like kpi dashboard to monitor sales opportunities can be discussed with this completely editable template. It is available for immediate download depending on the needs and requirements of the user.

Marketing Communication Mix Elements Ppt PowerPoint Presentation Information
This is a marketing communication mix elements ppt powerpoint presentation information. This is a five stage process. The stages in this process are direct marketing, public relations, personal selling, sales promotion, advertising.

Internal Sources Of New Product Ideas Ppt PowerPoint Presentation Portfolio Information
This is a internal sources of new product ideas ppt powerpoint presentation portfolio information. This is a three stage process. The stages in this process are research and engineering, sales force, innovation group meetings, management, employee suggestions.

Information Technology Operations Administration With ML Need For Artificial Intelligence Graphics PDF
The purpose of the following slide is to show the need of artificial intelligence in the organizations, these problems can be no real time analysis , poor monitoring. Slidegeeks is here to make your presentations a breeze with Information Technology Operations Administration With ML Need For Artificial Intelligence Graphics PDF With our easy to use and customizable templates, you can focus on delivering your ideas rather than worrying about formatting. With a variety of designs to choose from, you are sure to find one that suits your needs. And with animations and unique photos, illustrations, and fonts, you can make your presentation pop. So whether you are giving a sales pitch or presenting to the board, make sure to check out Slidegeeks first.

New Commodity Market Viability Review Product Performance Dashboard Infographics PDF
The following slide displays the product performance dashboard as it highlights the top product by revenue, online vs. in store purchase, the sales by campaign Deliver an awe inspiring pitch with this creative New Commodity Market Viability Review Product Performance Dashboard Infographics PDF bundle. Topics like Online Purchase, Products Revenue, Sales Campaign can be discussed with this completely editable template. It is available for immediate download depending on the needs and requirements of the user.
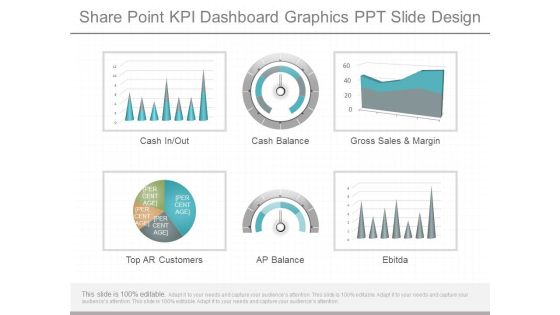
Share Point Kpi Dashboard Graphics Ppt Slide Design
This is a share point kpi dashboard graphics ppt slide design. This is a six stage process. The stages in this process are cash in out, cash balance, gross sales and margin, top ar customers, ap balance, ebitda.

Team Member Professional Skills Dashboard Powerpoint Slide Backgrounds
This is a team member professional skills dashboard powerpoint slide backgrounds. This is a one stage process. The stages in this process are personal skills, sales marketing, business, management, presentation.

Barriers To E Learning Sample Diagram Powerpoint Shapes
This is a barriers to e learning sample diagram powerpoint shapes. This is a six stage process. The stages in this process are attract leads, convert leads, score leads, close the deals, sales buying funnel, inquiries marketing, e learning.

Online Media Purchasing Process For Effective Targeting Ppt Pictures Display PDF
This slide covers digital media buying process for effective targeting. It involves six steps such as target audience, strategize, negotiate, placement, analysis and optimize. Presenting Online Media Purchasing Process For Effective Targeting Ppt Pictures Display PDF to dispense important information. This template comprises six stages. It also presents valuable insights into the topics including Optimize, Analysis, Placement, Negotiate, Strategize, Target Audience. This is a completely customizable PowerPoint theme that can be put to use immediately. So, download it and address the topic impactfully.
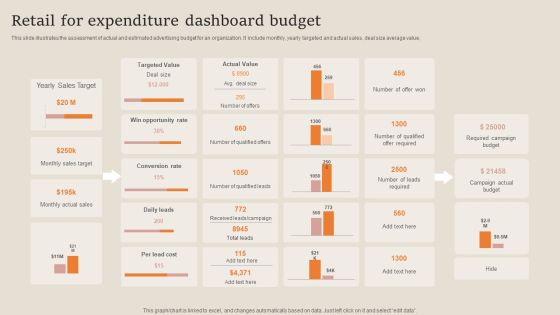
Retail For Expenditure Dashboard Budget Designs PDF
This slide illustrates the assessment of actual and estimated advertising budget for an organization. It include monthly, yearly targeted and actual sales, deal size average value, Showcasing this set of slides titled Retail For Expenditure Dashboard Budget Designs PDF. The topics addressed in these templates are Sales Target, Opportunity Rate, Required Campaign Budget. All the content presented in this PPT design is completely editable. Download it and make adjustments in color, background, font etc. as per your unique business setting.

Food Production Plant Management Dashboard Clipart PDF
This slide illustrates food production factory management dashboard. It provides information such as total production, active machines, sales revenue, shifts, expenses, manpower, rejected products, etc.Pitch your topic with ease and precision using this food production plant management dashboard clipart pdf This layout presents information on total production, active machines, sales revenue It is also available for immediate download and adjustment. So, changes can be made in the color, design, graphics or any other component to create a unique layout.

Customer Engagement Technology Ppt Powerpoint Images
This is a customer engagement technology ppt powerpoint images. This is a six stage process. The stages in this process are sales discount, money transfer, social networking, megaphone, mobile networking, system networking, engage.
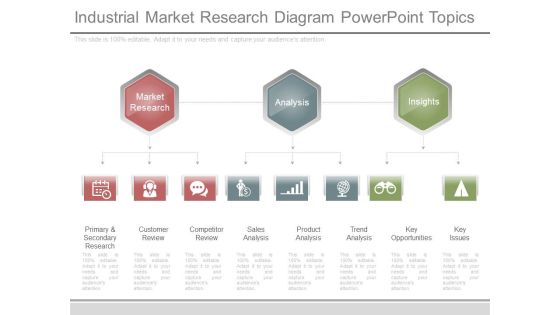
Industrial Market Research Diagram Powerpoint Topics
This is a industrial market research diagram powerpoint topics. This is a three stage process. The stages in this process are market research, analysis, insights, primary and secondary research, customer review, competitor review, sales analysis, product analysis, trend analysis, key opportunities, key issues.
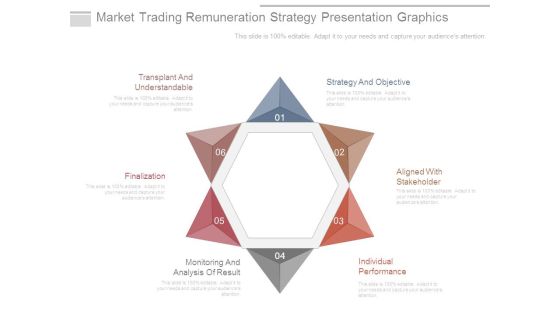
Market Trading Remuneration Strategy Presentation Graphics
This is a market trading remuneration strategy presentation graphics. This is a six stage process. The stages in this process are strategy and objective, aligned with stakeholder, individual performance, monitoring and analysis of result, finalization, transplant and understandable.

Marketing Procurement Template Sample Presentation Ppt
This is a marketing procurement template sample presentation ppt. This is a four stage process. The stages in this process are analysis of cost structure, devise appropriate cost levers, business intelligence, produce.

Business Technology Selection And Implementation Example Powerpoint Slides
This is a business technology selection and implementation example powerpoint slides. This is a six stage process. The stages in this process are qualification and testing, configuration and design, sales promotion, governance, pilot and implement, risk management.

Affiliate Marketing KPI Dashboard With Click Through Rate Slides PDF
The following slide showcases a comprehensive affiliate marketing KPI dashboard. Information covered in this slide is related to total sales , commission, clicks, sessions, click through rate, etc. Showcasing this set of slides titled Affiliate Marketing KPI Dashboard With Click Through Rate Slides PDF. The topics addressed in these templates are Sales, Dashboard, Commission. All the content presented in this PPT design is completely editable. Download it and make adjustments in color, background, font etc. as per your unique business setting.

Startup Investor Presentation Powerpoint Slide Designs
This is a startup investor presentation powerpoint slide designs. This is a one stage process. The stages in this process are business plan, sales pitch, elevator pitch, pitch book, straw man proposal, marketing plan, selling technique.

Accounting KPI Dashboard To Control System Financial Performance Formats PDF
The following slide showcases model for enabling control of accounts. It presents information related to long term planning, investment plans, profit estimated, etc. Pitch your topic with ease and precision using this Accounting KPI Dashboard To Control System Financial Performance Formats PDF. This layout presents information on Sales Outstanding, Payable Outstanding, Sales Inventory. It is also available for immediate download and adjustment. So, changes can be made in the color, design, graphics or any other component to create a unique layout.

Market Performance Monitoring Dashboard For Consumer Goods Microsoft PDF
This slide showcase the Performance Monitoring Dashboard for Consumer Goods providing information regarding the Overview of Food and Beverages Sales, Top Selling Products and On Shelf Availability.Deliver and pitch your topic in the best possible manner with this Market Performance Monitoring Dashboard For Consumer Goods Microsoft PDF. Use them to share invaluable insights on Sales Overview, Performance Subsegments, Beverage Products and impress your audience. This template can be altered and modified as per your expectations. So, grab it now.

Performance Monitoring Dashboard For Consumer Goods Ppt Professional Ideas PDF
This slide showcase the performance monitoring dashboard for consumer goods providing information regarding the overview of food and beverages sales, top selling products and on shelf availability. Deliver an awe inspiring pitch with this creative Performance Monitoring Dashboard For Consumer Goods Ppt Professional Ideas PDF bundle. Topics like Food And Beverages, Sales Overview, Top Food Beverages, Products can be discussed with this completely editable template. It is available for immediate download depending on the needs and requirements of the user.
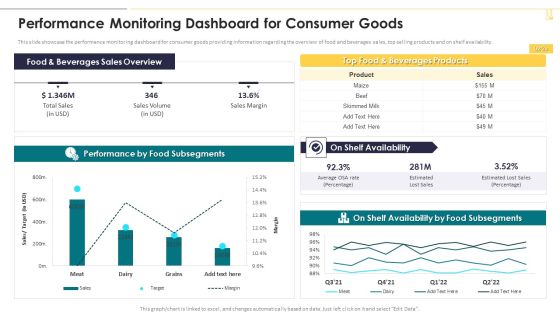
Performance Monitoring Dashboard For Consumer Goods Themes PDF
This slide showcase the performance monitoring dashboard for consumer goods providing information regarding the overview of food and beverages sales, top selling products and on shelf availability. Deliver an awe inspiring pitch with this creative Performance Monitoring Dashboard For Consumer Goods Themes PDF bundle. Topics like Beverages Sales Overview, Beverages Products, Availability can be discussed with this completely editable template. It is available for immediate download depending on the needs and requirements of the user.

Market Research Summary Dashboard Of Fmcg Industry Pictures PDF
The following slide highlights the market research report of FMCG which includes the sales by location, units per transaction and products sold. Showcasing this set of slides titled Market Research Summary Dashboard Of Fmcg Industry Pictures PDF. The topics addressed in these templates are Revenues, Net Profit, Sales. All the content presented in this PPT design is completely editable. Download it and make adjustments in color, background, font etc. as per your unique business setting.

Yearly Business Performance Assessment And Evaluation Dashboard Structure PDF
This slide contains annual business review of a company. It includes revenue comparison, sales assessment and profitability representation. Showcasing this set of slides titled Yearly Business Performance Assessment And Evaluation Dashboard Structure PDF. The topics addressed in these templates are Revenue Comparison, Sales, Profitability. All the content presented in this PPT design is completely editable. Download it and make adjustments in color, background, font etc. as per your unique business setting.
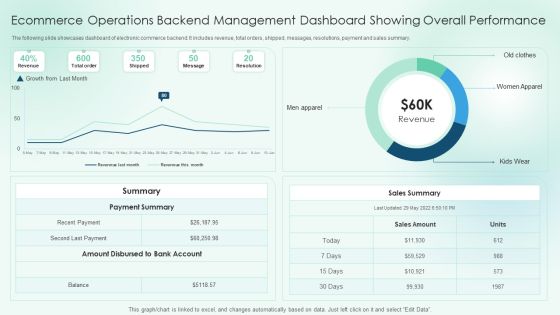
Ecommerce Operations Backend Management Dashboard Showing Overall Performance Slides PDF
The following slide showcases dashboard of electronic commerce backend. It includes revenue, total orders, shipped, messages, resolutions, payment and sales summary.Pitch your topic with ease and precision using this Ecommerce Operations Backend Management Dashboard Showing Overall Performance Slides PDF. This layout presents information on Payment Summary, Amount Disbursed, Sales Summary. It is also available for immediate download and adjustment. So, changes can be made in the color, design, graphics or any other component to create a unique layout.

Content Marketing Strategy Ppt Powerpoint Slide Backgrounds
This is a content marketing strategy ppt powerpoint slide backgrounds. This is a five stage process. The stages in this process are loyalty, purchase, analysis and comparison, awareness of need, consideration research.
Marketing Lead Tracking Systems Diagram Powerpoint Show
This is a marketing lead tracking systems diagram powerpoint show. This is a six stage process. The stages in this process are lead capture, event management, web analytical, crm integration, social and media, email marketing, sales fusion marketing platform.

Email Marketing Solution Diagram Ppt Presentation
This is a email marketing solution diagram ppt presentation. This is a six stage process. The stages in this process are communication, marketing, goals, analysis and reporting, content, buying cycle, design.
