AI PPT Maker
Templates
PPT Bundles
Design Services
Business PPTs
Business Plan
Management
Strategy
Introduction PPT
Roadmap
Self Introduction
Timelines
Process
Marketing
Agenda
Technology
Medical
Startup Business Plan
Cyber Security
Dashboards
SWOT
Proposals
Education
Pitch Deck
Digital Marketing
KPIs
Project Management
Product Management
Artificial Intelligence
Target Market
Communication
Supply Chain
Google Slides
Research Services
 One Pagers
All Categories
-
Home
- Customer Favorites
- Sales Coordinator
Sales Coordinator

Waterfall Graph For Income And Expense Analysis Ppt PowerPoint Presentation File Deck
This is a waterfall graph for income and expense analysis ppt powerpoint presentation file deck. This is a eight stage process. The stages in this process are sales waterfall, waterfall chart, business.

Bar Graph With Dollar Finance PowerPoint Templates And PowerPoint Themes 0512
Microsoft Powerpoint Templates and Background with business graph success-Bar Graph With Dollar Finance PowerPoint Templates And PowerPoint Themes 0512-These PowerPoint designs and slide layouts can be used for themes relating to -Business graph, success, global, marketing, finance, sales
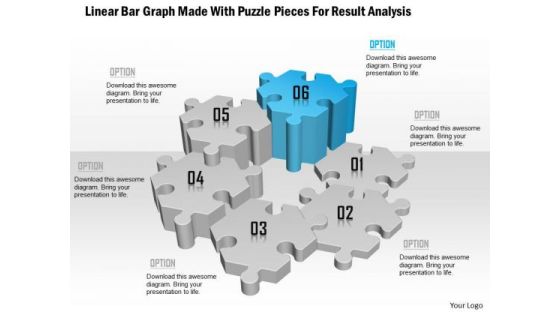
Linear Bar Graph Made With Puzzle Pieces For Result Analysis Presentation Template
This Power Point template has been used to show concept of result analysis. This PPT contains the graphic of linear bar graph made with puzzle. Use this PPT for business and sales presentations.

Business Diagram Globe Bar Graph And Bulb For International Business Diagram Presentation Template
Graphic of globe and bar graph with bulb has been used to craft this power point template diagram. This PPT diagram contains the concept of international business growth analysis. Use this PPT for global business and sales related presentations.
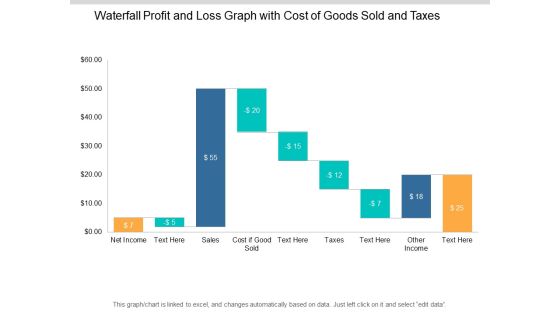
Waterfall Profit And Loss Graph With Cost Of Goods Sold And Taxes Ppt PowerPoint Presentation Show Slideshow
This is a waterfall profit and loss graph with cost of goods sold and taxes ppt powerpoint presentation show slideshow. This is a nine stage process. The stages in this process are sales waterfall, waterfall chart, business.

Fundamentals Of Business Analysis Diagram Powerpoint Slide Rules
This is a fundamentals of business analysis diagram powerpoint slide rules. This is a six stage process. The stages in this process are business model, building website, retail partnership, network of retail stores, web sales of advantage card, money conscious.

Social Media For Human Resources Powerpoint Slide Deck
This is a social media for human resources powerpoint slide deck. This is a four stage process. The stages in this process are cooperative advertising, manufacturer reimburse retailer for ad expanses, based on a percentage sales to retailer, ad allowances.

Stock Photo Twisted Arrows Around Bars PowerPoint Slide
This conceptual image displays graphics of bar graph. This image of bar graph can be used to show growth in sales or profit. Pass your ideas through this image slide in relation to profit growth.

Column Chart Ppt PowerPoint Presentation Outline Styles
This is a column chart ppt powerpoint presentation outline styles. This is a two stage process. The stages in this process are sales in percentage, financial year in, business, marketing, graph.

Revenue Generation Opportunity For Alcohol Industry Pitch Deck Information PDF
Revenue generation opportunities is key aspect of pitch deck as it displays the major market opportunity from where the organization can generate revenues in the future. The provided slide highlights 3 major revenue generation opportunity, these are direct sales to customer, bulk sales on online platforms and partnership opportunity with food chain. Deliver and pitch your topic in the best possible manner with this Revenue Generation Opportunity For Alcohol Industry Pitch Deck Information PDF. Use them to share invaluable insights on Revenue Generation 2022, Partnership Opportunity Food Chains, Bulk Sales Commerce Platforms, Direct Sales To Consumer, Understanding Revenue Opportunity and impress your audience. This template can be altered and modified as per your expectations. So, grab it now.

Bar Chart Ppt PowerPoint Presentation Outline Introduction
This is a bar chart ppt powerpoint presentation outline introduction. This is a one stage process. The stages in this process are sales in percentage, product, business, financial years, graph.
Statistics Associated With Consumer While Shopping At Retail Store Icons PDF
This slide provides information regarding statistics associated with consumer while shopping at retail store. These statistics include consumer preference of online vs. offline store, interaction with sales representatives, etc. Deliver an awe inspiring pitch with this creative Statistics Associated With Consumer While Shopping At Retail Store Icons PDF bundle. Topics like Sales Representatives, Consumers Access, Stock Availability can be discussed with this completely editable template. It is available for immediate download depending on the needs and requirements of the user.

Bar Chart Ppt PowerPoint Presentation Outline Backgrounds
This is a bar chart ppt powerpoint presentation outline backgrounds. This is a one stage process. The stages in this process are sales in percentage, financial years, product, bar graph, finance.
Stock Photo Illustration Of Chess Pieces Strategy Concept PowerPoint Slide
Two different colored chess pieces are used in this power point image slide. This image slide contains the two different concepts, one is game and other is team work. Display these two concepts in your sales and game related presentations.

Deploying House Flipping Business Plan Strategy And Implementation For House Flipping Business Plan Designs PDF
This slide represents key strategies for property flipping business plan developed by flippers. It covers sales forecast by different generations, sales strategy and marketing initiatives to increase property sales. Slidegeeks is here to make your presentations a breeze with Deploying House Flipping Business Plan Strategy And Implementation For House Flipping Business Plan Designs PDF With our easy to use and customizable templates, you can focus on delivering your ideas rather than worrying about formatting. With a variety of designs to choose from, you are sure to find one that suits your needs. And with animations and unique photos, illustrations, and fonts, you can make your presentation pop. So whether you are giving a sales pitch or presenting to the board, make sure to check out Slidegeeks first.

Clustered Column Line Ppt PowerPoint Presentation Portfolio Outline
This is a clustered column line ppt powerpoint presentation portfolio outline. This is a four stage process. The stages in this process are sales in percentage, financial year, product, graph, growth.
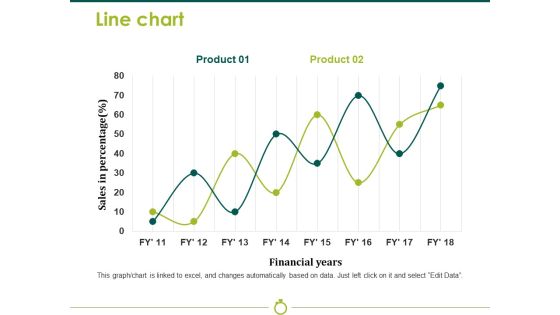
Line Chart Template 2 Ppt PowerPoint Presentation Model Background Image
This is a line chart template 2 ppt powerpoint presentation model background image. This is a two stage process. The stages in this process are sales in percentage, financial years, business, marketing, strategy, graph.

Combo Chart Ppt PowerPoint Presentation Summary Layouts
This is a combo chart ppt powerpoint presentation summary layouts. This is a eight stage process. The stages in this process are product, sales in percentage, in years, in price, graph.

Scatter Chart Ppt PowerPoint Presentation Slides Summary
This is a scatter chart ppt powerpoint presentation slides summary. This is a nine stage process. The stages in this process are sales in percentage, growth, graph, business, marketing.
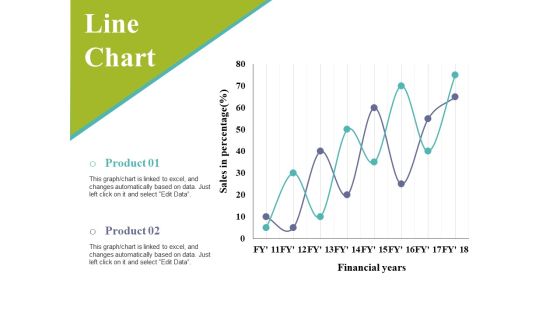
Line Chart Ppt PowerPoint Presentation Infographic Template Slides
This is a line chart ppt powerpoint presentation infographic template slides. This is a two stage process. The stages in this process are sales in percentage, financial years, business, marketing, graph.

Combo Chart Ppt PowerPoint Presentation Shapes
This is a combo chart ppt powerpoint presentation shapes. This is a eight stage process. The stages in this process are combo chart, business, marketing, sales in percentage, bar graph.

Bar Chart Ppt PowerPoint Presentation Icon Design Templates
This is a bar chart ppt powerpoint presentation icon design templates. This is a nine stage process. The stages in this process are sales in percentage, bar graph, business, marketing, growth.

Line Chart Ppt PowerPoint Presentation Ideas Example
This is a line chart ppt powerpoint presentation ideas example. This is a two stage process. The stages in this process are sales in percentage, bar graph, business, marketing, growth.

Area Chart Ppt PowerPoint Presentation Styles Images
This is a area chart ppt powerpoint presentation styles images. This is a two stage process. The stages in this process are sales in percentage, product, graph, business, marketing.
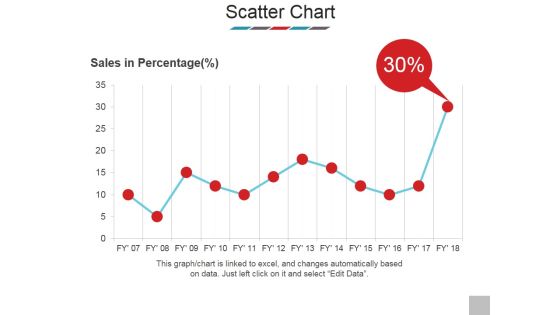
Scatter Chart Ppt PowerPoint Presentation Model Show
This is a scatter chart ppt powerpoint presentation model show. This is a one stage process. The stages in this process are sales in percentage, scatter chart, business, bar graph, marketing.

Clustered Column Line Ppt PowerPoint Presentation Model Rules
This is a clustered column line ppt powerpoint presentation model rules. This is a four stage process. The stages in this process are financial year, sales in percentage, business, marketing, growth, graph.

Bar Chart Ppt PowerPoint Presentation File Slide
This is a bar chart ppt powerpoint presentation file slide. This is a one stage process. The stages in this process are sales in percentage financial years, business, marketing, strategy, graph.
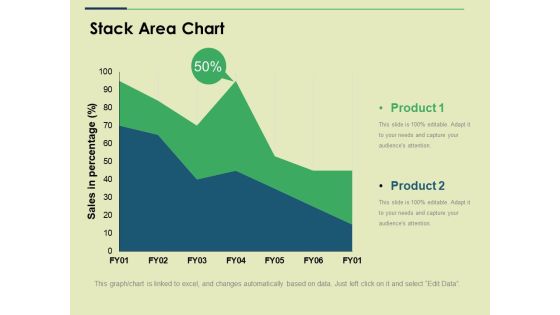
Stack Area Chart Ppt PowerPoint Presentation Show Slide
This is a stack area chart ppt powerpoint presentation show slide. This is a two stage process. The stages in this process are sales in percentage, business, marketing, strategy, graph.

Area Chart Ppt PowerPoint Presentation File Visuals
This is a area chart ppt powerpoint presentation file visuals. This is a two stage process. The stages in this process are business, sales in percentage, marketing, graph, strategy, finance.
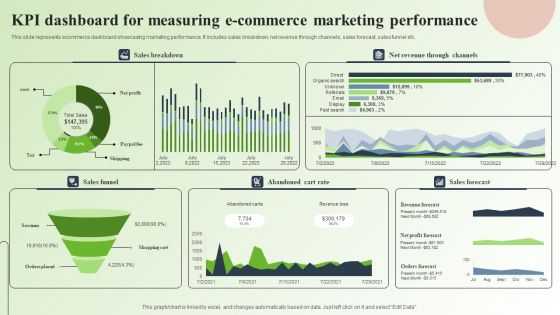
Strategic Guide For Mastering E Commerce Marketing Kpi Dashboard For Measuring E Commerce Marketing Performance Infographics PDF
This slide represents ecommerce dashboard showcasing marketing performance. It includes sales breakdown, net revenue through channels, sales forecast, sales funnel etc. Slidegeeks is here to make your presentations a breeze with Strategic Guide For Mastering E Commerce Marketing Kpi Dashboard For Measuring E Commerce Marketing Performance Infographics PDF With our easy to use and customizable templates, you can focus on delivering your ideas rather than worrying about formatting. With a variety of designs to choose from, you are sure to find one that suits your needs. And with animations and unique photos, illustrations, and fonts, you can make your presentation pop. So whether you are giving a sales pitch or presenting to the board, make sure to check out Slidegeeks first.

Clustered Column Ppt PowerPoint Presentation Slides Ideas
This is a clustered column ppt powerpoint presentation slides ideas. This is a two stage process. The stages in this process are sales in percentage, business, marketing, finance, graph.

Stacked Column Ppt PowerPoint Presentation Infographics Samples
This is a stacked column ppt powerpoint presentation infographics samples. This is a two stage process. The stages in this process are product, sales in percentage, business, marketing, graph.

Clustered Column Ppt PowerPoint Presentation Ideas Graphic Tips
This is a clustered column ppt powerpoint presentation ideas graphic tips. This is a two stage process. The stages in this process are financial year, sales in percentage, product, graph, business.
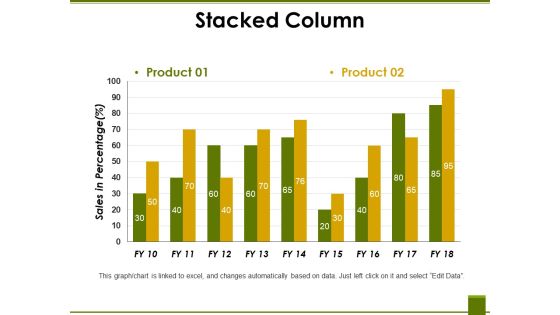
Stacked Column Ppt PowerPoint Presentation Professional Vector
This is a stacked column ppt powerpoint presentation professional vector. This is a two stage process. The stages in this process are product, sales in percentage, business, marketing, graph.

Bar Chart Ppt PowerPoint Presentation Layouts Pictures
This is a bar chart ppt powerpoint presentation layouts pictures. This is a three stage process. The stages in this process are bar graph, product, sales in percentage, business, marketing.

Clustered Column Ppt PowerPoint Presentation Portfolio Smartart
This is a clustered column ppt powerpoint presentation portfolio smartart. This is a two stage process. The stages in this process are financial year, product, sales in percentage, finance, business, graph.

Bar Chart Ppt PowerPoint Presentation Styles Outfit
This is a bar chart ppt powerpoint presentation styles outfit. This is a Seven stage process. The stages in this process are sales in percentage, financial years, graph, business.

Clustered Column Ppt PowerPoint Presentation Pictures Mockup
This is a clustered column ppt powerpoint presentation pictures mockup. This is a two stage process. The stages in this process are product, sales in percentage, financial year, graph, business.

Area Chart Ppt PowerPoint Presentation Layouts Maker
This is a area chart ppt powerpoint presentation layouts maker. This is a two stage process. The stages in this process are financial year, sales in percentage, graph, business, marketing.

Clustered Column Ppt PowerPoint Presentation Slides Smartart
This is a clustered column ppt powerpoint presentation slides smartart. This is a two stage process. The stages in this process are product, sales in percentage, financial year, bar graph.

Area Chart Ppt PowerPoint Presentation Professional Brochure
This is a area chart ppt powerpoint presentation professional brochure. This is a two stage process. The stages in this process are sales in percentage, business, marketing, finance, graph.

Bar Chart Ppt PowerPoint Presentation Portfolio Diagrams
This is a bar chart ppt powerpoint presentation portfolio diagrams. This is a three stage process. The stages in this process are sales in percentage, business, marketing, graph, finance.

Column Chart Ppt PowerPoint Presentation Gallery Background
This is a column chart ppt powerpoint presentation gallery background. This is a two stage process. The stages in this process are product, sales in percentage, financial year, graph, success.
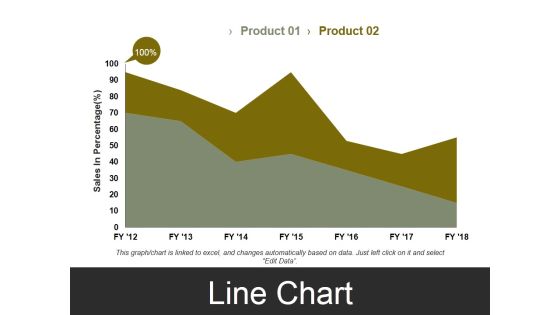
Line Chart Template 3 Ppt PowerPoint Presentation Styles Visual Aids
This is a line chart template 3 ppt powerpoint presentation styles visual aids. This is a two stage process. The stages in this process are sales in percentage, business, marketing, finance, graph.

Clustered Column Ppt PowerPoint Presentation File Graphics
This is a clustered column ppt powerpoint presentation file graphics. This is a two stage process. The stages in this process are product, financial year, sales in percentage, graph, growth.

area chart ppt powerpoint presentation professional elements
This is a area chart ppt powerpoint presentation professional elements. This is a two stage process. The stages in this process are financial year sales in percentage, business, marketing, graph.

clustered column line ppt powerpoint presentation ideas example
This is a clustered column line ppt powerpoint presentation ideas example. This is a three stage process. The stages in this process are sales in percentage, business, marketing, finance, graph.

Bar Chart Ppt PowerPoint Presentation Icon Information
This is a bar chart ppt powerpoint presentation icon information. This is a one stage process. The stages in this process are product, sales in percentage, financial years, bar graph, growth.

Clustered Column Ppt PowerPoint Presentation Show Graphics
This is a clustered column ppt powerpoint presentation show graphics. This is a two stage process. The stages in this process are financial year, sales in percentage, business, marketing, graph.

Bar Diagram Ppt PowerPoint Presentation Gallery Structure
This is a bar diagram ppt powerpoint presentation gallery structure. This is a three stage process. The stages in this process are financial in years, sales in percentage, bar graph, growth, success.

Column Chart Ppt PowerPoint Presentation Layouts Tips
This is a column chart ppt powerpoint presentation layouts tips. This is a six stage process. The stages in this process are sales in percentage, financial year, bar graph, growth, success.

Bar Diagram Ppt PowerPoint Presentation Pictures Background Image
This is a bar diagram ppt powerpoint presentation pictures background image. This is a three stage process. The stages in this process are financial in years, sales in percentage, bar graph, growth, success.

Column Chart Ppt PowerPoint Presentation Slides Visual Aids
This is a column chart ppt powerpoint presentation slides visual aids. This is a six stage process. The stages in this process are bar graph, growth, success, sales in percentage, financial year.

Bar Chart Ppt PowerPoint Presentation Diagram Lists
This is a bar chart ppt powerpoint presentation diagram lists. This is a two stage process. The stages in this process are business, marketing, financial years, sales in percentage, graph.

Column Chart Ppt PowerPoint Presentation Icon Guide
This is a column chart ppt powerpoint presentation icon guide. This is a two stage process. The stages in this process are business, year, sales in percentage, marketing, graph.

Bar Chart Ppt PowerPoint Presentation Visual Aids Diagrams
This is a bar chart ppt powerpoint presentation visual aids diagrams. This is a two stage process. The stages in this process are business, marketing, financial years, sales in percentage, graph.

Area Chart Ppt PowerPoint Presentation Summary Information
This is a area chart ppt powerpoint presentation summary information. This is a two stage process. The stages in this process are business, sales in percentage, percentage, marketing, graph.

Clustered Column Ppt PowerPoint Presentation Gallery Format
This is a clustered column ppt powerpoint presentation gallery format. This is a two stage process. The stages in this process are business, marketing, graph, financial year, sales in percentage.

Area Chart Ppt PowerPoint Presentation Pictures Vector
This is a area chart ppt powerpoint presentation pictures vector. This is a two stage process. The stages in this process are sales in percentage, business, marketing, graph, percentage.

Column Chart Ppt PowerPoint Presentation Infographic Template Icon
This is a column chart ppt powerpoint presentation infographic template icon. This is a two stage process. The stages in this process are business, marketing, sales in percentage, financial year, graph.
