AI PPT Maker
Templates
PPT Bundles
Design Services
Business PPTs
Business Plan
Management
Strategy
Introduction PPT
Roadmap
Self Introduction
Timelines
Process
Marketing
Agenda
Technology
Medical
Startup Business Plan
Cyber Security
Dashboards
SWOT
Proposals
Education
Pitch Deck
Digital Marketing
KPIs
Project Management
Product Management
Artificial Intelligence
Target Market
Communication
Supply Chain
Google Slides
Research Services
 One Pagers
All Categories
-
Home
- Customer Favorites
- Sales Coordinator
Sales Coordinator
Stock Photo Bar Graph On Circular Web PowerPoint Slide
This image slide displays bar garph on circular web. This image slide helps you to make business and sales related presenations. Deliver amazing presentations to mesmerize your audience.
KPI Dashboard To Track Services Company Strategy Business Marketing Performance Guidelines PDF
Following slide demonstrates dashboard for monitoring services company sales strategy impact on maximizing business profits. It includes elements such as number of sales, revenue, profit, cost, monthly sales revenue, cost breakdown, up and cross sell, revenue collected and sales by communication channel. Showcasing this set of slides titled KPI Dashboard To Track Services Company Strategy Business Marketing Performance Guidelines PDF. The topics addressed in these templates are Revenue, Profit, Cost. All the content presented in this PPT design is completely editable. Download it and make adjustments in color, background, font etc. as per your unique business setting.

Area Chart Ppt PowerPoint Presentation Icon Gallery
This is a area chart ppt powerpoint presentation icon gallery. This is a two stage process. The stages in this process are sales in percentage, product, bar graph.

Bar Chart Ppt PowerPoint Presentation Microsoft
This is a bar chart ppt powerpoint presentation microsoft. This is a eleven stage process. The stages in this process are sales in percentage, fy, graph, success, business.

Stock Market Crash Business PowerPoint Templates And PowerPoint Backgrounds 0811
Microsoft PowerPoint Template and Background with a man deeply depressed due to a drop in the graph to represent stock losses sales losses

Well Being Gymnasium Sector Products And Services Segmentations Pictures PDF
In this slide we are covering gym, health and fitness clubs product and services segments such as membership fees, personal training services, guest admission sales, merchandise sales, spa services and many more. Deliver and pitch your topic in the best possible manner with this well being gymnasium sector products and services segmentations pictures pdf. Use them to share invaluable insights on membership fees, merchandise sales, personal training services, meals and beverages, admission sales and impress your audience. This template can be altered and modified as per your expectations. So, grab it now.

B2B Marketing Content Administration Playbook Prospect Nurturing Content Clipart PDF
This slide provides information regarding sales management activities tracking dashboard to measure closed business, sales pipeline, sales activity by sales rep, month over month growth, forecast by month, etc.Deliver and pitch your topic in the best possible manner with this b2b marketing content administration playbook prospect nurturing content clipart pdf Use them to share invaluable insights on regarding new opportunities, webinar event invitation, local initiatives and impress your audience. This template can be altered and modified as per your expectations. So, grab it now.

Marketing And Operation Planning Dashboard To Drive Better Performance Graphics PDF
This slide covers sales and operations planning dashboard to improve performance. It involves bookings plan, year on year growth, bookings plan per year and total growth and sales made by sales manager. Showcasing this set of slides titled Marketing And Operation Planning Dashboard To Drive Better Performance Graphics PDF. The topics addressed in these templates are Sales Manager, Growth Made, Bookings Plan By Year. All the content presented in this PPT design is completely editable. Download it and make adjustments in color, background, font etc. as per your unique business setting.

Marketing And Operations Dashboard For Distribution Company Guidelines PDF
This slide covers sales and operations dashboard for distribution company. It involves details such as total sales by location, gross margin, monthly sales trends, average revenue and sales by major customers. Pitch your topic with ease and precision using this Marketing And Operations Dashboard For Distribution Company Guidelines PDF. This layout presents information on Gross Margin, Actual Vs Budget, Product. It is also available for immediate download and adjustment. So, changes can be made in the color, design, graphics or any other component to create a unique layout.

Business Performance Review Dashboard To Measure Overall Business Performance Formats PDF
The following slide highlights a comprehensive quarterly business review QBR dashboard which can be used by the organization to evaluate business performance. The metrics used for review are total revenue, new customers, gross profit, overall costs, sales comparison, sales by different products and top performing channels. Showcasing this set of slides titled Business Performance Review Dashboard To Measure Overall Business Performance Formats PDF. The topics addressed in these templates are Sales Comparison, Sales Product, High Performing. All the content presented in this PPT design is completely editable. Download it and make adjustments in color, background, font etc. as per your unique business setting.
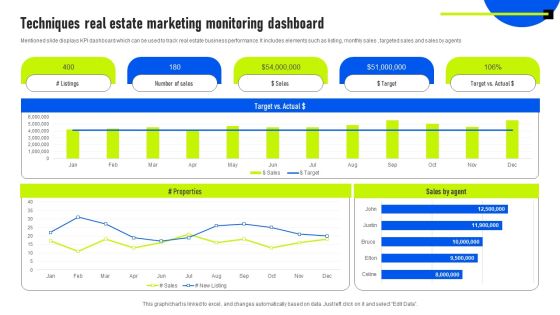
Techniques Real Estate Marketing Monitoring Dashboard Guidelines PDF
Mentioned slide displays KPI dashboard which can be used to track real estate business performance. It includes elements such as listing, monthly sales , targeted sales and sales by agents. Pitch your topic with ease and precision using this Techniques Real Estate Marketing Monitoring Dashboard Guidelines PDF. This layout presents information on Sales By Agent, Target, Marketing Monitoring Dashboard. It is also available for immediate download and adjustment. So, changes can be made in the color, design, graphics or any other component to create a unique layout.

CRM Transformation Toolkit Customer Relationship Business Capability Model Sample PDF
The CRM capability model includes value added functions associated to customer relationship management such as lead management, sales management, sales forecasting, etc. This is a CRM Transformation Toolkit Customer Relationship Business Capability Model Sample PDF template with various stages. Focus and dispense information on six stages using this creative set, that comes with editable features. It contains large content boxes to add your information on topics like Sales Forecasting, Opportunity Management, Sales Management. You can also showcase facts, figures, and other relevant content using this PPT layout. Grab it now.

Area Chart Ppt PowerPoint Presentation Samples
This is a area chart ppt powerpoint presentation samples. This is a two stage process. The stages in this process are financial year, sales in percentage, jan, feb.

Area Chart Ppt PowerPoint Presentation Show
This is a area chart ppt powerpoint presentation show. This is a two stage process. The stages in this process are sales in percentage, business, marketing, analysis, success.

Bar Chart Ppt PowerPoint Presentation Styles
This is a bar chart ppt powerpoint presentation styles. This is a nine stage process. The stages in this process are business, management, sales in percentage, growth.
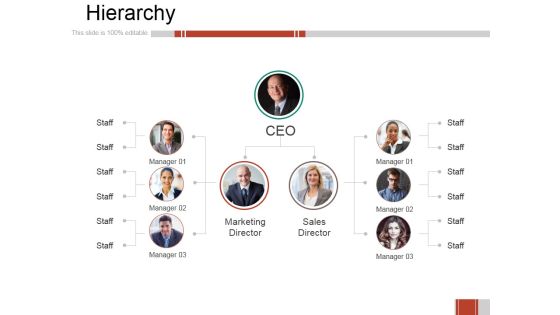
Hierarchy Ppt PowerPoint Presentation Show Example Introduction
This is a hierarchy ppt powerpoint presentation show example introduction. This is a three stage process. The stages in this process are marketing director, sales director, manager, staff.

Column Chart Ppt PowerPoint Presentation Professional Aids
This is a column chart ppt powerpoint presentation professional aids. This is a two stage process. The stages in this process are product, sales in percentage, financial years.

Column Chart Ppt PowerPoint Presentation Gallery Layout
This is a column chart ppt powerpoint presentation gallery layout. This is a two stage process. The stages in this process are product, sales in percentage, year.
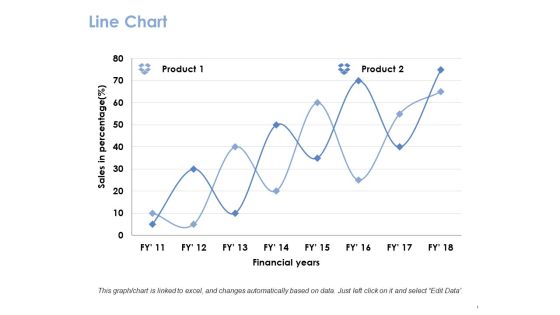
Line Chart Ppt PowerPoint Presentation Gallery Guide
This is a line chart ppt powerpoint presentation gallery guide. This is a two stage process. The stages in this process are product, financial years, sales in percentage.

Area Chart Ppt PowerPoint Presentation Styles Professional
This is a area chart ppt powerpoint presentation styles professional. This is a two stage process. The stages in this process are sales in percentage, product, area chart.

Area Chart Ppt PowerPoint Presentation Portfolio Examples
This is a area chart ppt powerpoint presentation portfolio examples. This is a two stage process. The stages in this process are product, area chart, sales in percentage.
Line Chart Ppt PowerPoint Presentation Icon Inspiration
This is a line chart ppt powerpoint presentation icon inspiration. This is a two stage process. The stages in this process are product, financial years, sales in percentage.

Org Chart Of Technology Company Ppt PowerPoint Presentation Gallery Slide PDF
Mentioned slide highlights org chart of technology company which can provide details to the management of sales teams, marketing manager, program manager, lead architect, etc. Persuade your audience using this Org Chart Of Technology Company Ppt PowerPoint Presentation Gallery Slide PDF. This PPT design covers three stages, thus making it a great tool to use. It also caters to a variety of topics including Global Sales, Global Sales Director, Sales Teams. Download this PPT design now to present a convincing pitch that not only emphasizes the topic but also showcases your presentation skills.

Hierarchy Ppt PowerPoint Presentation Infographics Diagrams
This is a hierarchy ppt powerpoint presentation infographics diagrams. This is a five stage process. The stages in this process are ceo, engineer, sales and marketing, editor, manager.

Area Chart Ppt PowerPoint Presentation Inspiration Images
This is a area chart ppt powerpoint presentation inspiration images. This is a two stage process. The stages in this process are area chart, product, sales in percentage.

3d Graphical Navigation Arrows 5 Stages Flow Chart Project PowerPoint Templates
We present our 3d graphical navigation arrows 5 stages flow chart project PowerPoint templates. Use our Business PowerPoint Templates because, Now you have to coordinate and motivate your team. Use our Design PowerPoint Templates because, are the Tools of the Trade. Use our Shapes PowerPoint Templates because; illustrate your plans on using the many social media modes available to inform society at large of the benefits of your product. Use our Metaphor PowerPoint Templates because, you are the star of your enlightened team. Use our Process and Flows PowerPoint Templates because, Sales Template: - Generation of sales is the core of any business. Use these PowerPoint slides for presentations relating to arrows, badge, balloon, bar, blank, blue, bright, bubbles, buttons, circle, color, cross, design, designs, drop, elements, glossy, glowing, graphic, hexagon, icon, illustration, navigation, round, seals, set, shadow, shapes, shiny, sign, speech, squares, stars, stickers, symbol. The prominent colors used in the PowerPoint template are Blue, Gray, and Black
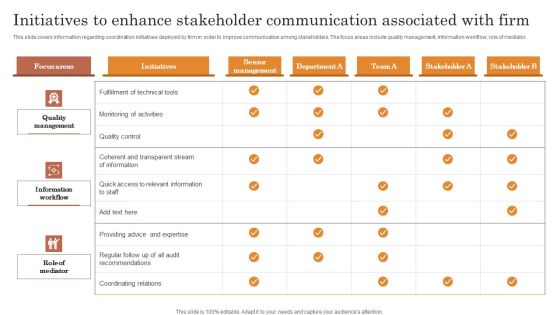
Initiatives To Enhance Stakeholder Communication Associated With Firm Summary PDF
This slide covers information regarding coordination initiatives deployed by firm in order to improve communication among stakeholders. The focus areas include quality management, information workflow, role of mediator. Make sure to capture your audiences attention in your business displays with our gratis customizable Initiatives To Enhance Stakeholder Communication Associated With Firm Summary PDF. These are great for business strategies, office conferences, capital raising or task suggestions. If you desire to acquire more customers for your tech business and ensure they stay satisfied, create your own sales presentation with these plain slides.
Step Wise Initiative For Cost Estimation Agile Project Management Cost Budgeting Guide Template PDF
This slide provides information regarding key benefits associated to effective estimation in terms of better decision making, enhanced coordination and improved risk management. Make sure to capture your audiences attention in your business displays with our gratis customizable Step-Wise Initiative For Cost Estimation Agile Project Management Cost Budgeting Guide Template PDF. These are great for business strategies, office conferences, capital raising or task suggestions. If you desire to acquire more customers for your tech business and ensure they stay satisfied, create your own sales presentation with these plain slides.
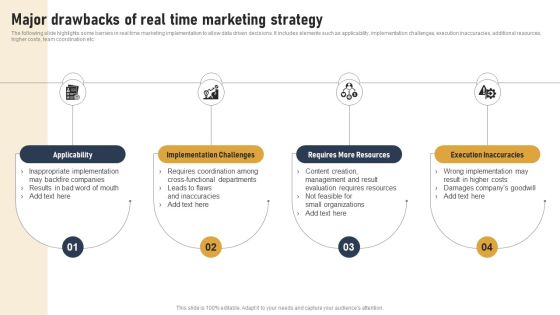
Incorporating Real Time Marketing For Improved Consumer Major Drawbacks Of Real Time Marketing Professional PDF
The following slide highlights some barriers in real time marketing implementation to allow data driven decisions. It includes elements such as applicability, implementation challenges, execution inaccuracies, additional resources, higher costs, team coordination etc. Make sure to capture your audiences attention in your business displays with our gratis customizable Incorporating Real Time Marketing For Improved Consumer Major Drawbacks Of Real Time Marketing Professional PDF. These are great for business strategies, office conferences, capital raising or task suggestions. If you desire to acquire more customers for your tech business and ensure they stay satisfied, create your own sales presentation with these plain slides.
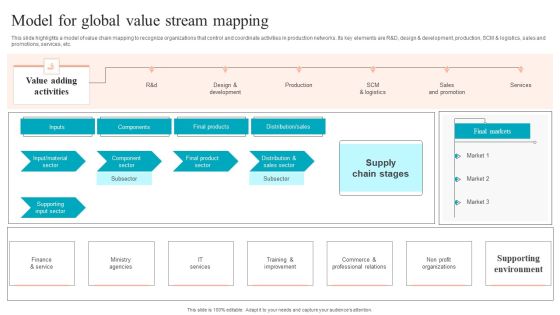
Model For Global Value Stream Mapping Topics PDF
This slide highlights a model of value chain mapping to recognize organizations that control and coordinate activities in production networks. Its key elements are R and D, design and development, production, SCM and logistics, sales and promotions, services, etc. Showcasing this set of slides titled Model For Global Value Stream Mapping Topics PDF. The topics addressed in these templates are Finance Service, Ministry Agencies, It Services. All the content presented in this PPT design is completely editable. Download it and make adjustments in color, background, font etc. as per your unique business setting.

Functional Organizational Reporting Structure Grid Background PDF
The following slide depicts the organizational structure to establish clarity in reporting relationships and coordinate the tasks. It includes departmental reporting heads such as production, finance, marketing, sales etc. Pitch your topic with ease and precision using this Functional Organizational Reporting Structure Grid Background PDF. This layout presents information on Production Head, Finance Head, Marketing Head. It is also available for immediate download and adjustment. So, changes can be made in the color, design, graphics or any other component to create a unique layout.
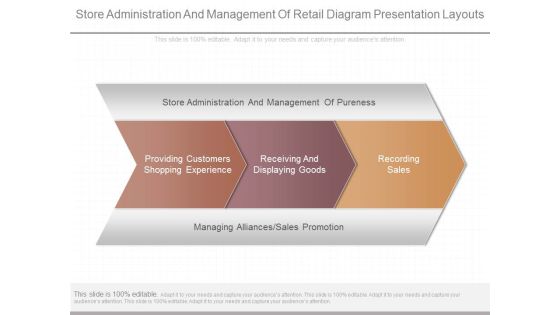
Store Administration And Management Of Retail Diagram Presentation Layouts
This is a store administration and management of retail diagram presentation layouts. This is a three stage process. The stages in this process are store administration and management of pureness, providing customers shopping experience, receiving and displaying goods, recording sales, managing alliances sales promotion.

Expense Model Template 1 Ppt PowerPoint Presentation Slides Format Ideas
This is a expense model template 1 ppt powerpoint presentation slides format ideas. This is a two stage process. The stages in this process are key expenses needed to generate revenue, any unique strategic alliances, how long is sales cycle to get a client, average cost to acquire a customer, cost to maintain a customer and build a recurring sales.
Expense Model Template 2 Ppt PowerPoint Presentation Gallery Infographic Template
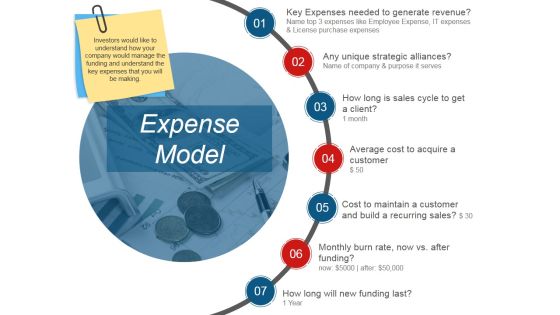
This is a expense model template 2 ppt powerpoint presentation gallery infographic template. This is a seven stage process. The stages in this process are key expenses needed to generate revenue, any unique strategic alliances, how long is sales cycle to get a client, average cost to acquire a customer, cost to maintain a customer and build a recurring sales.

Expense Model Ppt PowerPoint Presentation Slides
This is a expense model ppt powerpoint presentation slides. This is a seven stage process. The stages in this process are key expenses needed to generate revenue, any unique strategic alliances, how long is sales cycle to get a client, average cost to acquire a customer, cost to maintain a customer and build a recurring sales.
Strategy Formulation Acquisition Opportunity Timeline Ppt Examples
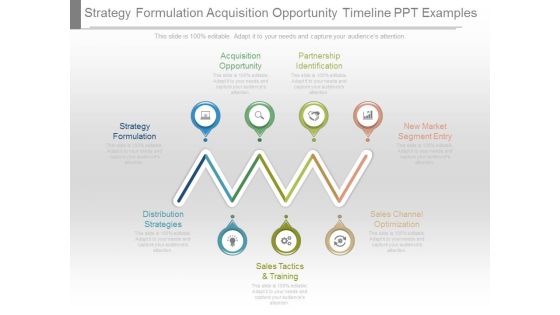
This is a strategy formulation acquisition opportunity timeline ppt examples. This is a seven stage process. The stages in this process are acquisition opportunity, partnership identification, new market segment entry, sales, channel optimization, sales tactics and training, distribution strategies, strategy formulation.
Global Organization Marketing Strategy Development Expansion Goals Structure PDF
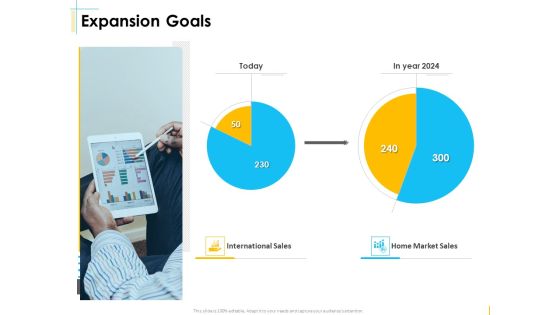
Deliver an awe inspiring pitch with this creative global organization marketing strategy development expansion goals structure pdf bundle. Topics like international sales, home market sales can be discussed with this completely editable template. It is available for immediate download depending on the needs and requirements of the user.
Global Marketing Targeting Strategies Commodities Services Expansion Goals Elements PDF
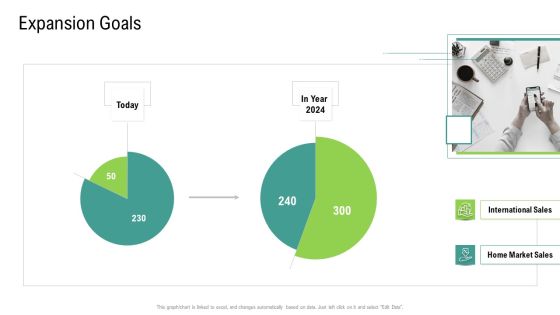
Deliver an awe inspiring pitch with this creative global marketing targeting strategies commodities services expansion goals elements pdf. bundle. Topics like international sales, home market sales can be discussed with this completely editable template. It is available for immediate download depending on the needs and requirements of the user.
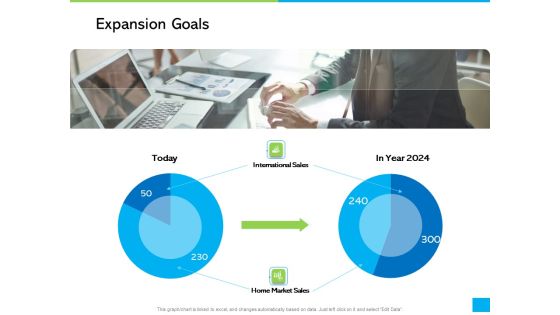
How Develop Perfect Growth Strategy For Your Company Expansion Goals Ppt Diagrams PDF
Deliver an awe-inspiring pitch with this creative how develop perfect growth strategy for your company expansion goals ppt diagrams pdf bundle. Topics like expansion goals, international sales, home market sales can be discussed with this completely editable template. It is available for immediate download depending on the needs and requirements of the user.
Expansion Oriented Strategic Plan Business Performance Dashboard Ppt PowerPoint Presentation Styles Icon PDF
Presenting this set of slides with name expansion oriented strategic plan business performance dashboard ppt powerpoint presentation styles icon pdf. The topics discussed in these slides are revenue, new customers, gross profit, customer satisfaction, sales comparison, sales month. This is a completely editable PowerPoint presentation and is available for immediate download. Download now and impress your audience.
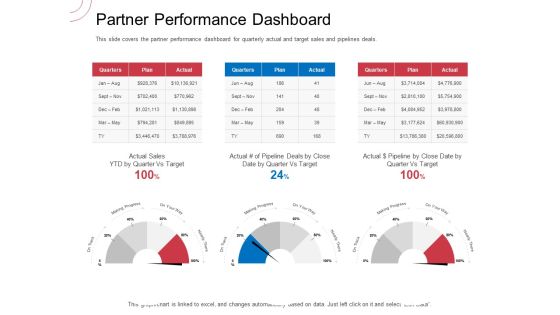
Indirect Channel Marketing Initiatives Partner Performance Dashboard Pictures PDF
This slide covers the partner performance dashboard for quarterly actual and target sales and pipelines deals. Deliver an awe inspiring pitch with this creative indirect channel marketing initiatives partner performance dashboard pictures pdf bundle. Topics like sales, target, actual, plan can be discussed with this completely editable template. It is available for immediate download depending on the needs and requirements of the user.
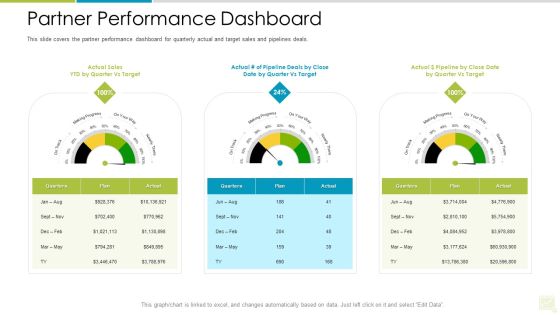
Distributor Entitlement Initiatives Partner Performance Dashboard Sample PDF
This slide covers the partner performance dashboard for quarterly actual and target sales and pipelines deals. Deliver an awe inspiring pitch with this creative distributor entitlement initiatives partner performance dashboard sample pdf bundle. Topics like sales, target, actual, plan can be discussed with this completely editable template. It is available for immediate download depending on the needs and requirements of the user.

Competition In Market Marketing Management Dashboard Category Ppt Gallery Smartart PDF
Deliver and pitch your topic in the best possible manner with this competition in market marketing management dashboard category ppt gallery smartart pdf. Use them to share invaluable insights on revenue and sales sales by product category and impress your audience. This template can be altered and modified as per your expectations. So, grab it now.

Stock Pitch For Fast Food Restaurants Delivery III Strong Potential Upside From Comp 1 Structure PDF
Deliver an awe-inspiring pitch with this creative stock pitch for fast food restaurants delivery iii strong potential upside from comp 1 structure pdf bundle. Topics like member sales, mobile payment, same store sales growth can be discussed with this completely editable template. It is available for immediate download depending on the needs and requirements of the user.

Ecommerce Management KPI Dashboard Product Ppt Inspiration Slides PDF
Deliver and pitch your topic in the best possible manner with this ecommerce management kpi dashboard product ppt inspiration slides pdf. Use them to share invaluable insights on salesforce accounts by country, marketing expenses and sales, sales by product and impress your audience. This template can be altered and modified as per your expectations. So, grab it now.

Business Management Dashboards Revenue Designs PDF
Deliver and pitch your topic in the best possible manner with this business management dashboards revenue designs pdf. Use them to share invaluable insights on revenue and sales, sales by product category and impress your audience. This template can be altered and modified as per your expectations. So, grab it now.
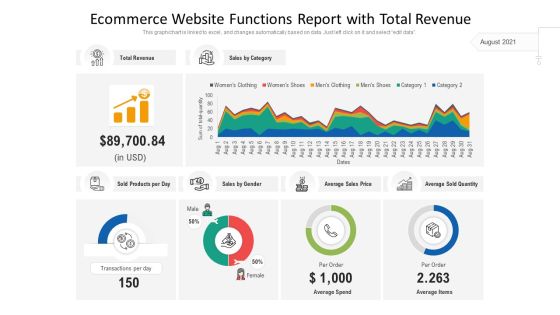
Ecommerce Website Functions Report With Total Revenue Ppt PowerPoint Presentation File Elements PDF
Showcasing this set of slides titled ecommerce website functions report with total revenue ppt powerpoint presentation file elements pdf. The topics addressed in these templates are sales by gende, sold products per day, average sales price. All the content presented in this PPT design is completely editable. Download it and make adjustments in color, background, font etc. as per your unique business setting.

Cloud Business Intelligence Dashboard Ppt Outline Display PDF
Deliver and pitch your topic in the best possible manner with this cloud business intelligence dashboard ppt outline display pdf. Use them to share invaluable insights on social interactions, sales metrics, sales and impress your audience. This template can be altered and modified as per your expectations. So, grab it now.

Online Corporate Approach Ecommerce Management KPI Dashboard Avg Topics PDF
Deliver and pitch your topic in the best possible manner with this online corporate approach ecommerce management kpi dashboard avg topics pdf. Use them to share invaluable insights on conversions and sales, product price, sales by product and impress your audience. This template can be altered and modified as per your expectations. So, grab it now.

Salesperson Performance Scorecard With Status And Goal Slides PDF
Deliver and pitch your topic in the best possible manner with this Salesperson Performance Scorecard With Status And Goal Slides PDF. Use them to share invaluable insights on Total Sales, Total Sales Goal and impress your audience. This template can be altered and modified as per your expectations. So, grab it now.

Addressing Workforce Required Training Across Different Departments Inspiration PDF
This slide provides information regarding key people requiring training across different departments. Deliver an awe inspiring pitch with this creative Addressing Workforce Required Training Across Different Departments Inspiration PDF bundle. Topics like Customer Service Representatives, Outside Sales Team, Inside Sales Team can be discussed with this completely editable template. It is available for immediate download depending on the needs and requirements of the user.

Commercial Policy Design Powerpoint Images
This is a commercial policy design powerpoint images. This is a six stage process. The stages in this process are sales and channel strategy and infrastructure, sales and channel management, commercial policy design, trade marketing incentive program, distribution development, wholesale retail mapping.

Chart Showing Hierarchy Of An Organization Ppt PowerPoint Presentation Pictures Influencers
Presenting this set of slides with name chart showing hierarchy of an organization ppt powerpoint presentation pictures influencers. This is a three stage process. The stages in this process are top sales executive, foreign sales manager, organization. This is a completely editable PowerPoint presentation and is available for immediate download. Download now and impress your audience.
Horizontal Organizational Structure For Various Departments Ppt PowerPoint Presentation Icon Deck PDF
Presenting horizontal organizational structure for various departments ppt powerpoint presentation icon deck pdf to dispense important information. This template comprises three stages. It also presents valuable insights into the topics including marketing and sales, sales director, operational manager. This is a completely customizable PowerPoint theme that can be put to use immediately. So, download it and address the topic impactfully.

Digital Marketing Toolkit Marketing Transformation Performance Program Checklist Graphics PDF
This slide covers the marketing program checklist for marketing funding management, sales performance, marketing OR sales development, marketing sales tools and marketing sales partnership. Slidegeeks is here to make your presentations a breeze with Digital Marketing Toolkit Marketing Transformation Performance Program Checklist Graphics PDF With our easy-to-use and customizable templates, you can focus on delivering your ideas rather than worrying about formatting. With a variety of designs to choose from, you are sure to find one that suits your needs. And with animations and unique photos, illustrations, and fonts, you can make your presentation pop. So whether you are giving a sales pitch or presenting to the board, make sure to check out Slidegeeks first
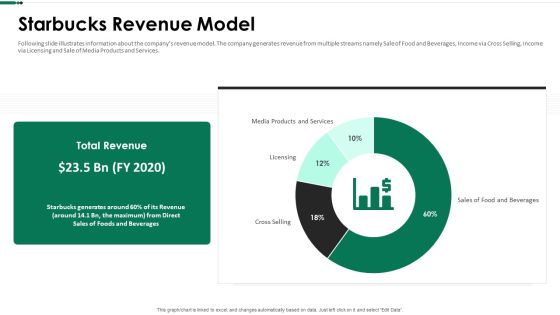
Starbucks Revenue Model Ppt Ideas Picture PDF
Following slide illustrates information about the companys revenue model. The company generates revenue from multiple streams namely Sale of Food and Beverages, Income via Cross Selling, Income via Licensing and Sale of Media Products and Services. Deliver an awe inspiring pitch with this creative starbucks revenue model ppt ideas picture pdf bundle. Topics like media products and services, sales of food and beverages, licensing, cross selling can be discussed with this completely editable template. It is available for immediate download depending on the needs and requirements of the user.

Real Estate Marketing Plan To Sell Property Management KPI Dashboard Professional PDF
This slide portrays property management dashboard with KPIs namely, average days on market, properties for sale, properties for rent, sales vs. target and sales by region.Deliver and pitch your topic in the best possible manner with this Real Estate Marketing Plan To Sell Property Management KPI Dashboard Professional PDF Use them to share invaluable insights on Property Management KPI Dashboard and impress your audience. This template can be altered and modified as per your expectations. So, grab it now.

B2c Inbound Partnership Content Marketing Trends Ppt PowerPoint Presentation Gallery Show PDF
This slide illustrates the benefits gained by the brand partners in the B2C inbound marketing. It includes percentage change in the major quantifiers like sales cycle, lead conversion rate, sales executives achievement quota, attainment of team quota and marketing lead acceptance. Presenting b2c inbound partnership content marketing trends ppt powerpoint presentation gallery show pdf to dispense important information. This template comprises five stages. It also presents valuable insights into the topics including sales, marketing, growth. This is a completely customizable PowerPoint theme that can be put to use immediately. So, download it and address the topic impactfully.
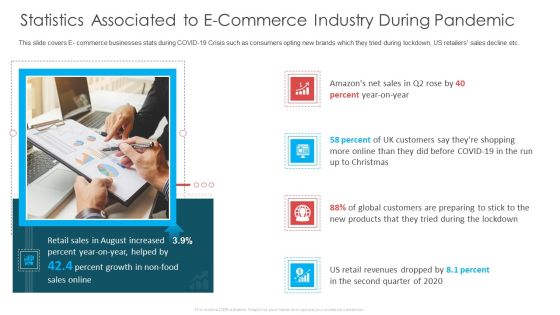
Statistics Associated To E Commerce Industry During Pandemic Ppt Ideas Infographic Template PDF
This slide covers E- commerce businesses stats during COVID-19 Crisis such as consumers opting new brands which they tried during lockdown, US retailers sales decline etc. Presenting statistics associated to e commerce industry during pandemic ppt ideas infographic template pdf to provide visual cues and insights. Share and navigate important information on four stages that need your due attention. This template can be used to pitch topics like retail sales, percent growth, sales online, customers, products. In addition, this PPT design contains high-resolution images, graphics, etc, that are easily editable and available for immediate download.

Emerging Technology Selling Forecasts Report Clipart PDF
This slide covers sales projections for consumer tech products. It includes unit sales for devices such wearable devices, smart speakers, smart home, 4K ultra televisions, virtual reality devices and drones along with percentage of unit sales growth and revenue projections. Showcasing this set of slides titled Emerging Technology Selling Forecasts Report Clipart PDF. The topics addressed in these templates are Emerging Technology Selling Forecasts, Market. All the content presented in this PPT design is completely editable. Download it and make adjustments in color, background, font etc. as per your unique business setting.

Action Plan To Enhance Customer Engagement Analytical Dashboard Elements PDF
This slide shows customer engagement analytical dashboard that covers total sales, total transaction, email received, links clicked, unique customer sales, sales comparison, customers name, product list. Present like a pro with Action Plan To Enhance Customer Engagement Analytical Dashboard Elements PDF Create beautiful presentations together with your team, using our easy-to-use presentation slides. Share your ideas in real-time and make changes on the fly by downloading our templates. So whether youre in the office, on the go, or in a remote location, you can stay in sync with your team and present your ideas with confidence. With Slidegeeks presentation got a whole lot easier. Grab these presentations today.

B2b Selling Tactics Dashboard To Maintain Productivity Introduction PDF
The following slide represents B2B selling tactics dashboard which allows executives and managers to effectively control sales and monitor them in one central place. It consists of total sales, payments, trends etc.Pitch your topic with ease and precision using this B2b Selling Tactics Dashboard To Maintain Productivity Introduction PDF. This layout presents information on Operational Effects, Stores Sales Trend, Conversion Rate. It is also available for immediate download and adjustment. So, changes can be made in the color, design, graphics or any other component to create a unique layout.

Brand Promotion Communication Strategy Dashboard For Analyzing Brand Perception Introduction PDF
This slide covers the dashboard for tracking brand reputation. It also includes metrics such as new customer lifetime value, customer acquisition cost, target met, above sales target, average weekly sales revenue, etc. Deliver an awe inspiring pitch with this creative Brand Promotion Communication Strategy Dashboard For Analyzing Brand Perception Introduction PDF bundle. Topics like New customer YTD, Sales revenue YTD, Profit YTD can be discussed with this completely editable template. It is available for immediate download depending on the needs and requirements of the user.

Business Key Performance Metrics Review Dashboard Portrait PDF
The following slide shows a dashboard of sales strategy review of firm that can be used by marketing, product, finance managers for reviewing the business. It further includes KPI that are revenue, new customer, gross profit purchaser satisfaction, income comparison, sales categories and profitability. Showcasing this set of slides titled Business Key Performance Metrics Review Dashboard Portrait PDF. The topics addressed in these templates are Sales, Revenue Comparison, Profitability. All the content presented in this PPT design is completely editable. Download it and make adjustments in color, background, font etc. as per your unique business setting.
Implementing Change Management Strategy To Transform Business Processes Dashboard Depicting Kpis To Track Icons PDF
This slide covers the dashboard that depicts metrics to track company sales performance that focuses on number of sales, cost breakdown, accumulated revenues, incremental sales, etc. Boost your pitch with our creative Implementing Change Management Strategy To Transform Business Processes Dashboard Depicting Kpis To Track Icons PDF. Deliver an awe-inspiring pitch that will mesmerize everyone. Using these presentation templates you will surely catch everyones attention. You can browse the ppts collection on our website. We have researchers who are experts at creating the right content for the templates. So you do not have to invest time in any additional work. Just grab the template now and use them.

PPM Private Equity Current Market Trends And Future Outlook Ppt PowerPoint Presentation Infographic Template Designs Download PDF
This slide shows the current market overview of some shopping mediums and US Retail E Commerce sales with a graph. Deliver an awe-inspiring pitch with this creative ppm private equity current market trends and future outlook ppt powerpoint presentation infographic template designs download pdf bundle. Topics like e commerce retail sales, expected account, global retail sales 2020, online research, purchases, preferred retail channel can be discussed with this completely editable template. It is available for immediate download depending on the needs and requirements of the user.
Marketing And Operations Dashboard For Ecommerce Business Icons PDF
This slide covers sales and operations dashboard for ecommerce business. It involves details such as total sales generated, number of brands, total revenue generated, number of units sold and gender and age range breakdown. Showcasing this set of slides titled Marketing And Operations Dashboard For Ecommerce Business Icons PDF. The topics addressed in these templates are Total Sales Generated, Total Revenue Generated, Returning Consumers. All the content presented in this PPT design is completely editable. Download it and make adjustments in color, background, font etc. as per your unique business setting.
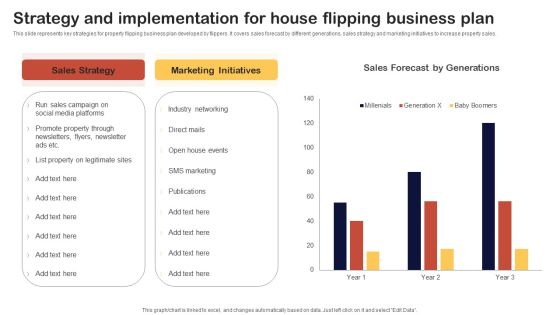
Synopsis For House Flipping Techniques Strategy And Implementation House Flipping Business Information PDF
This slide represents key strategies for property flipping business plan developed by flippers. It covers sales forecast by different generations, sales strategy and marketing initiatives to increase property sales. Find a pre designed and impeccable Synopsis For House Flipping Techniques Strategy And Implementation House Flipping Business Information PDF. The templates can ace your presentation without additional effort. You can download these easy to edit presentation templates to make your presentation stand out from others. So, what are you waiting for Download the template from Slidegeeks today and give a unique touch to your presentation.

Organic Business Growth Strategies Dashboard To Analyse Organic Growth Post Global Expansion Background PDF
Purpose of the following slide is to display a dashboard to help analyze the organic growth through essential metrics such as actual vs. target sales, gross profit, sales growth etc. Deliver and pitch your topic in the best possible manner with this Organic Business Growth Strategies Dashboard To Analyse Organic Growth Post Global Expansion Background PDF. Use them to share invaluable insights on Sales, Product, Target and impress your audience. This template can be altered and modified as per your expectations. So, grab it now.

Employee Recognition Award Current Situation In Our Company Ppt PowerPoint Presentation Ideas Background Images PDF
The purpose of this slide is to provide a graph showing the production and sales over the last 4 years in the organization, also defining the rationale behind the decrease in production and sales within the company. Deliver an awe-inspiring pitch with this creative employee recognition award current situation in our company ppt powerpoint presentation ideas background images pdf bundle. Topics like increase turnaround time, employees unable meet project deadline, employees feel lack motivation company, rationale behind decrease production and sales can be discussed with this completely editable template. It is available for immediate download depending on the needs and requirements of the user.
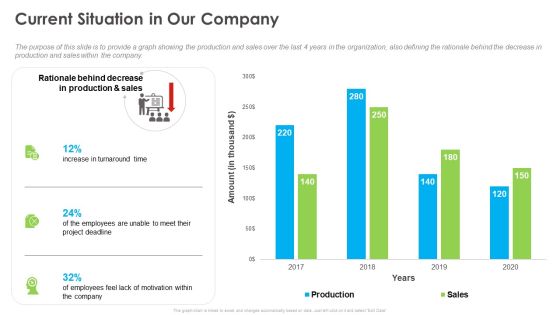
Outstanding Employee Current Situation In Our Company Ppt Show Example File PDF
The purpose of this slide is to provide a graph showing the production and sales over the last 4 years in the organization, also defining the rationale behind the decrease in production and sales within the company. Deliver an awe-inspiring pitch with this creative outstanding employee current situation in our company ppt show example file pdf bundle. Topics like production, sales, project deadline can be discussed with this completely editable template. It is available for immediate download depending on the needs and requirements of the user.

Submission Of Project Viability Report For Bank Loan Project Feasibility Financial Ratios Brochure PDF
Following slide covers project feasibility financial ratio along with graphical representation. Ratios included are net profit sales, quick ratio, debt equity ratio and gross profit sales.Make sure to capture your audiences attention in your business displays with our gratis customizable Submission Of Project Viability Report For Bank Loan Project Feasibility Financial Ratios Brochure PDF. These are great for business strategies, office conferences, capital raising or task suggestions. If you desire to acquire more customers for your tech business and ensure they stay satisfied, create your own sales presentation with these plain slides.

New Partner Portal For Service Providers Formats PDF
The slide illustrates a partner portal for providing better sales capabilities to the service providers. Various elements included in the portal are onboarding- progress and activities, sales and marketing- development funds and deal registration. Showcasing this set of slides titled New Partner Portal For Service Providers Formats PDF. The topics addressed in these templates are Onboarding Progress And Activities, Sales And Marketing, Development Funds, Deal Registration. All the content presented in this PPT design is completely editable. Download it and make adjustments in color, background, font etc. as per your unique business setting.
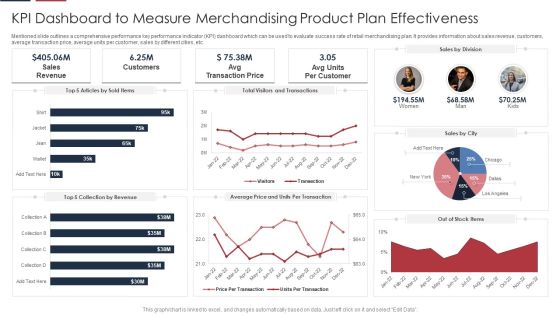
KPI Dashboard To Measure Merchandising Product Plan Effectiveness Guidelines PDF
Mentioned slide outlines a comprehensive performance key performance indicator KPI dashboard which can be used to evaluate success rate of retail merchandising plan. It provides information about sales revenue, customers, average transaction price, average units per customer, sales by different cities, etc. Showcasing this set of slides titled KPI Dashboard To Measure Merchandising Product Plan Effectiveness Guidelines PDF. The topics addressed in these templates are Sales, Customers, Price. All the content presented in this PPT design is completely editable. Download it and make adjustments in color, background, font etc. as per your unique business setting.
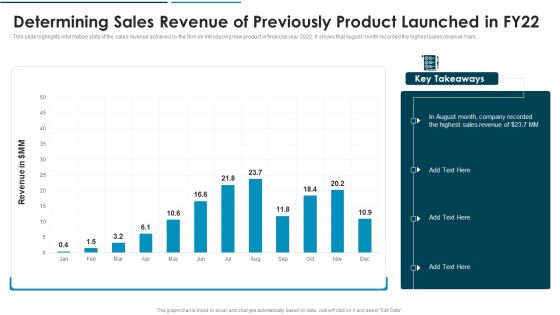
Go To Market Approach For New Product Product Launched In FY22 Inspiration PDF
This slide highlights information stats of the sales revenue achieved by the firm on introducing new product in financial year 2022. It shows that August month recorded the highest sales revenue mark.Deliver and pitch your topic in the best possible manner with this Go To Market Approach For New Product Product Launched In FY22 Inspiration PDF Use them to share invaluable insights on Determining Sales Revenue Of Previously Product Launched In Fy22 and impress your audience. This template can be altered and modified as per your expectations. So, grab it now.
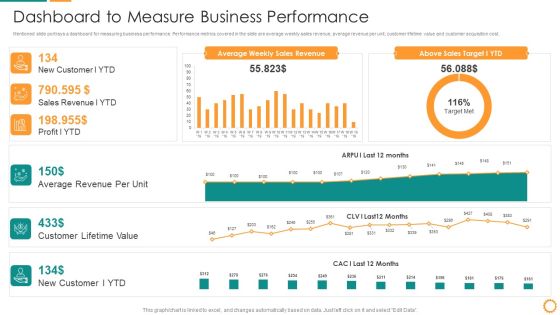
IT Consolidation Post Mergers And Acquisition Dashboard To Measure Business Performance Clipart PDF
Mentioned slide portrays a dashboard for measuring business performance. Performance metrics covered in the slide are average weekly sales revenue, average revenue per unit, customer lifetime value and customer acquisition cost. Deliver and pitch your topic in the best possible manner with this IT Consolidation Post Mergers And Acquisition Dashboard To Measure Business Performance Clipart PDF. Use them to share invaluable insights on Average Revenue, Customer Lifetime Value, Sales Revenue, Sales Target and impress your audience. This template can be altered and modified as per your expectations. So, grab it now.
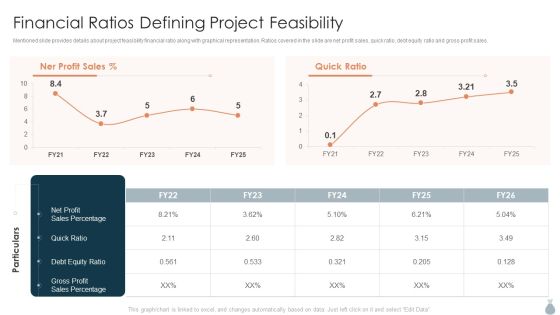
Real Estate Development Project Financing Financial Ratios Defining Project Feasibility Themes PDF
Mentioned slide provides details about project feasibility financial ratio along with graphical representation. Ratios covered in the slide are net profit sales, quick ratio, debt equity ratio and gross profit sales.Deliver and pitch your topic in the best possible manner with this Real Estate Development Project Financing Financial Ratios Defining Project Feasibility Themes PDF. Use them to share invaluable insights on Debt Equity, Sales Percentage, Gross Profit and impress your audience. This template can be altered and modified as per your expectations. So, grab it now.

KPI Dashboard To Track Effectiveness Of Real Estate Business Performance Guidelines PDF
The following slide exhibits key performance indicator KPI dashboard which can be used to measure the financial performance of the real estate company. It covers various kpis such as sales vs target per agent, top 10 projects, top 5 agencies etc.Deliver an awe inspiring pitch with this creative KPI Dashboard To Track Effectiveness Of Real Estate Business Performance Guidelines PDF bundle. Topics like Top Projects, Sales Amount, Sales Amount can be discussed with this completely editable template. It is available for immediate download depending on the needs and requirements of the user.
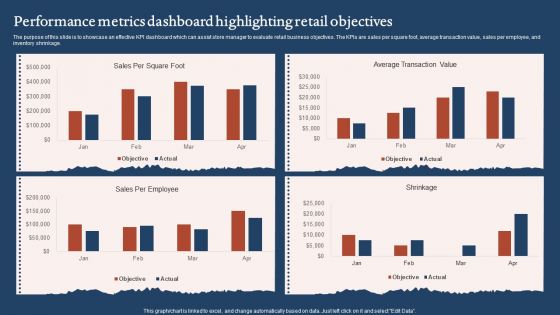
Performance Metrics Dashboard Highlighting Retail Objectives Sample PDF
The purpose of this slide is to showcase an effective KPI dashboard which can assist store manager to evaluate retail business objectives. The KPIs are sales per square foot, average transaction value, sales per employee, and inventory shrinkage. Pitch your topic with ease and precision using this Performance Metrics Dashboard Highlighting Retail Objectives Sample PDF. This layout presents information on Average Transaction Value, Sales Per Employee. It is also available for immediate download and adjustment. So, changes can be made in the color, design, graphics or any other component to create a unique layout.

Real Estate Developers Funding Alternatives Financial Ratios Defining Project Feasibility Download PDF
Mentioned slide provides details about project feasibility financial ratio along with graphical representation. Ratios covered in the slide are net profit sales, quick ratio, debt equity ratio and gross profit sales. Deliver an awe inspiring pitch with this creative Real Estate Real Estate Developers Funding Alternatives Financial Ratios Defining Project Feasibility Download PDF bundle. Topics like Quick Ratio, Debt Equity Ratio, Gross Profit Sales can be discussed with this completely editable template. It is available for immediate download depending on the needs and requirements of the user.

Retail Business Product Planning Procedure Impact Of Merchandising Plan On Retail Performance Diagrams PDF
This slide focuses on impact of merchandising plan on retail business performance which shows increase in return on investment, conversion rate and sales volume due to effective merchandise planning. Deliver and pitch your topic in the best possible manner with this Retail Business Product Planning Procedure Impact Of Merchandising Plan On Retail Performance Diagrams PDF. Use them to share invaluable insights on Retail Sales, Increase In Sales, Investments and impress your audience. This template can be altered and modified as per your expectations. So, grab it now.

Company Key Figures For Past 5 Years Market Entry Approach For Apparel Sector Clipart PDF
This slide covers the dashboard with major values for the last five years. It includes KPIs such as sales, net operating profit, sales by geographic areas, and number of employees. Deliver an awe inspiring pitch with this creative Company Key Figures For Past 5 Years Market Entry Approach For Apparel Sector Clipart PDF bundle. Topics like Sales Geographical, Number Employees, Operating Profit can be discussed with this completely editable template. It is available for immediate download depending on the needs and requirements of the user.
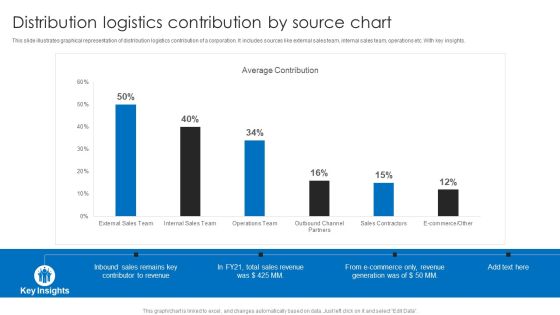
Distribution Logistics Contribution By Source Chart Ppt Model Guidelines PDF
This slide illustrates graphical representation of distribution logistics contribution of a corporation. It includes sources like external sales team, internal sales team, operations etc. With key insights. Showcasing this set of slides titled Distribution Logistics Contribution By Source Chart Ppt Model Guidelines PDF. The topics addressed in these templates are Average Contribution, Total Sales Revenue, E Commerce. All the content presented in this PPT design is completely editable. Download it and make adjustments in color, background, font etc. as per your unique business setting.

Auto Industry Trends Electric Vehicle Adoption Global Automotive Manufacturing Market Analysis Demonstration PDF
This slide covers a graphical representation of EV year over year sales growth. It also includes key insights into global vehicle sales, and electric vehicle expected sales by 2025 and 2040. If your project calls for a presentation, then Slidegeeks is your go-to partner because we have professionally designed, easy-to-edit templates that are perfect for any presentation. After downloading, you can easily edit Auto Industry Trends Electric Vehicle Adoption Global Automotive Manufacturing Market Analysis Demonstration PDF and make the changes accordingly. You can rearrange slides or fill them with different images. Check out all the handy templates

Region Wise Stock Performance Management Dashboard Introduction PDF
This slide shows regional inventory performance management dashboard that give insights areas to be worked upon for increasing sales. It includes yearly growth rate, monthly sales trends and city wise sales trends etc. Pitch your topic with ease and precision using this Region Wise Stock Performance Management Dashboard Introduction PDF. This layout presents information on Stock Performance, Management Dashboard. It is also available for immediate download and adjustment. So, changes can be made in the color, design, graphics or any other component to create a unique layout.

KPI Dashboard To Track Best Market Opportunities For New Established Business Pictures PDF
Following slide showcases KPI dashboard to determine best market for launching new business. It includes key components such as growth rate by different industries, best states to launch startup, sales forecast, market growth forecast, projected sales by different states. Showcasing this set of slides titled KPI Dashboard To Track Best Market Opportunities For New Established Business Pictures PDF. The topics addressed in these templates are Forecasted Sales, Growth Rate, Startup Industries. All the content presented in this PPT design is completely editable. Download it and make adjustments in color, background, font etc. as per your unique business setting.

Consumer Service Strategy Business Capability Model Sample PDF
The CRM capability model includes value added functions associated to customer relationship management such as lead management, sales management, sales forecasting, etc. Presenting Consumer Service Strategy Business Capability Model Sample PDF to provide visual cues and insights. Share and navigate important information on six stages that need your due attention. This template can be used to pitch topics like Sales Management, Lead Management, Crm Strategy And Planning. In addtion, this PPT design contains high resolution images, graphics, etc, that are easily editable and available for immediate download.

CRM Investor Fundraising Pitch Deck CRM Application Team Structure Clipart PDF
This slide provides the glimpse about the customer relationship management application team structure which focuses on members involved in a team and their designations. This is a crm investor fundraising pitch deck crm application team structure clipart pdf template with various stages. Focus and dispense information on four stages using this creative set, that comes with editable features. It contains large content boxes to add your information on topics like account manager, sales representative, sales manager, sales research specialist, vp of marketing. You can also showcase facts, figures, and other relevant content using this PPT layout. Grab it now.
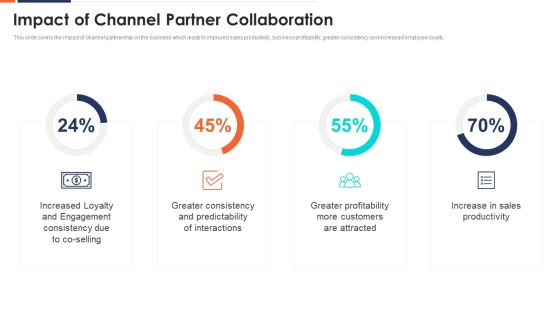
Form And Sustain A Business Partnership Impact Of Channel Partner Collaboration Ppt Styles Portfolio PDF
This slide covers the impact of channel partnership on the business which leads to improved sales productivity, business profitability, greater consistency and increased employee loyalty. Deliver and pitch your topic in the best possible manner with this form and sustain a business partnership impact of channel partner collaboration ppt styles portfolio pdf. Use them to share invaluable insights on customers, sales, productivity and impress your audience. This template can be altered and modified as per your expectations. So, grab it now.

Resources And Alliances Presentation Powerpoint Templates
This is a resources and alliances presentation powerpoint templates. This is a four stage process. The stages in this process are research concept, planning budget and control, resources and alliances, sales and registrations.

Our Team Ppt Powerpoint Presentation Pictures Smartart
This is a our team ppt powerpoint presentation pictures smartart. This is a three stage process. The stages in this process are sales manager, ceo, graphic designer, our team.

Our Team Ppt PowerPoint Presentation Inspiration Introduction
This is a our team ppt powerpoint presentation inspiration introduction. This is a four stage process. The stages in this process are general manager, design manager, accounts manager, sales manager.

Our Team Ppt PowerPoint Presentation Portfolio Graphics Download
This is a our team ppt powerpoint presentation portfolio graphics download. This is a two stage process. The stages in this process are sales manager, graphic designer, our team, business, management.

Meet Our Team Ppt PowerPoint Presentation Portfolio Display
This is a meet our team ppt powerpoint presentation portfolio display. This is a three stage process. The stages in this process are sales manager, ceo, graphic designer, meet our team.

Our Team Ppt PowerPoint Presentation Model Background Images
This is a our team ppt powerpoint presentation model background images. This is a four stage process. The stages in this process are graphic designer, web developer, sales manager.

Meet Our Team Ppt PowerPoint Presentation Ideas Show
This is a meet our team ppt powerpoint presentation ideas show. This is a four stage process. The stages in this process are developer, sales manager, web designer, ceo.

Our Team Ppt PowerPoint Presentation Infographic Template Design Inspiration
This is a our team ppt powerpoint presentation infographic template design inspiration. This is a six stage process. The stages in this process are manager, ceo, sales marketing, graphic designer, editor, web designer.

Our Team Ppt PowerPoint Presentation Background Image
This is a our team ppt powerpoint presentation background image. This is a four stage process. The stages in this process are editor, web designer, sales marketing, graphic designer.
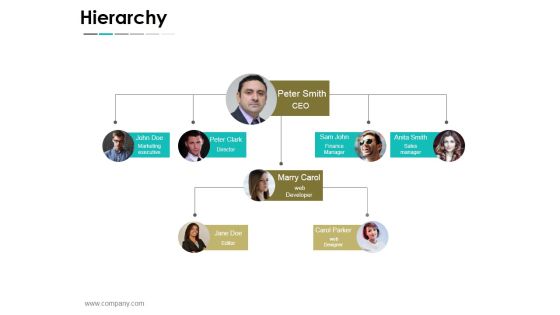
Hierarchy Ppt PowerPoint Presentation Summary Background
This is a hierarchy ppt powerpoint presentation summary background. This is a four stage process. The stages in this process are marketing executive, director, finance manager, sales manager, web developer, editor.

Bar Graph Ppt PowerPoint Presentation Outline Layout
This is a bar graph ppt powerpoint presentation outline layout. This is a four stage process. The stages in this process are sales in percentage, product, bar graph, business, marketing.

Bar Graph Ppt PowerPoint Presentation Introduction
This is a bar graph ppt powerpoint presentation introduction. This is a eleven stage process. The stages in this process are management, marketing, business, fy, graph, sales in percentage.

Bar Graph Ppt PowerPoint Presentation Portfolio Example
This is a bar graph ppt powerpoint presentation portfolio example. This is a three stage process. The stages in this process are sales in percentage, year, business, product, business, graph.

Bar Graph Ppt PowerPoint Presentation File Slides
This is a bar graph ppt powerpoint presentation file slides. This is a three stage process. The stages in this process are product, sales in percentage, bar graph, growth, success.

Bar Graph Ppt PowerPoint Presentation Layouts Influencers
This is a bar graph ppt powerpoint presentation layouts influencers. This is a two stage process. The stages in this process are business, marketing, in bar graph, sales in percentage, finance.

Bar Graph Ppt PowerPoint Presentation Model Clipart
This is a bar graph ppt powerpoint presentation model clipart. This is a six stage process. The stages in this process are sales in percentage, product, bar graph, business, marketing.
Change Methodology Strategies Ppt Example
This is a change methodology strategies ppt example. This is a four stage process. The stages in this process are locally relevant, results oriented, aligned with local sales plan, solves local issues, best of decentralized approach, collaboration.

Bar Graph Ppt PowerPoint Presentation Slides Deck
This is a bar graph ppt powerpoint presentation slides deck. This is a three stage process. The stages in this process are financial in years, product, sales in percentage.

Bar Graph Ppt PowerPoint Presentation Gallery Grid
This is a bar graph ppt powerpoint presentation gallery grid. This is a three stage process. The stages in this process are sales in percentage, product, finance, business, marketing.

Hierarchy Ppt PowerPoint Presentation Images
This is a hierarchy ppt powerpoint presentation images. This is a five stage process. The stages in this process are editor, ceo, graphic designer, sales and marketing, web designer.

Organization Chart Ppt PowerPoint Presentation Model Graphic Images
This is a organization chart ppt powerpoint presentation model graphic images. This is a six stage process. The stages in this process are editor, sales marketing, assistant manager, manager, web designer.
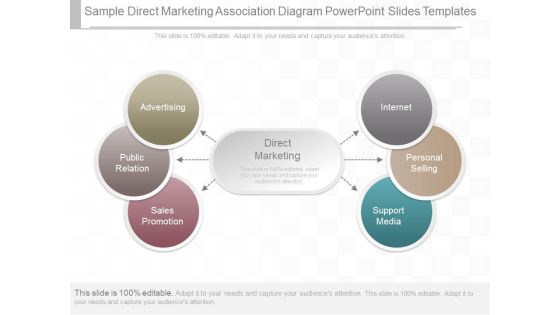
Sample Direct Marketing Association Diagram Powerpoint Slides Templates
This is a sample direct marketing association diagram powerpoint slides templates. This is a six stage process. The stages in this process are advertising, public relation, sales promotion, support media, personal selling, internet, direct marketing.

Bar Graph Ppt PowerPoint Presentation Visual Aids Model
This is a bar graph ppt powerpoint presentation visual aids model. This is a three stage process. The stages in this process are business, strategy, analysis, planning, sales in percentage.
Financial Projection Graph Template 1 Ppt PowerPoint Presentation Icon Summary
This is a financial projection graph template 1 ppt powerpoint presentation icon summary. This is a three stage process. The stages in this process are annual sales forecast, years, business, marketing, management.
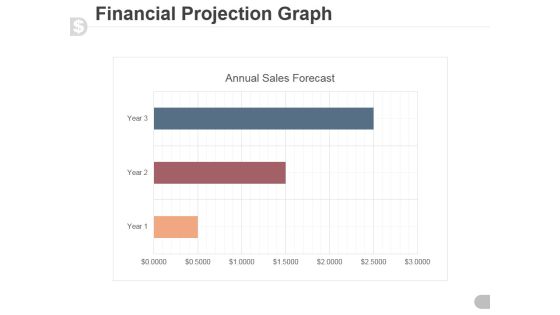
Financial Projection Graph Template 2 Ppt PowerPoint Presentation Samples
This is a financial projection graph template 2 ppt powerpoint presentation samples. This is a three stage process. The stages in this process are annual sales forecast, timeline, marketing, graph, management.

Bar Graph Ppt PowerPoint Presentation Portfolio Slide Portrait
This is a bar graph ppt powerpoint presentation portfolio slide portrait. This is a three stage process. The stages in this process are product, sales in percentage, bar graph, growth, success.

Bar Graph Ppt PowerPoint Presentation Infographic Template Template
This is a bar graph ppt powerpoint presentation infographic template template. This is a three stage process. The stages in this process are bar graph, sales in percentage, product, planning, business.

Bar Graph Ppt PowerPoint Presentation Slides Visual Aids
This is a bar graph ppt powerpoint presentation slides visual aids. This is a three stage process. The stages in this process are sales in percentage, bar graph, business, marketing, success.

Bar Graph Ppt PowerPoint Presentation Ideas Graphic Tips
This is a bar graph ppt powerpoint presentation ideas graphic tips. This is a three stage process. The stages in this process are financial year, sales in percentage, product, bar graph, growth.

3d Man With Blue Bar Graph And Red Growth Arrow
This Power Point diagram has been designed with graphic of 3d man and business graphs. This conceptual image can be used to displays business progress and growth. Use this editable slide for business and sales growth related presentations.

Business Development Strategy Ppt Powerpoint Slide
This is a business development strategy ppt powerpoint slide. This is a five stage process. The stages in this process are sales development, identify opportunities for referral, partnership schemes, identify piggybacking opportunities, associations, business development strategy.
