AI PPT Maker
Templates
PPT Bundles
Design Services
Business PPTs
Business Plan
Management
Strategy
Introduction PPT
Roadmap
Self Introduction
Timelines
Process
Marketing
Agenda
Technology
Medical
Startup Business Plan
Cyber Security
Dashboards
SWOT
Proposals
Education
Pitch Deck
Digital Marketing
KPIs
Project Management
Product Management
Artificial Intelligence
Target Market
Communication
Supply Chain
Google Slides
Research Services
 One Pagers
All Categories
-
Home
- Customer Favorites
- Sales Coordinator
Sales Coordinator

Strategy For Regional Economic Progress Outlining Yearly Sales Of Our Company Infographics PDF
This slide provides the glimpse about the yearly sales of our company based on three different products offered in the organization, sales has been increasing for 2 products but we need to do regional marketing for one of the product. Deliver and pitch your topic in the best possible manner with this strategy for regional economic progress outlining yearly sales of our company infographics pdf. Use them to share invaluable insights on yearly sales of our company and impress your audience. This template can be altered and modified as per your expectations. So, grab it now.

Build Effective Business Strategy For Financial Development Company Yearly Sales Forecast By Product Categories Rules PDF
This slide shows the company yearly sales forecast by product categories which includes veg pizza, non veg pizza, burger pizza, and any other products net sales for the year. Deliver and pitch your topic in the best possible manner with this build effective business strategy for financial development company yearly sales forecast by product categories rules pdf. Use them to share invaluable insights on company yearly sales forecast by product categories and impress your audience. This template can be altered and modified as per your expectations. So, grab it now.

Corporate Strategy For Business Development Company Yearly Sales Forecast By Product Structure PDF
This slide shows the company yearly sales forecast by product categories which includes veg pizza, non-veg pizza, burger pizza, and any other products net sales for the year. Deliver and pitch your topic in the best possible manner with this corporate strategy for business development company yearly sales forecast by product structure pdf. Use them to share invaluable insights on company yearly sales forecast by product categories and impress your audience. This template can be altered and modified as per your expectations. So, grab it now.
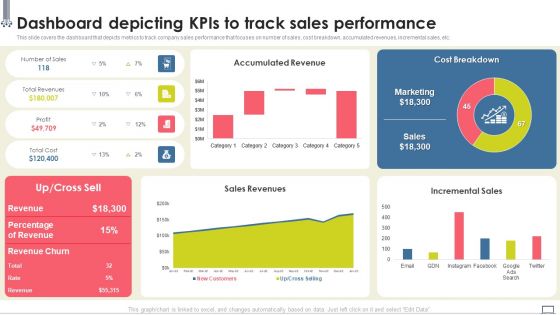
Change Management Strategy Dashboard Depicting Kpis To Track Sales Performance Ideas PDF
This slide covers the dashboard that depicts metrics to track company sales performance that focuses on number of sales, cost breakdown, accumulated revenues, incremental sales, etc. From laying roadmaps to briefing everything in detail, our templates are perfect for you. You can set the stage with your presentation slides. All you have to do is download these easy-to-edit and customizable templates. Change Management Strategy Dashboard Depicting Kpis To Track Sales Performance Ideas PDF will help you deliver an outstanding performance that everyone would remember and praise you for. Do download this presentation today.
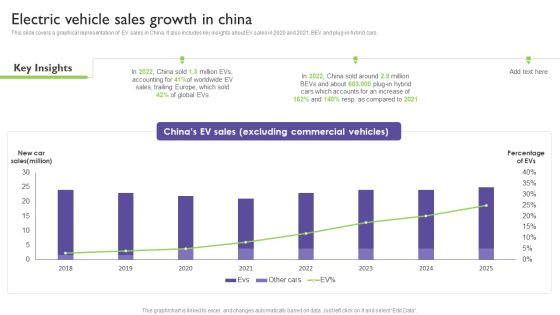
Global Automotive Industry Analysis Electric Vehicle Sales Growth In China Inspiration PDF
This slide covers a graphical representation of EV sales in China. It also includes key insights about EV sales in 2020 and 2021, BEV and plug-in hybrid cars. Make sure to capture your audiences attention in your business displays with our gratis customizable Global Automotive Industry Analysis Electric Vehicle Sales Growth In China Inspiration PDF. These are great for business strategies, office conferences, capital raising or task suggestions. If you desire to acquire more customers for your tech business and ensure they stay satisfied, create your own sales presentation with these plain slides.

Statistics Highlighting Annual Sales Of Competitor Retail Merchandising Techniques Demonstration PDF
The following slide outlines annual sales of the most successful competitor. The statistics mentioned in the slide are related to the five year sales of various products with key insights. Make sure to capture your audiences attention in your business displays with our gratis customizable Statistics Highlighting Annual Sales Of Competitor Retail Merchandising Techniques Demonstration PDF. These are great for business strategies, office conferences, capital raising or task suggestions. If you desire to acquire more customers for your tech business and ensure they stay satisfied, create your own sales presentation with these plain slides.

Comprehensive Guide To Build Marketing Statistics Showing Annual Sales Of Industry Portrait PDF
The following slide showcases graphical representation of market leader yearly sales. The slide covers detailed information about 4 years annual sales along with compound annual growth rate CAGR. Make sure to capture your audiences attention in your business displays with our gratis customizable Comprehensive Guide To Build Marketing Statistics Showing Annual Sales Of Industry Portrait PDF. These are great for business strategies, office conferences, capital raising or task suggestions. If you desire to acquire more customers for your tech business and ensure they stay satisfied, create your own sales presentation with these plain slides.

BANT Sales Lead Qualification Model Analyzing And Understanding The Performance Icons PDF
Purpose of the following slide is to show the key performance indicators of the current sales process, the provided displays KPIs such as customer acquired, CAC, volume per customer etc. Deliver and pitch your topic in the best possible manner with this BANT Sales Lead Qualification Model Analyzing And Understanding The Performance Icons PDF. Use them to share invaluable insights on New Customer, Weekly Sales, Revenues Sales and impress your audience. This template can be altered and modified as per your expectations. So, grab it now.

QC Engineering Year Over Year Sales Highlights Ppt Styles Design Inspiration PDF
Mentioned slide illustrates sales performance stats of the firm over last three years. Here the graph indicates that sales performance of the firm gets declined in FY23 as compared to stats of FY22 and FY21. Deliver an awe inspiring pitch with this creative qc engineering year over year sales highlights ppt styles design inspiration pdf bundle. Topics like year over year sales highlights can be discussed with this completely editable template. It is available for immediate download depending on the needs and requirements of the user.

Past Trends In Sales Of ABC Carbonated Drink Company Globally Ppt Styles Master Slide PDF
This slide shows the past trends in sales of ABC Carbonated Beverage Company worldwide. The graph shows a constant decline in sales since 2017. Deliver and pitch your topic in the best possible manner with this past trends in sales of abc carbonated drink company globally ppt styles master slide pdf. Use them to share invaluable insights on past trends in sales of abc carbonated drink company globally and impress your audience. This template can be altered and modified as per your expectations. So, grab it now.

Performance Analysis Of New Product Development Product Sales Vs Product Return Infographics PDF
Purpose of the following slide is to show the product sales vs. product return ratio of the organization, the provided graph displays the sales of the product in each month in comparison to the returns. Deliver an awe inspiring pitch with this creative performance analysis of new product development product sales vs product return infographics pdf bundle. Topics like comparison, sales, returns can be discussed with this completely editable template. It is available for immediate download depending on the needs and requirements of the user.
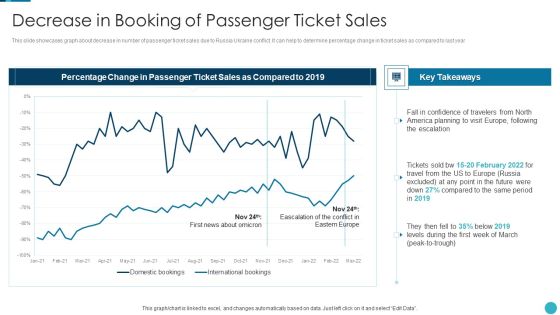
Russia Ukraine War Influence On Airline Sector Decrease In Booking Of Passenger Ticket Sales Topics PDF
This slide showcases graph about decrease in number of passenger ticket sales due to Russia Ukraine conflict. It can help to determine percentage change in ticket sales as compared to last year Deliver and pitch your topic in the best possible manner with this russia ukraine war influence on airline sector decrease in booking of passenger ticket sales topics pdf Use them to share invaluable insights on decrease in booking of passenger ticket sales and impress your audience. This template can be altered and modified as per your expectations. So, grab it now.
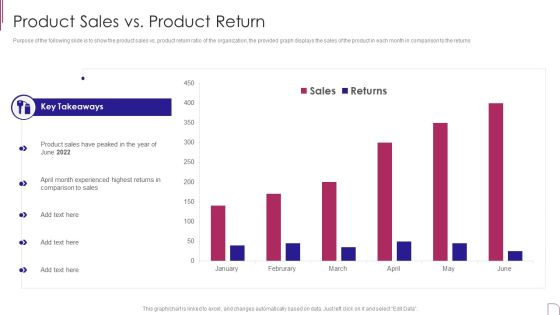
Yearly Product Performance Assessment Repor Product Sales Vs Product Return Information PDF
Purpose of the following slide is to show the product sales vs. product return ratio of the organization, the provided graph displays the sales of the product in each month in comparison to the returns.Deliver an awe inspiring pitch with this creative Yearly Product Performance Assessment Repor Product Sales Vs Product Return Information PDF bundle. Topics like Key Takeaways, Experienced Highest, Comparison Sales can be discussed with this completely editable template. It is available for immediate download depending on the needs and requirements of the user.

Real Estate Business Monthly Sales Forecast Dashboard Ppt Layouts Grid PDF
This slide represents the dashboard showing the data related to sales forecasting for the real estate business. It shows details related to the set target, sales targets won, open and forecasted and also shows the graph representing the sales pipeline for the year. Showcasing this set of slides titled Real Estate Business Monthly Sales Forecast Dashboard Ppt Layouts Grid PDF. The topics addressed in these templates are Next Billing Data, Pipeline, Current Fiscal Year. All the content presented in this PPT design is completely editable. Download it and make adjustments in color, background, font etc. as per your unique business setting.
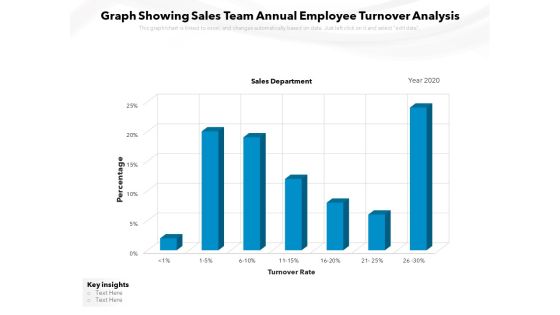
Graph Showing Sales Team Annual Employee Turnover Analysis Ppt PowerPoint Presentation Ideas PDF
Presenting this set of slides with name graph showing sales team annual employee turnover analysis ppt powerpoint presentation ideas pdf. The topics discussed in these slides are sales department, turnover rate, percentage, key insights, 2020. This is a completely editable PowerPoint presentation and is available for immediate download. Download now and impress your audience.

CRM Pipeline Administration Determine Average Sales Cycle In Pipeline Ppt Slides Skills PDF
This slide provides information regarding average sales cycle existing in sales pipeline. The department will consistently monitor sales cycle to ensure on time closure of deal. Present like a pro with CRM Pipeline Administration Determine Average Sales Cycle In Pipeline Ppt Slides Skills PDF Create beautiful presentations together with your team, using our easy-to-use presentation slides. Share your ideas in real-time and make changes on the fly by downloading our templates. So whether youre in the office, on the go, or in a remote location, you can stay in sync with your team and present your ideas with confidence. With Slidegeeks presentation got a whole lot easier. Grab these presentations today.

Problem Decline In Smartphone Sales Of The Company Ppt Styles Templates PDF
This slide shows the smartphone sales of the company in Global market and in developing countries which is continuously decline from the years 2016 to 2020 till Feb. also the reasons behind the decline in smartphone sales. Deliver an awe inspiring pitch with this creative problem decline in smartphone sales of the company ppt styles templates pdf bundle. Topics like problem decline in smartphone sales of the company can be discussed with this completely editable template. It is available for immediate download depending on the needs and requirements of the user.
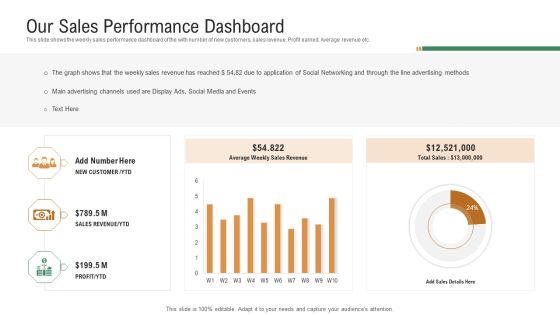
Investor Pitch Deck To Generate Venture Capital Funds Our Sales Performance Dashboard Ppt Show Format PDF
This slide shows the weekly sales performance dashboard of the with number of new customers, sales revenue, Profit earned, Average revenue etc. Deliver and pitch your topic in the best possible manner with this investor pitch deck to generate venture capital funds our sales performance dashboard ppt show format pdf. Use them to share invaluable insights on sales revenue, profit, main advertising channels, social networking, advertising methods and impress your audience. This template can be altered and modified as per your expectations. So, grab it now.

Past Trends In Sales Volume Of ABC Carbonated Drink Company Worldwide Structure PDF
This slide shows the past trends in sales volume of ABC Carbonated Beverage Company worldwide. The sales volume are on a constant decline due to decrease in demand and rising health concerns. Deliver and pitch your topic in the best possible manner with this past trends in sales volume of abc carbonated drink company worldwide structure pdf. Use them to share invaluable insights on past trends in sales volume of abc carbonated drink company worldwide and impress your audience. This template can be altered and modified as per your expectations. So, grab it now.
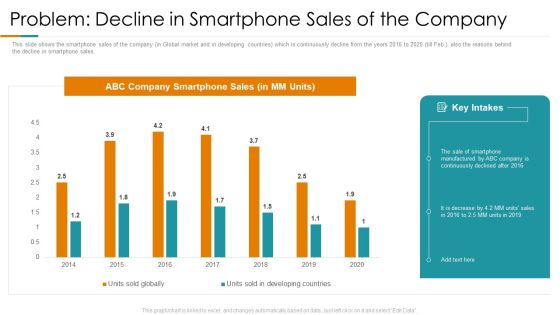
Problem Decline In Smartphone Sales Of The Company Ppt Visual Aids Slides PDF
This slide shows the smartphone sales of the company in Global market and in developing countries which is continuously decline from the years 2016 to 2020 till Feb. also the reasons behind the decline in smartphone sales. Deliver and pitch your topic in the best possible manner with this problem decline in smartphone sales of the company ppt visual aids slides pdf. Use them to share invaluable insights on problem decline in smartphone sales of the company and impress your audience. This template can be altered and modified as per your expectations. So, grab it now.

Regional Marketing Planning Yearly Sales Of Our Company Ppt Professional Clipart PDF
This slide provides the glimpse about the yearly sales of our company based on three different products offered in the organization, sales has been increasing for 2 products but we need to do regional marketing for one of the product. Deliver and pitch your topic in the best possible manner with this regional marketing planning yearly sales of our company ppt professional clipart pdf. Use them to share invaluable insights on yearly sales of our company and impress your audience. This template can be altered and modified as per your expectations. So, grab it now.
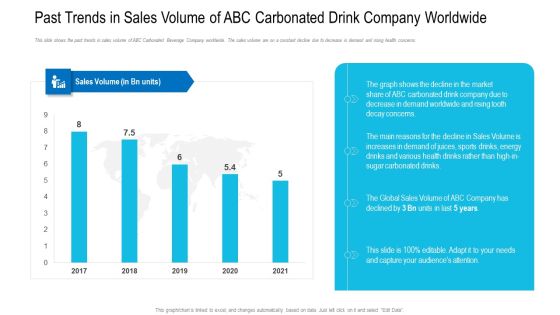
Past Trends In Sales Volume Of ABC Carbonated Drink Company Worldwide Template PDF
This slide shows the past trends in sales volume of ABC Carbonated Beverage Company worldwide. The sales volume are on a constant decline due to decrease in demand and rising health concerns. Deliver an awe inspiring pitch with this creative past trends in sales volume of abc carbonated drink company worldwide template pdf bundle. Topics like sales volume, increases in demand can be discussed with this completely editable template. It is available for immediate download depending on the needs and requirements of the user.

Examination Of Buyer Mindset Towards Dairy Products Total Sales Of Dairy Products Worldwide Diagrams PDF
This slide shows total worldwide sales of dairy products, from the years 2018 to 2022. It shows the increase in sales of all dairy products Milk, Cheese, Yogurt, Flavored milk drinks, Other dairy products. Deliver and pitch your topic in the best possible manner with this examination of buyer mindset towards dairy products total sales of dairy products worldwide diagrams pdf. Use them to share invaluable insights on total sales of dairy products worldwide and impress your audience. This template can be altered and modified as per your expectations. So, grab it now.

Organization Development Initiatives For Startups Company Yearly Sales Forecast By Product Categories Download PDF
This slide shows the company yearly sales forecast by product categories which includes veg pizza, non-veg pizza, burger pizza, and any other products net sales for the year. Deliver and pitch your topic in the best possible manner with this organization development initiatives for startups company yearly sales forecast by product categories download pdf. Use them to share invaluable insights on company yearly sales forecast by product categories and impress your audience. This template can be altered and modified as per your expectations. So, grab it now.
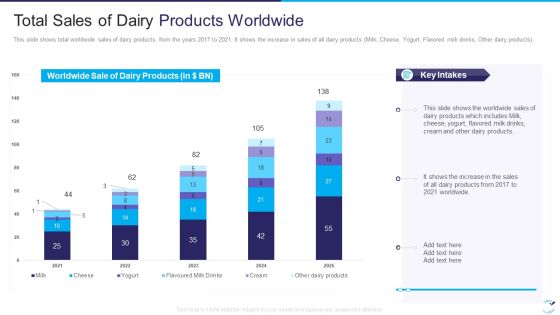
Factor Influencing User Experience Dairy Industry Total Sales Of Dairy Products Worldwide Pictures PDF
This slide shows total worldwide sales of dairy products, from the years 2017 to 2021. It shows the increase in sales of all dairy products Milk, Cheese, Yogurt, Flavored milk drinks, Other dairy products. Deliver an awe inspiring pitch with this creative factor influencing user experience dairy industry total sales of dairy products worldwide pictures pdf bundle. Topics like total sales of dairy products worldwide can be discussed with this completely editable template. It is available for immediate download depending on the needs and requirements of the user.
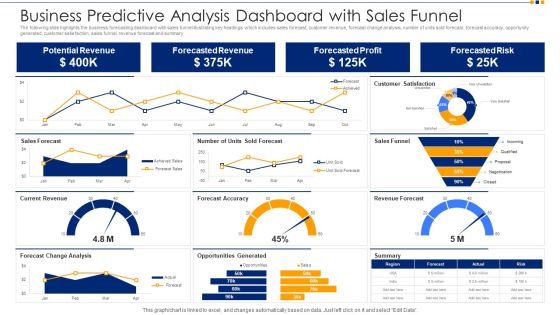
Business Predictive Analysis Dashboard With Sales Funnel Ppt Show Images PDF
The following slide highlights the business forecasting dashboard with sales funnel illustrating key headings which includes sales forecast, customer revenue, forecast change analysis, number of units sold forecast, forecast accuracy, opportunity generated, customer satisfaction, sales funnel, revenue forecast and summary. Pitch your topic with ease and precision using this business predictive analysis dashboard with sales funnel ppt show images pdf. This layout presents information on potential revenue, forecasted revenue, forecasted profit, forecasted risk. It is also available for immediate download and adjustment. So, changes can be made in the color, design, graphics or any other component to create a unique layout.

B2B Marketing Content Administration Playbook Several Steps Involved In B2B Sales Process Template PDF
This slide provides information regarding streamlining B2B sales models for improved productivity by assessing different sales models based in cost per transaction and degree of sales interaction and aligning organizational strengths with prospects requirements. Deliver and pitch your topic in the best possible manner with this b2b marketing content administration playbook several steps involved in b2b sales process template pdf Use them to share invaluable insights on lead identification, business justification, negotiation and impress your audience. This template can be altered and modified as per your expectations. So, grab it now.

Business Performance Review Report To Evaluate Performance Of Sales Rep Infographics PDF
The following slide highlights quarterly business review QBR report which can be used by firm to evaluate the efficiency of sales rep. information covered in this slide is related to total sales by employees in different quarters, number of calls made. Pitch your topic with ease and precision using this Business Performance Review Report To Evaluate Performance Of Sales Rep Infographics PDF. This layout presents information on Revenue Sales, Tim Paine, Number Colds Calls. It is also available for immediate download and adjustment. So, changes can be made in the color, design, graphics or any other component to create a unique layout.

Global Automobile Sector Overview Global Electric Vehicle Sales With Market Share In 2021 Designs PDF
This slide covers the graphical representation of the global EV market share along with BEV and PHEV sales. It also includes key insights about the global plugin electric car sales, chinas share in global EV sales, etc. Deliver and pitch your topic in the best possible manner with this Global Automobile Sector Overview Global Electric Vehicle Sales With Market Share In 2021 Designs PDF. Use them to share invaluable insights on Electric Vehicles, Battery Electric, Electric Vehicle and impress your audience. This template can be altered and modified as per your expectations. So, grab it now.
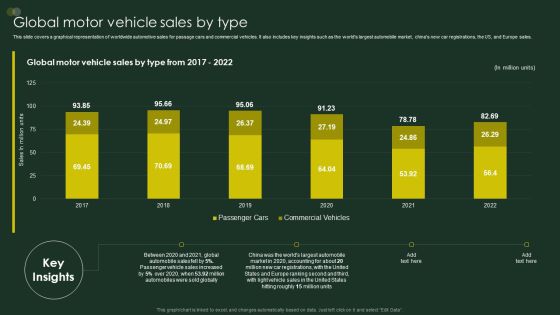
Global Automobile Sector Overview Global Motor Vehicle Sales By Type Mockup PDF
This slide covers a graphical representation of worldwide automotive sales for passage cars and commercial vehicles. It also includes key insights such as the worlds largest automobile market, chinas new car registrations, the US, and Europe sales. Deliver an awe inspiring pitch with this creative Global Automobile Sector Overview Global Motor Vehicle Sales By Type Mockup PDF bundle. Topics like Automobile Sales, Automobiles Were, Hitting Roughly can be discussed with this completely editable template. It is available for immediate download depending on the needs and requirements of the user.
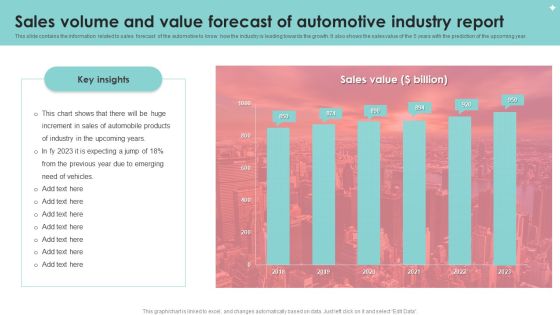
Sales Volume And Value Forecast Of Automotive Industry Report Diagrams PDF
This slide contains the information related to sales forecast of the automotive to know how the industry is leading towards the growth. It also shows the sales value of the 5 years with the prediction of the upcoming year. Showcasing this set of slides titled Sales Volume And Value Forecast Of Automotive Industry Report Diagrams PDF. The topics addressed in these templates are Sales Volume, Value Forecast, Automotive Industry Report. All the content presented in this PPT design is completely editable. Download it and make adjustments in color, background, font etc. as per your unique business setting.
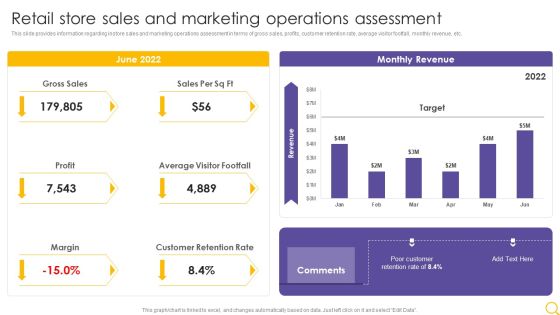
Retail Outlet Operational Efficiency Analytics Retail Store Sales And Marketing Operations Assessment Designs PDF
This slide provides information regarding instore sales and marketing operations assessment in terms of gross sales, profits, customer retention rate, average visitor footfall, monthly revenue, etc. Deliver and pitch your topic in the best possible manner with this Retail Outlet Operational Efficiency Analytics Retail Store Sales And Marketing Operations Assessment Designs PDF. Use them to share invaluable insights on Gross Sales, Profit, Average Visitor Footfall and impress your audience. This template can be altered and modified as per your expectations. So, grab it now.

Retail Outlet Operational Efficiency Analytics Sales Dashboards For Retail Store Inspiration PDF
This slide illustrates the dashboard retail store sales forecasting providing information regarding sales per employee, price unit every transaction, total number of customers and average value of customer transaction. Deliver and pitch your topic in the best possible manner with this Retail Outlet Operational Efficiency Analytics Sales Dashboards For Retail Store Inspiration PDF. Use them to share invaluable insights on Gross Sales, Total No Customers, Value Customer and impress your audience. This template can be altered and modified as per your expectations. So, grab it now.
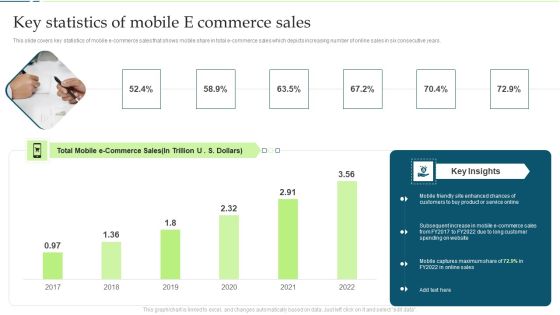
Customer Engagement And Experience Key Statistics Of Mobile E Commerce Sales Structure PDF Brochure PDF
This slide covers key statistics of mobile e commerce sales that shows mobile share in total e commerce sales which depicts increasing number of online sales in six consecutive years.Deliver and pitch your topic in the best possible manner with this Customer Engagement And Experience Key Statistics Of Mobile E Commerce Sales Structure PDF Brochure PDF. Use them to share invaluable insights on Subsequent Increase, Long Customer, Captures Maximum and impress your audience. This template can be altered and modified as per your expectations. So, grab it now.

KPI Dashboard To Track Beauty Care Products Sales Performance Ppt Outline Pictures PDF
This slide shows the key performance indicators dashboard which can be used to analyze current financial position of cosmetic business. It includes metrics such as sales, expenses, profit, cash in hand, etc. Showcasing this set of slides titled KPI Dashboard To Track Beauty Care Products Sales Performance Ppt Outline Pictures PDF. The topics addressed in these templates are Sales Number, Total Sales, Total Profit, Cost. All the content presented in this PPT design is completely editable. Download it and make adjustments in color, background, font etc. as per your unique business setting.
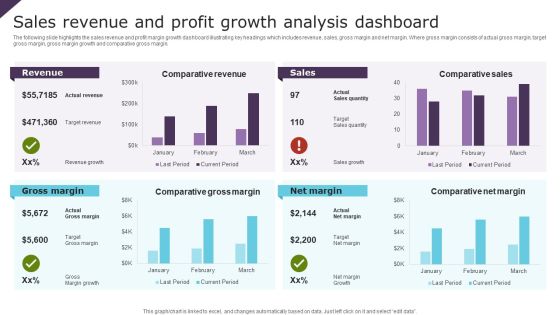
Sales Revenue And Profit Growth Analysis Dashboard Ppt Portfolio Slide PDF
The following slide highlights the sales revenue and profit margin growth dashboard illustrating key headings which includes revenue, sales, gross margin and net margin. Where gross margin consists of actual gross margin, target gross margin, gross margin growth and comparative gross margin. Showcasing this set of slides titled Sales Revenue And Profit Growth Analysis Dashboard Ppt Portfolio Slide PDF. The topics addressed in these templates are Revenue, Sales, Gross Margin, Net Margin. All the content presented in this PPT design is completely editable. Download it and make adjustments in color, background, font etc. as per your unique business setting.
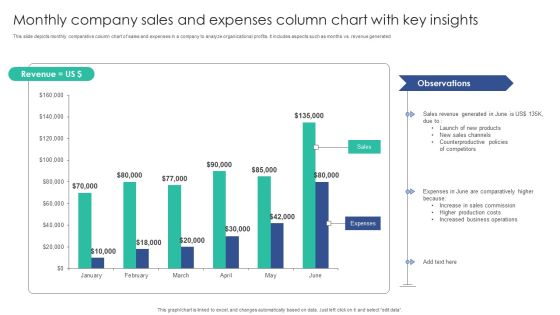
Monthly Company Sales And Expenses Column Chart With Key Insights Mockup PDF
This slide depicts monthly comparative column chart of sales and expenses in a company to analyze organizational profits. It includes aspects such as months vs. revenue generatedPitch your topic with ease and precision using this Monthly Company Sales And Expenses Column Chart With Key Insights Mockup PDF. This layout presents information on Sales Channels, Counterproductive Policies, Sales Commission. It is also available for immediate download and adjustment. So, changes can be made in the color, design, graphics or any other component to create a unique layout.
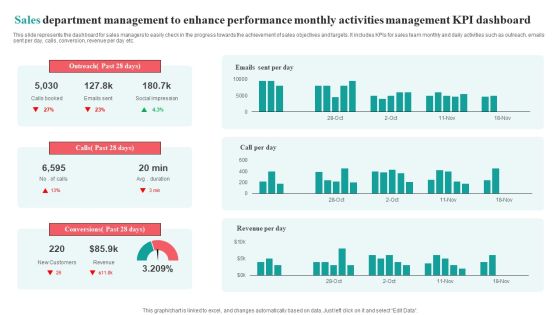
Sales Department Management To Enhance Performance Monthly Activities Management KPI Dashboard Brochure PDF
This slide represents the dashboard for sales managers to easily check in the progress towards the achievement of sales objectives and targets. It includes KPIs for sales team monthly and daily activities such as outreach, emails sent per day, calls, conversion, revenue per day etc.Pitch your topic with ease and precision using this Sales Department Management To Enhance Performance Monthly Activities Management KPI Dashboard Brochure PDF. This layout presents information on Social Impression, Conversions Past, Outreach Past. It is also available for immediate download and adjustment. So, changes can be made in the color, design, graphics or any other component to create a unique layout.

Retail Apparel Online Yearly Sales Of Online Apparel Firm Formats PDF
This slide showcases increase in sales of the company from year 2019 to 2022. It also depicts region wise sales for year 2022. Get a simple yet stunning designed Retail Apparel Online Yearly Sales Of Online Apparel Firm Formats PDF. It is the best one to establish the tone in your meetings. It is an excellent way to make your presentations highly effective. So, download this PPT today from Slidegeeks and see the positive impacts. Our easy-to-edit Retail Apparel Online Yearly Sales Of Online Apparel Firm Formats PDF can be your go-to option for all upcoming conferences and meetings. So, what are you waiting for Grab this template today.

KPI Dashboard To Track Corporate Sales From Various Channels Information PDF
This slide shows KPI dashboard which can be used by organizations to monitor sales performance of various channels. It includes various metrics such as total revenue, total profit, monthly sales revenue, cost breakup, etc. Showcasing this set of slides titled KPI Dashboard To Track Corporate Sales From Various Channels Information PDF. The topics addressed in these templates are Track Corporate Sales, Various Channels. All the content presented in this PPT design is completely editable. Download it and make adjustments in color, background, font etc. as per your unique business setting.

Transition Plan For Business Management Dashboard Depicting Kpis To Track Sales Performance Template PDF
This slide covers the dashboard that depicts metrics to track company sales performance that focuses on number of sales, cost breakdown, accumulated revenues, incremental sales, etc. From laying roadmaps to briefing everything in detail, our templates are perfect for you. You can set the stage with your presentation slides. All you have to do is download these easy-to-edit and customizable templates. Transition Plan For Business Management Dashboard Depicting Kpis To Track Sales Performance Template PDF will help you deliver an outstanding performance that everyone would remember and praise you for. Do download this presentation today.

Branches For Visualization Research And Development Sales Performance Dashboard After Infographics PDF
This slide depicts the dashboard for sales performance after the implementation of visualization research based on revenue, quantity, regional sales. Crafting an eye-catching presentation has never been more straightforward. Let your presentation shine with this tasteful yet straightforward Branches For Visualization Research And Development Sales Performance Dashboard After Infographics PDF template. It offers a minimalistic and classy look that is great for making a statement. The colors have been employed intelligently to add a bit of playfulness while still remaining professional. Construct the ideal Branches For Visualization Research And Development Sales Performance Dashboard After Infographics PDF that effortlessly grabs the attention of your audience Begin now and be certain to wow your customers.

Change Management Process Dashboard Depicting Kpis To Track Sales Performance Introduction PDF
This slide covers the dashboard that depicts metrics to track company sales performance that focuses on number of sales, cost breakdown, accumulated revenues, incremental sales, etc. From laying roadmaps to briefing everything in detail, our templates are perfect for you. You can set the stage with your presentation slides. All you have to do is download these easy-to-edit and customizable templates. Change Management Process Dashboard Depicting Kpis To Track Sales Performance Introduction PDF will help you deliver an outstanding performance that everyone would remember and praise you for. Do download this presentation today.
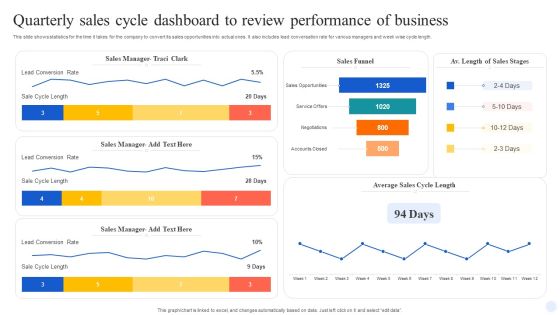
Quarterly Sales Cycle Dashboard To Review Performance Of Business Demonstration PDF
This slide shows statistics for the time it takes for the company to convert its sales opportunities into actual ones. It also includes lead conversation rate for various managers and week wise cycle length. Showcasing this set of slides titled Quarterly Sales Cycle Dashboard To Review Performance Of Business Demonstration PDF. The topics addressed in these templates are Sales Manager, Sales Funnel, Lead Conversion Rate. All the content presented in this PPT design is completely editable. Download it and make adjustments in color, background, font etc. as per your unique business setting.

How Leaders Can Improve Team Effectiveness Sales Team Performance Management KPI Dashboard Infographics PDF
This slide showcases KPI dashboard which can help sales team managers display and review performance rankings. It provides details about weekly sales score, target percentage, total target, sales team members, etc. Unleash your creativity with our How Leaders Can Improve Team Effectiveness Sales Team Performance Management KPI Dashboard Infographics PDF single-slide PPT template. Whether you are a seasoned presenter or a newbie, our editable and visually-stunning template will make your presentations shine. This template is versatile and easy to use. Make your presentations unforgettable with our premium template and leave a lasting impression on your audience.

Strategic Ecommerce Plan For B2B Enterprises B2b Sales Performance Tracking Dashboard Demonstration PDF
This slide represents metric dashboard to track sales performance on e-commerce website. It cover performance indicators such as sales breakdown, order breakdown, recurring sales etc. Slidegeeks has constructed Strategic Ecommerce Plan For B2B Enterprises B2b Sales Performance Tracking Dashboard Demonstration PDF after conducting extensive research and examination. These presentation templates are constantly being generated and modified based on user preferences and critiques from editors. Here, you will find the most attractive templates for a range of purposes while taking into account ratings and remarks from users regarding the content. This is an excellent jumping-off point to explore our content and will give new users an insight into our top-notch PowerPoint Templates.

Business To Business Digital Channel Management B2B Sales Performance Tracking Dashboard Template PDF
This slide represents metric dashboard to track sales performance on e-commerce website. It cover performance indicators such as sales breakdown, order breakdown, recurring sales etc. Take your projects to the next level with our ultimate collection of Business To Business Digital Channel Management B2B Sales Performance Tracking Dashboard Template PDF. Slidegeeks has designed a range of layouts that are perfect for representing task or activity duration, keeping track of all your deadlines at a glance. Tailor these designs to your exact needs and give them a truly corporate look with your own brand colors they will make your projects stand out from the rest.
E Commerce Operations In B2b B2b Sales Performance Tracking Dashboard Icons PDF
This slide represents metric dashboard to track sales performance on e-commerce website. It cover performance indicators such as sales breakdown, order breakdown, recurring sales etc. Slidegeeks is one of the best resources for PowerPoint templates. You can download easily and regulate E Commerce Operations In B2b B2b Sales Performance Tracking Dashboard Icons PDF for your personal presentations from our wonderful collection. A few clicks is all it takes to discover and get the most relevant and appropriate templates. Use our Templates to add a unique zing and appeal to your presentation and meetings. All the slides are easy to edit and you can use them even for advertisement purposes.

360 Degree Sales Analysis Dashboard After Marketing Plan Implementation Pictures PDF
This template shows the sales analysis dashboard after implementing an effective marketing plan. This slide aims to measure the potential and actual results of the sales target. It includes KPIs such as the number of page views on the website, total sales, subscribers, etc.Pitch your topic with ease and precision using this 360 Degree Sales Analysis Dashboard After Marketing Plan Implementation Pictures PDF. This layout presents information on Lead Generation Life, Conversion Rate. It is also available for immediate download and adjustment. So, changes can be made in the color, design, graphics or any other component to create a unique layout.

Horizontal Organizational Structure Chart For Sales And Operational Departments Ppt PowerPoint Presentation File Pictures PDF
Persuade your audience using this horizontal organizational structure chart for sales and operational departments ppt powerpoint presentation file pictures pdf. This PPT design covers three stages, thus making it a great tool to use. It also caters to a variety of topics including sales director, operational director, marketing and sales. Download this PPT design now to present a convincing pitch that not only emphasizes the topic but also showcases your presentation skills.

Organizational Worldwide Sales Department Structure Ppt PowerPoint Presentation File Brochure PDF
Persuade your audience using this organizational worldwide sales department structure ppt powerpoint presentation file brochure pdf. This PPT design covers two stages, thus making it a great tool to use. It also caters to a variety of topics including sales executive, sales manager. Download this PPT design now to present a convincing pitch that not only emphasizes the topic but also showcases your presentation skills.
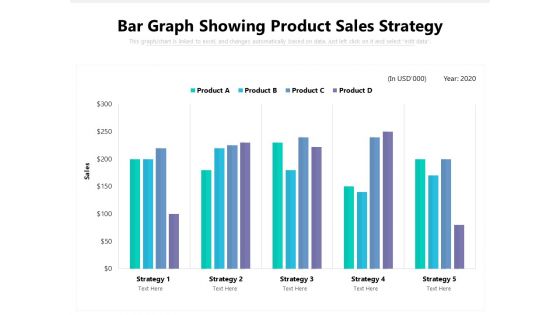
Bar Graph Showing Product Sales Strategy Ppt PowerPoint Presentation File Samples PDF
Showcasing this set of slides titled bar graph showing product sales strategy ppt powerpoint presentation file samples pdf. The topics addressed in these templates are bar graph showing product sales strategy. All the content presented in this PPT design is completely editable. Download it and make adjustments in color, background, font etc. as per your unique business setting.
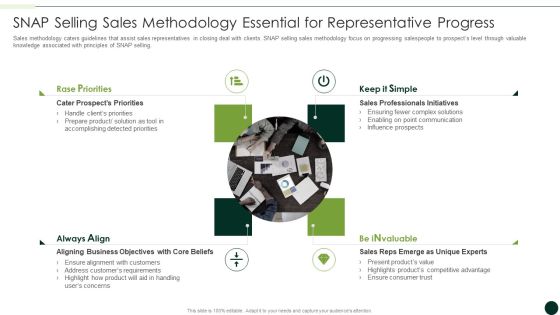
Salesman Principles Playbook SNAP Selling Sales Methodology Essential For Representative Progress Summary PDF
Sales methodology caters guidelines that assist sales representatives in closing deal with clients. SNAP selling sales methodology focus on progressing salespeople to prospects level through valuable knowledge associated with principles of SNAP selling. Presenting salesman principles playbook snap selling sales methodology essential for representative progress summary pdf to provide visual cues and insights. Share and navigate important information on four stages that need your due attention. This template can be used to pitch topics like rase priorities, keep it simple, aligning business objectives In addtion, this PPT design contains high resolution images, graphics, etc, that are easily editable and available for immediate download.
Sales Performance Graph Of The Organization Ppt PowerPoint Presentation Gallery Slide Portrait PDF
Presenting this set of slides with name sales performance graph of the organization ppt powerpoint presentation gallery slide portrait pdf. This is a three stage process. The stages in this process are sales performance graph of the organization. This is a completely editable PowerPoint presentation and is available for immediate download. Download now and impress your audience.
Sales Performance Report With Charts And Graphs Ppt PowerPoint Presentation Icon Master Slide PDF
Presenting sales performance report with charts and graphs ppt powerpoint presentation icon master slide pdf to dispense important information. This template comprises three stages. It also presents valuable insights into the topics including sales performance report with charts and graphs. This is a completely customizable PowerPoint theme that can be put to use immediately. So, download it and address the topic impactfully.
Vertical Integration Sales Strategy Incremental Graph Icon Ppt PowerPoint Presentation Gallery Example PDF
Presenting this set of slides with name vertical integration sales strategy incremental graph icon ppt powerpoint presentation gallery example pdf. This is a three stage process. The stages in this process are vertical integration sales strategy incremental graph icon. This is a completely editable PowerPoint presentation and is available for immediate download. Download now and impress your audience.

Graph Showing Sales Analysis By Region Ppt PowerPoint Presentation Inspiration Images
Presenting this set of slides with name graph showing sales analysis by region ppt powerpoint presentation inspiration images. The topics discussed in these slide is graph showing sales analysis by region. This is a completely editable PowerPoint presentation and is available for immediate download. Download now and impress your audience.

Bar Graph Showing Sales Performance Dashboard Ppt PowerPoint Presentation File Design Ideas PDF
Presenting this set of slides with name bar graph showing sales performance dashboard ppt powerpoint presentation file design ideas pdf. The topics discussed in these slide is bar graph showing sales performance dashboard. This is a completely editable PowerPoint presentation and is available for immediate download. Download now and impress your audience.
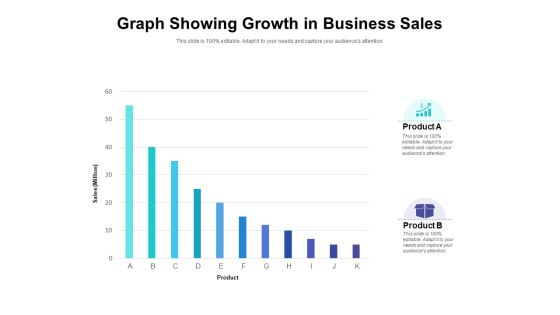
Graph Showing Growth In Business Sales Ppt PowerPoint Presentation Portfolio Designs PDF
Presenting this set of slides with name graph showing growth in business sales ppt powerpoint presentation portfolio designs pdf. The topics discussed in these slide is graph showing growth in business sales. This is a completely editable PowerPoint presentation and is available for immediate download. Download now and impress your audience.

Graph Showing Product Sales By Quarter Ppt PowerPoint Presentation Ideas Templates PDF
Presenting this set of slides with name graph showing product sales by quarter ppt powerpoint presentation ideas templates pdf. The topics discussed in these slide is graph showing product sales by quarter. This is a completely editable PowerPoint presentation and is available for immediate download. Download now and impress your audience.
