Sales Budget

Stock Photo Graphics For Business Reports And Charts PowerPoint Slide
This image contains graphics of business reports and charts. Download this image for business and sales presentations where you have to focus on financial growth. Dazzle the audience with your thoughts.
Stock Photo Design For Graphical Representations Of Data PowerPoint Slide
The above image contains a graphic of charts and graphs. Use this professional image in business or sales related presentations. It helps you to explain your plans in all earnest to your colleagues and raise the bar for all.
Stock Photo Design Of Financial Charts And Reports PowerPoint Slide
This image slide has been professionally designed to give complete look to your business presentations. This image is designed with graphics of business reports and charts. Use this image in marketing and sales related presentations.

Stock Photo Twisted Arrows Around Bars PowerPoint Slide
This conceptual image displays graphics of bar graph. This image of bar graph can be used to show growth in sales or profit. Pass your ideas through this image slide in relation to profit growth.
Stock Photo Right Tick Symbol On Red Target Pwerpoint Slide
This graphic image has been designed with right tick sign on red target board. This image contains the concept of target selection and checklist development. Use this image for business and sales target re-presentations.

Stock Photo Tick Sign On Blue Target Board Pwerpoint Slide
This graphic image has been designed with tick sign on blue target board. This image contains the concept of target selection and checklist development. Use this image for business and sales presentations.

Business Diagram Six Options In Pyramid Presentation Template
Sales process can be explained with this pyramid diagram. This diagram contains the graphic of pyramid chart with six options. This diagram provides an effective way of displaying information.

Four Pyramids With Growth Steps Powerpoint Slides
This business slide has been designed with four pyramids. This PowerPoint template may use to display sales growth and analysis. Prove the viability of your ideas using this impressive slide.

Bar Chart Ppt PowerPoint Presentation Icon Demonstration
This is a bar chart ppt powerpoint presentation icon demonstration. This is a seven stage process. The stages in this process are product, sales in percentage, financial year, graph.

Area Chart Ppt PowerPoint Presentation Infographics File Formats
This is a area chart ppt powerpoint presentation infographics file formats. This is a two stage process. The stages in this process are area chart, product, sales in percentage, growth, success.

Some Quick Facts Ppt PowerPoint Presentation Summary Example
This is a some quick facts ppt powerpoint presentation summary example. This is a three stage process. The stages in this process are customers, sales growth, staff works weekly.

Competitor Analysis Ppt PowerPoint Presentation File Graphics Example
This is a competitor analysis ppt powerpoint presentation file graphics example. This is a four stage process. The stages in this process are revenue, sales development of industry, own company, placeholder, competitor.

Line Chart Ppt PowerPoint Presentation Gallery Rules
This is a line chart ppt powerpoint presentation gallery rules. This is a two stage process. The stages in this process are financial years, product, sales in percentage, line chart, growth.

Bar Chart Ppt PowerPoint Presentation Model Picture
This is a bar chart ppt powerpoint presentation model picture. This is a two stage process. The stages in this process are product, sales in percentage, financial years, bar chart.

Bar Chart Ppt PowerPoint Presentation Slides Example File
This is a bar chart ppt powerpoint presentation slides example file. This is a two stage process. The stages in this process are product, financial years, sales in percentage.
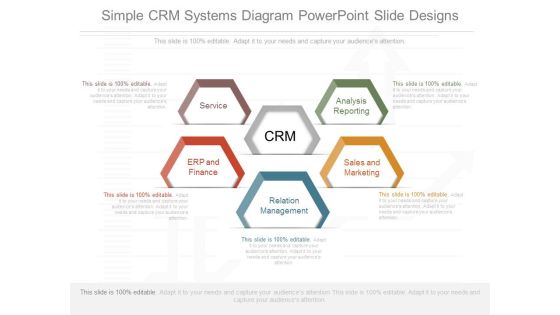
Simple Crm Systems Diagram Powerpoint Slide Designs
This is a simple crm systems diagram powerpoint slide designs. This is a five stage process. The stages in this process are service, erp and finance, analysis reporting, sales and marketing, relation management.
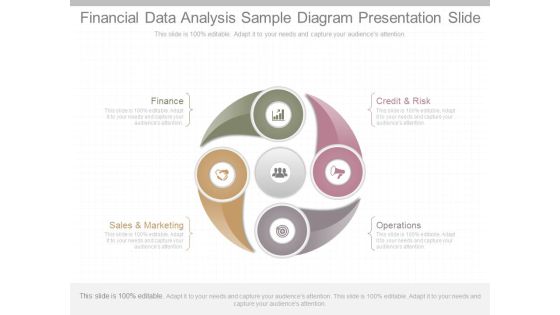
Financial Data Analysis Sample Diagram Presentation Slide
This is a financial data analysis sample diagram presentation slide. This is a four stage process. The stages in this process are finance, sales and marketing, operations, credit and risk.

Customer Relations Management Tools Ppt Slide Show
This is a customer relations management tools ppt slide show. This is a five stage process. The stages in this process are crm, sales and marketing, erp and finance, service, relation management, analysis reporting.

Financial Analysis Report Sample Template Powerpoint Slides
This is a financial analysis report sample template powerpoint slides. This is a six stage process. The stages in this process are sales and marketing, journal entries, finance, credit and risk, adjusted trial balance, closing entries.

Meet Our Team Ppt PowerPoint Presentation Backgrounds
This is a meet our team ppt powerpoint presentation backgrounds. This is a four stage process. The stages in this process are ceo and founder, finance manager, product manager, sales marketing.

Our Team Ppt PowerPoint Presentation Show Sample
This is a our team ppt powerpoint presentation show sample. This is a seven stage process. The stages in this process are finance manager, web designer, financial advisor, sales marketing, product manager, graphic designer, editor, ceo.
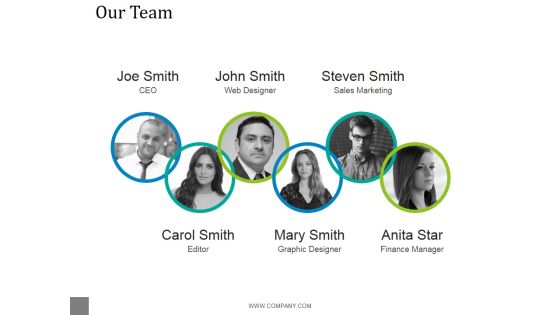
Our Team Ppt PowerPoint Presentation File Graphics Design
This is a our team ppt powerpoint presentation file graphics design. This is a six stage process. The stages in this process are ceo, web designer, sales marketing, editor, graphic designer, finance manager.
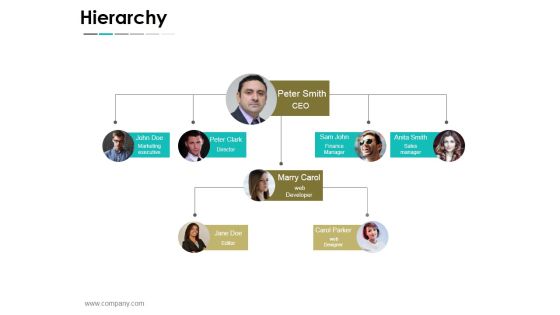
Hierarchy Ppt PowerPoint Presentation Summary Background
This is a hierarchy ppt powerpoint presentation summary background. This is a four stage process. The stages in this process are marketing executive, director, finance manager, sales manager, web developer, editor.

Area Chart Ppt PowerPoint Presentation Gallery Icons
This is a area chart ppt powerpoint presentation gallery icons. This is a two stage process. The stages in this process are financial year, sales in percentage, product, finance, graph.
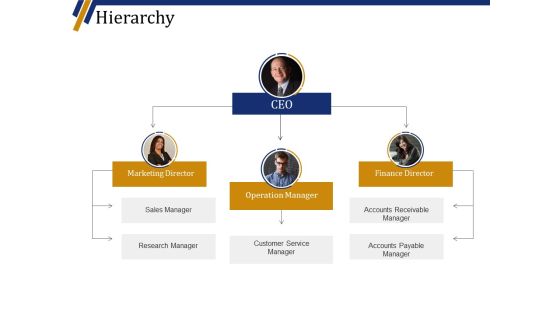
Hierarchy Ppt PowerPoint Presentation Layouts Visuals
This is a hierarchy ppt powerpoint presentation layouts visuals. This is a three stage process. The stages in this process are marketing director, operation manager, finance director, sales manager, research manager.

Stack Area Chart Ppt PowerPoint Presentation Example File
This is a stack area chart ppt powerpoint presentation example file. This is a two stage process. The stages in this process are product, sales in percentage, percentage, finance.

Line Chart Ppt PowerPoint Presentation Infographics Infographics
This is a line chart ppt powerpoint presentation infographics infographics. This is a two stage process. The stages in this process are product, sales in percentage, financial year, line chart, finance.

Area Chart Ppt PowerPoint Presentation Layouts Images
This is a area chart ppt powerpoint presentation layouts images. This is a two stage process. The stages in this process are product, sales in percentage, area chart, percentage, finance.
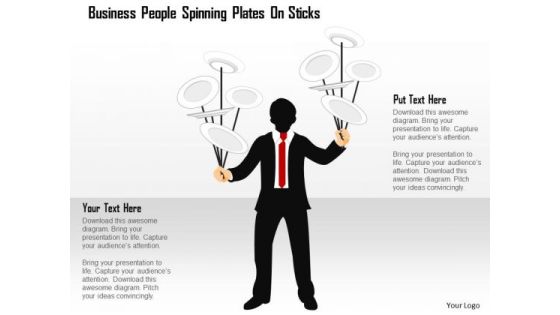
Business Diagram People Spinning Plates On Sticks Presentation Template
This power point template has been crafted with graphic of 3d business men in line. This PPT contains the concept of strategy and target selection. Use this PPT for your business and sales related presentations.

Area Chart Ppt PowerPoint Presentation Pictures Template
This is a area chart ppt powerpoint presentation pictures template. This is a two stage process. The stages in this process are sales in percentage, chart, business, marketing, strategy.

Bar Chart Ppt PowerPoint Presentation File Slide
This is a bar chart ppt powerpoint presentation file slide. This is a one stage process. The stages in this process are sales in percentage financial years, business, marketing, strategy, graph.
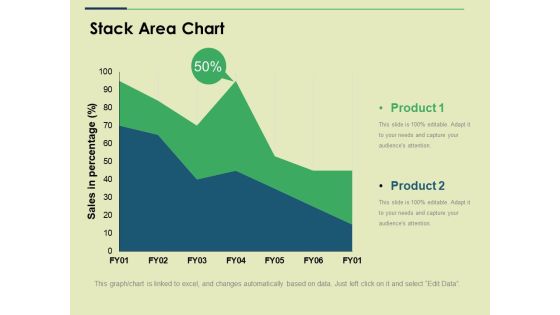
Stack Area Chart Ppt PowerPoint Presentation Show Slide
This is a stack area chart ppt powerpoint presentation show slide. This is a two stage process. The stages in this process are sales in percentage, business, marketing, strategy, graph.

Stacked Bar Ppt PowerPoint Presentation Portfolio Background Image
This is a two stacked bar ppt powerpoint presentation portfolio background image. This is a two stage process. The stages in this process are sales in percentage, graph, business, marketing, strategy.
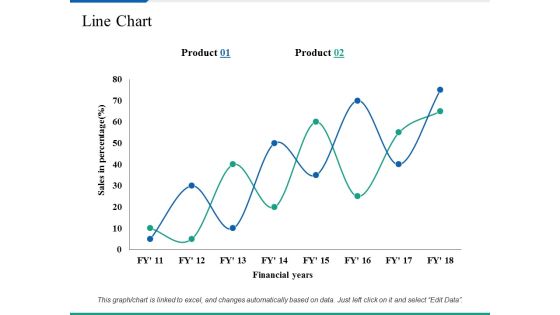
Line Chart Ppt PowerPoint Presentation Summary Clipart Images
This is a line chart ppt powerpoint presentation summary clipart images. This is a two stage process. The stages in this process are business, marketing, sales in percentage, financial years, strategy.

Back To School Banner Educational Theme Image Ppt PowerPoint Presentation Slides File Formats
This is a back to school banner educational theme image ppt powerpoint presentation slides file formats. This is a four stage process. The stages in this process are sales process school banner project, school poster project.

Back To School Classroom Welcome Banner Ppt PowerPoint Presentation Gallery Icons
This is a back to school classroom welcome banner ppt powerpoint presentation gallery icons. This is a four stage process. The stages in this process are sales process school banner project, school poster project.

Back To School Poster With Stationery Items Ppt PowerPoint Presentation Show Influencers
This is a back to school poster with stationery items ppt powerpoint presentation show influencers. This is a one stage process. The stages in this process are sales process school banner project, school poster project.

Back To School Theme For Kids Poster Image Ppt PowerPoint Presentation Professional Introduction
This is a back to school theme for kids poster image ppt powerpoint presentation professional introduction. This is a three stage process. The stages in this process are sales process school banner project, school poster project.

I Love School Drawing Banner With Books And Color Pens Ppt PowerPoint Presentation Inspiration Visual Aids
This is a i love school drawing banner with books and color pens ppt powerpoint presentation inspiration visual aids. This is a five stage process. The stages in this process are sales process school banner project, school poster project.

I Love School Kids Poster Ppt PowerPoint Presentation Layouts Slides
This is a i love school kids poster ppt powerpoint presentation layouts slides. This is a four stage process. The stages in this process are sales process school banner project, school poster project.

Kids Standing Together Holding Hands School Banner Ppt PowerPoint Presentation Layouts Pictures
This is a kids standing together holding hands school banner ppt powerpoint presentation layouts pictures. This is a six stage process. The stages in this process are sales process school banner project, school poster project.
School Banner Image For Back To School Theme Ppt PowerPoint Presentation Icon Display
This is a school banner image for back to school theme ppt powerpoint presentation icon display. This is a six stage process. The stages in this process are sales process school banner project, school poster project.

School Poster With Colorful Welcome Hanging Letters Ppt PowerPoint Presentation Inspiration Slides
This is a school poster with colorful welcome hanging letters ppt powerpoint presentation inspiration slides. This is a seven stage process. The stages in this process are sales process school banner project, school poster project.

Clustered Column Line Ppt PowerPoint Presentation Model Rules
This is a clustered column line ppt powerpoint presentation model rules. This is a four stage process. The stages in this process are financial year, sales in percentage, business, marketing, growth, graph.
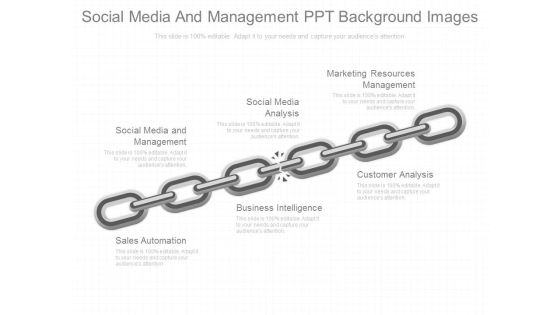
Social Media And Management Ppt Background Images
This is a social media and management ppt background images. This is a six stage process. The stages in this process are social media and management, social media analysis, marketing resources management, sales automation, business intelligence, customer analysis.
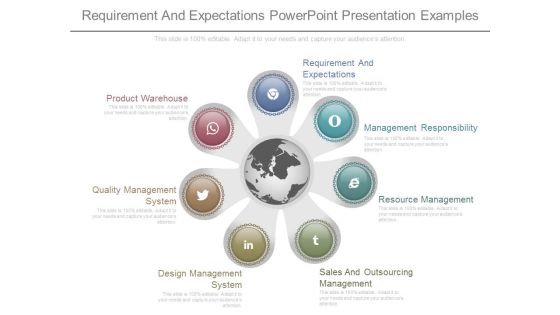
Requirement And Expectations Powerpoint Presentation Examples
This is a requirement and expectations powerpoint presentation examples. This is a seven stage process. The stages in this process are requirement and expectations, management responsibility, resource management, sales and outsourcing management, design management system, quality management system, product warehouse.

Marketing Information System Example Ppt Slide Themes
This is a marketing information system example ppt slide themes. This is a six stage process. The stages in this process are government resources, customers, sales force, marketing research, data analytics, interactive marketing.
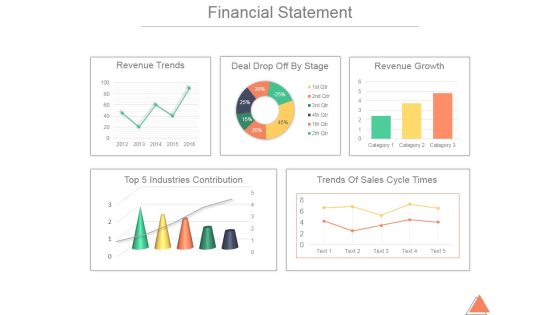
Financial Statement Ppt PowerPoint Presentation Guide
This is a financial statement ppt powerpoint presentation guide. This is a five stage process. The stages in this process are top 5 industries contribution, trends of sales cycle times, revenue trends, deal drop off by stage, revenue growth.
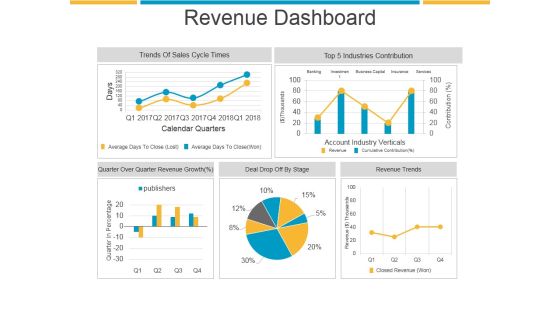
Revenue Dashboard Ppt PowerPoint Presentation Sample
This is a revenue dashboard ppt powerpoint presentation sample. This is a five stage process. The stages in this process are trends of sales cycle times, industries contribution, revenue trends, deal drop off by stage.

Financial Statement Ppt PowerPoint Presentation Professional Clipart
This is a financial statement ppt powerpoint presentation professional clipart. This is a five stage process. The stages in this process are revenue trends, revenue growth, deal drop off by stage, trends of sales cycle times.

Business Diagram Circle Chart For Percentage Ratio Presentation Template
Four staged circular chart has been used to craft this PPT diagram. This PPT contains the concept of result analysis. Use this PPT in your business and sales presentation and display any kind of result analysis in a graphical way.

Business Diagram Globe Bar Graph And Bulb For International Business Diagram Presentation Template
Graphic of globe and bar graph with bulb has been used to craft this power point template diagram. This PPT diagram contains the concept of international business growth analysis. Use this PPT for global business and sales related presentations.
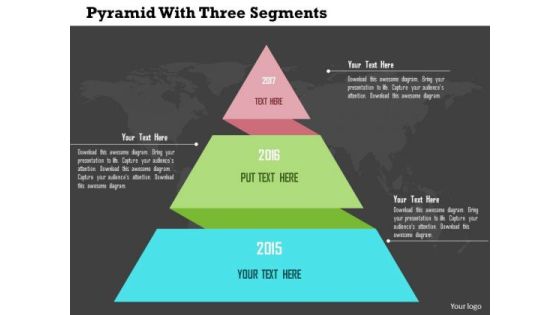
Business Diagram Pyramid With Three Segments Presentation Template
Sales process can be explained with this pyramid diagram. This diagram contains the graphic of pyramid chart with three segments. This diagram provides an effective way of displaying information.
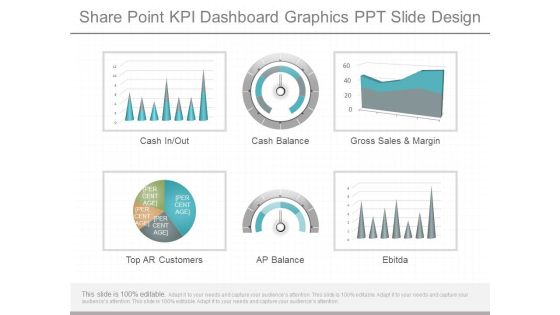
Share Point Kpi Dashboard Graphics Ppt Slide Design
This is a share point kpi dashboard graphics ppt slide design. This is a six stage process. The stages in this process are cash in out, cash balance, gross sales and margin, top ar customers, ap balance, ebitda.
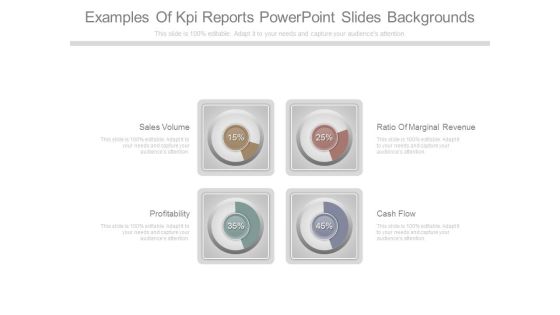
Examples Of Kpi Reports Powerpoint Slides Backgrounds
This is a examples of kpi reports powerpoint slides backgrounds. This is a four stage process. The stages in this process are sales volume, profitability, ratio of marginal revenue, cash flow.

Kpis And Operations Metrics Presentation Powerpoint Example
This is a kpis and operations metrics presentation powerpoint example. This is a five stage process. The stages in this process are customer class, affiliate, sales by warehouse, warehouse, profit by affiliate.
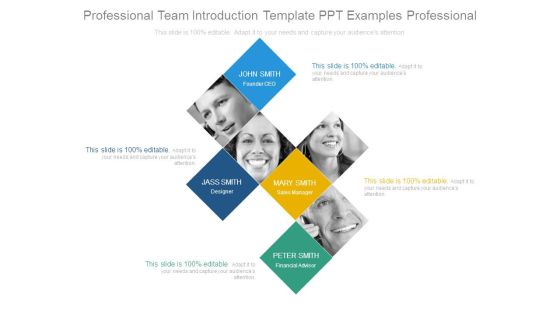
Professional Team Introduction Template Ppt Examples Professional
This is a professional team introduction template ppt examples professional. This is a four stage process. The stages in this process are founder ceo, designer, sales manager, financial advisor.

Measuring Content Marketing Performance Ppt PowerPoint Presentation Design Ideas
This is a measuring content marketing performance ppt powerpoint presentation design ideas. This is a eight stage process. The stages in this process are conversion rate, quality of leads, website traffic, number of leads, sales revenue, subscriber list growth.

Bar Chart Ppt PowerPoint Presentation Pictures Background Image
This is a bar chart ppt powerpoint presentation pictures background image. This is a seven stage process. The stages in this process are financial years, sales in percentage, graph, business.

Content Marketing Performance Ppt PowerPoint Presentation Slides Model
This is a content marketing performance ppt powerpoint presentation slides model. This is a eight stage process. The stages in this process are conversion rate, quality of leads, number of leads, sales revenue, website traffic.

 Home
Home