Sales Budget
Sales KPI Tracker Ppt PowerPoint Presentation Icon Themes
This is a sales kpi tracker ppt powerpoint presentation icon themes. This is a six stage process. The stages in this process are business, marketing, opportunities won, top products in revenue, leads created.
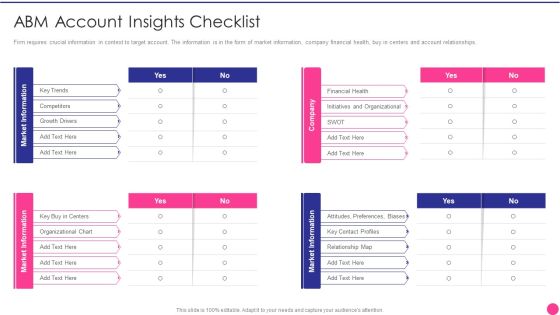
Operating B2B Sales Abm Account Insights Checklist Demonstration PDF
Firm requires crucial information in context to target account. The information is in the form of market information, company financial health, buy in centers and account relationships. Deliver an awe inspiring pitch with this creative operating b2b sales abm account insights checklist demonstration pdf bundle. Topics like competitors, key trends, growth drivers, organizational chart can be discussed with this completely editable template. It is available for immediate download depending on the needs and requirements of the user.
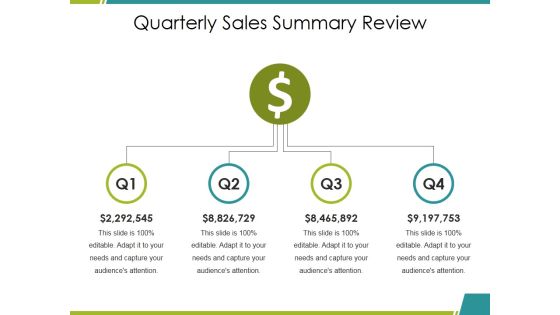
Quarterly Sales Summary Review Ppt PowerPoint Presentation Show Clipart
This is a quarterly sales summary review ppt powerpoint presentation show clipart. This is a four stage process. The stages in this process are dollar, business, finance, marketing, symbol.

Quarterly Sales Summary Review Ppt PowerPoint Presentation Portfolio Slides
This is a quarterly sales summary review ppt powerpoint presentation portfolio slides. This is a one stage process. The stages in this process are dollar, business, finance, marketing, symbol.
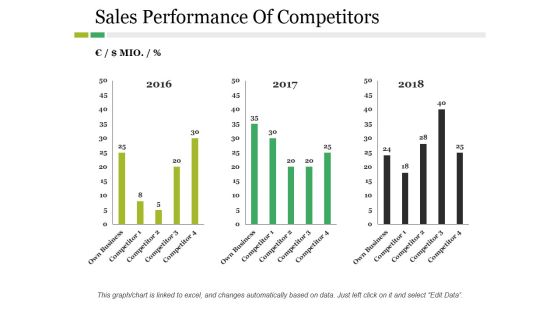
Sales Performance Of Competitors Ppt PowerPoint Presentation Inspiration Example
This is a sales performance of competitors ppt powerpoint presentation inspiration example. This is a three stage process. The stages in this process are business, marketing, year, bar graph, finance.

Sales PowerPoint Template Linear Arrows 9 Stages Project Management Graphic
sales PowerPoint template linear arrows 9 stages project management Graphic-The vision of being the market leader is clear to you. Transmit your thoughts via this linear arrow PPT slide and prod your team to action. Motivate your team to cross all barriers-sales PowerPoint template linear arrows 9 stages project management Graphic-Aim, Angle, Arrow, Arrowheads, Badge, Banner, Connection, Curve, Design, Direction, Download, Element, Fuchsia, Icon, Illustration, Indicator, Internet, Label, Link, Magenta, Mark, Marker, Next, Object, Orange, Orientation, Pointer, Shadow, Shape, Signs Symbol

Manager Icon Highlighting Sales And Marketing Project Results Sample PDF
Persuade your audience using this Manager Icon Highlighting Sales And Marketing Project Results Sample PDF. This PPT design covers three stages, thus making it a great tool to use. It also caters to a variety of topics including Manager Icon Highlighting Sales, Marketing Project Results. Download this PPT design now to present a convincing pitch that not only emphasizes the topic but also showcases your presentation skills.
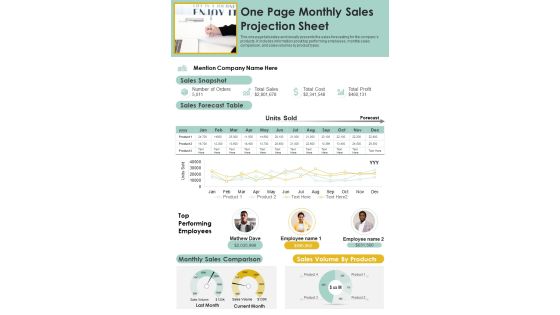
One Page Monthly Sales Projection Sheet PDF Document PPT Template
Presenting you an exemplary One Page Monthly Sales Projection Sheet PDF Document PPT Template. Our one-pager template comprises all the must-have essentials of an inclusive document. You can edit it with ease, as its layout is completely editable. With such freedom, you can tweak its design and other elements to your requirements. Download this One Page Monthly Sales Projection Sheet PDF Document PPT Template Download now.

CRM Implementation Strategy CRM Implementation Dashboard With Sales Pictures PDF
The following slide showcases the CRM dashboard which includes leads, deals, sales revenue, revenue by products, total leads by source, total leads by status and lead distribution.Deliver and pitch your topic in the best possible manner with this CRM Implementation Strategy CRM Implementation Dashboard With Sales Pictures PDF Use them to share invaluable insights on Leads By Status, Leads By Source, Lead Distribution and impress your audience. This template can be altered and modified as per your expectations. So, grab it now.
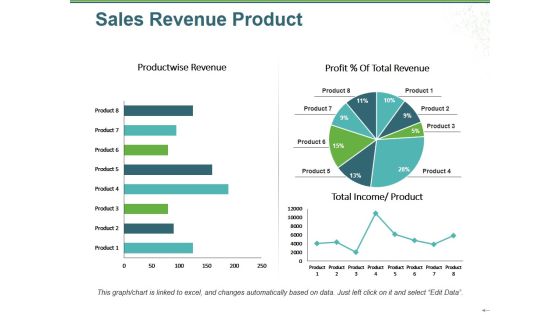
Sales Revenue Product Ppt PowerPoint Presentation Infographic Template Infographic Template
This is a sales revenue product ppt powerpoint presentation infographic template infographic template. This is a three stage process. The stages in this process are product wise revenue, total income, product, profit total revenue, pie.

Sales Performance Of Competitors Ppt PowerPoint Presentation Portfolio Sample
This is a sales performance of competitors ppt powerpoint presentation portfolio sample. This is a three stage process. The stages in this process are business, marketing, finance, graph, years.
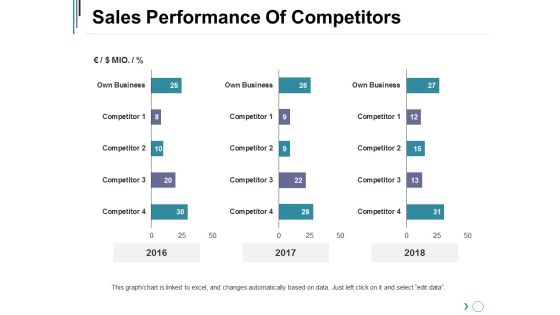
Sales Performance Of Competitors Ppt PowerPoint Presentation Inspiration Slideshow
This is a sales performance of competitors ppt powerpoint presentation inspiration slideshow. This is a three stage process. The stages in this process are business, marketing, graph, finance, years.

Sales Performance Of Competitors Ppt PowerPoint Presentation Portfolio Templates
This is a sales performance of competitors ppt powerpoint presentation portfolio templates. This is a three stage process. The stages in this process are business, marketing, percentage, graph, finance.

Sales Performance Of Competitors Ppt PowerPoint Presentation Layouts Elements
This is a sales performance of competitors ppt powerpoint presentation layouts elements. This is a three stage process. The stages in this process are years, bar graph, finance, business, marketing.

Magnifying Glass For Sales Performance Review Ppt PowerPoint Presentation Model
This is a magnifying glass for sales performance review ppt powerpoint presentation model. This is a four stage process. The stage in this process are magnifier glass, pie, finance, percentage, research.
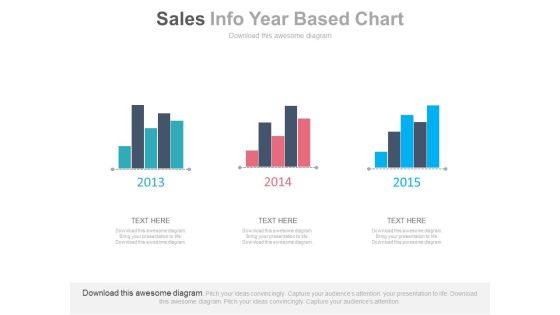
Three Years Sales Data Bar Graph Powerpoint Slides
This PowerPoint template has been designed with bar charts. This business slide may be used to display three years sales data for comparison. Present your views and ideas with this impressive design.

Sales Performance Dashboard Top Opportunities Ppt PowerPoint Presentation Layouts Template
This is a sales performance dashboard top opportunities ppt powerpoint presentation layouts template. This is a eight stage process. The stages in this process are revenue, new customer, gross profit, customer satisfaction, brand profitability.

Business Sales And Revenue Analysis Ppt PowerPoint Presentation Layouts Display
This is a business sales and revenue analysis ppt powerpoint presentation layouts display. This is a four stage process. The stages in this process are goals, results, output, deliverables.

Sales Order Management For Bpmn Model Icons PDF
This slide showcases the sales order procedure for business process model and notation. It includes steps such as receive order, production scheduling, logistics arrangement, price calculation and invoice processing.Showcasing this set of slides titled Sales Order Management For Bpmn Model Icons PDF. The topics addressed in these templates are Production Planning, Request Is Processed, Logistics Arrangement. All the content presented in this PPT design is completely editable. Download it and make adjustments in color, background, font etc. as per your unique business setting.
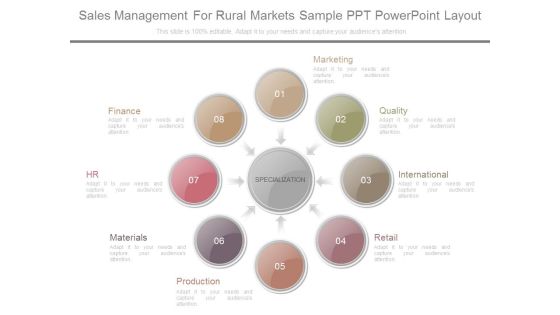
Sales Management For Rural Markets Sample Ppt Powerpoint Layout
This is a sales management for rural markets sample ppt powerpoint layout. This is a eight stage process. The stages in this process are marketing, quality, international, retail, production, materials, hr, finance.

Sales Opportunity Dashboard Depicting International Business Analysis Brochure PDF
This slide showcase sales opportunity dashboard depicting international market analysis which contains opportunities, quarter to date bookings, average purchase value and opportunity breakdown. Showcasing this set of slides titled Sales Opportunity Dashboard Depicting International Business Analysis Brochure PDF. The topics addressed in these templates are Average Purchase Value, Opportunities. All the content presented in this PPT design is completely editable. Download it and make adjustments in color, background, font etc. as per your unique business setting.
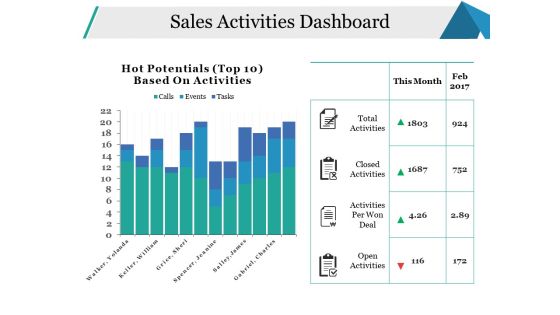
Sales Activities Dashboard Ppt PowerPoint Presentation Pictures Model
This is a sales activities dashboard ppt powerpoint presentation pictures model. This is a two stage process. The stages in this process are open activities, activities per won deal, closed activities, total activities, business.
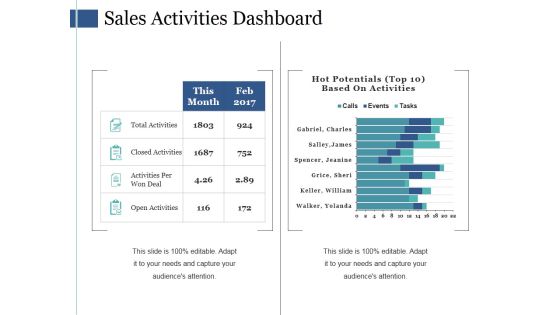
Sales Activities Dashboard Ppt PowerPoint Presentation Ideas Themes
This is a sales activities dashboard ppt powerpoint presentation ideas themes. This is a two stage process. The stages in this process are total activities, closed activities, activities per won deal, open activities.

Sales Activities Dashboard Ppt PowerPoint Presentation Show Skills
This is a sales activities dashboard ppt powerpoint presentation show skills. This is a four stage process. The stages in this process are total activities, closed activities, activities per won deal, open activities, this month.
Sales Kpi Tracker Ppt PowerPoint Presentation Pictures Layout Ideas
This is a sales kpi tracker ppt powerpoint presentation pictures layout ideas. This is a four stage process. The stages in this process are opportunities won, top products in revenue, leads created, win ratio vs last yr, open deals vs.
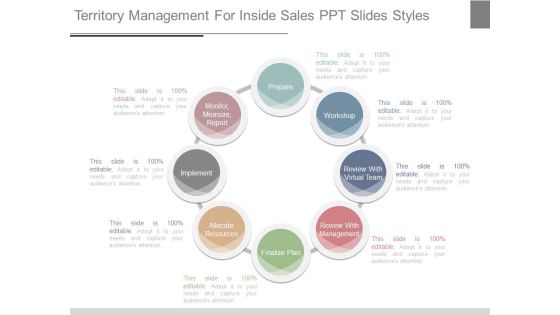
Territory Management For Inside Sales Ppt Slides Styles
This is a territory management for inside sales ppt slides styles. This is a eight stage process. The stages in this process are prepare, workshop, review with virtual team, review with management, finalize plan, allocate resources, implement, monitor, measure, report.
Sales Performance Comparison Graph Of Top Customer Icons PDF
This slide shows the customer sales comparison graph along with the units of product purchased by the clients. Showcasing this set of slides titled Sales Performance Comparison Graph Of Top Customer Icons PDF. The topics addressed in these templates are Highest Units, Customer, Product. All the content presented in this PPT design is completely editable. Download it and make adjustments in color, background, font etc. as per your unique business setting.

Sales Concepts 3d Image Of Info Slide Characters
Add Some Dramatization To Your Thoughts. Our Sales Concepts 3d Image Of Info Slide Characters Powerpoint Templates Make Useful Props. Draw Ahead Of Others With Our people Powerpoint Templates. Cross The Line And Win The Race.

Sales Force Automation Benefits Ppt PowerPoint Presentation Summary Example
This is a sales force automation benefits ppt powerpoint presentation summary example. This is a ten stage process. The stages in this process are note taking, lead management, email integration, mobile support, customization.
Sales By Region Ppt PowerPoint Presentation Ideas Icons
This is a sales by region ppt powerpoint presentation ideas icons. This is a four stage process. The stages in this process are europe, north america, south america, asia pacific, geographical.

Sales By Region Ppt PowerPoint Presentation Infographics Example
This is a sales by region ppt powerpoint presentation infographics example. This is a five stage process. The stages in this process are europe, north america, south america, asia pacific, business.
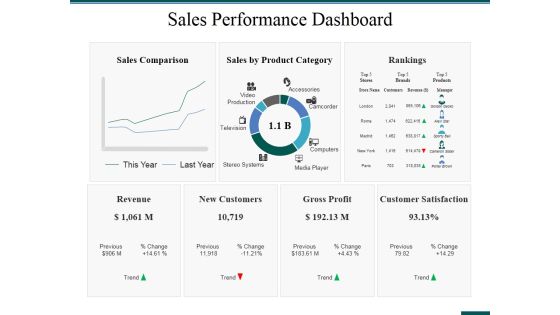
Sales Performance Dashboard Ppt PowerPoint Presentation Ideas Format Ideas
This is a sales performance dashboard ppt powerpoint presentation ideas format ideas. This is a three stage process. The stages in this process are rankings, revenue, new customers, gross profit, customer satisfaction.

5 Step Sales Process Ppt PowerPoint Presentation Inspiration Styles Cpb
This is a 5 step sales process ppt powerpoint presentation inspiration styles cpb. This is a three stage process. The stages in this process are percentage, product, business, management, marketing.
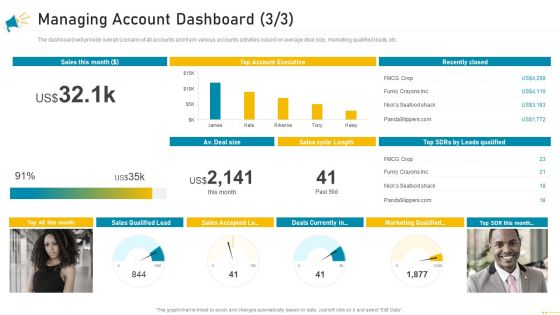
Key Account Marketing Approach Managing Account Dashboard Sales Designs PDF
The dashboard will provide overall scenario of all accounts and track various accounts activities based on average deal size, marketing qualified leads, etc. Deliver and pitch your topic in the best possible manner with this key account marketing approach managing account dashboard sales designs pdf. Use them to share invaluable insights on sales, account executive, marketing and impress your audience. This template can be altered and modified as per your expectations. So, grab it now.

Business Performance After Introducing Offshoring Sales Background PDF
The purpose of this slide is to provide a glimpse of the business performance which includes revenue, gross profit, new customers, and satisfaction level etc. Deliver and pitch your topic in the best possible manner with this business performance after introducing offshoring sales background pdf. Use them to share invaluable insights on sales, gross profit, customers, revenue and impress your audience. This template can be altered and modified as per your expectations. So, grab it now.

Smartphone Sales Dashboard Ppt Infographics Graphic Tips PDF
This slide shows the dashboard related to smartphone market overview, revenue and sales of the company with top smartphones with their details. Deliver an awe inspiring pitch with this creative smartphone sales dashboard ppt infographics graphic tips pdf bundle. Topics like management overview, profit margin, total revenue, net profit can be discussed with this completely editable template. It is available for immediate download depending on the needs and requirements of the user.
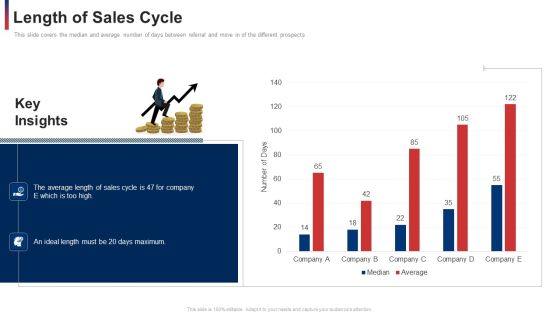
Length Of Sales Cycle Maximum Ppt Infographic Template Introduction PDF
This slide covers the median and average number of days between referral and move in of the different prospects. Deliver an awe-inspiring pitch with this creative length of sales cycle maximum ppt infographic template introduction pdf. bundle. Topics like length of sales cycle can be discussed with this completely editable template. It is available for immediate download depending on the needs and requirements of the user.

Length Of Sales Cycle Ppt Layouts Demonstration PDF
This slide covers the median and average number of days between referral and move in of the different prospects. Deliver and pitch your topic in the best possible manner with this length of sales cycle ppt layouts demonstration pdf. Use them to share invaluable insights on length of sales cycle and impress your audience. This template can be altered and modified as per your expectations. So, grab it now.
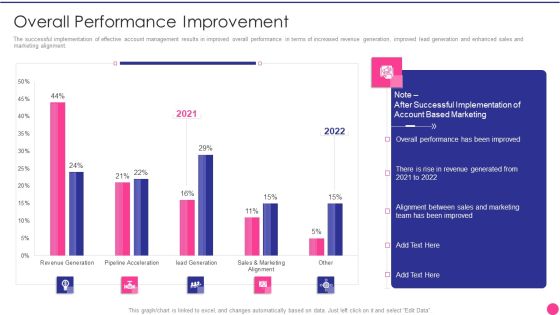
Operating B2B Sales Overall Performance Improvement Brochure PDF
The successful implementation of effective account management results in improved overall performance in terms of increased revenue generation, improved lead generation and enhanced sales and marketing alignment. Deliver an awe inspiring pitch with this creative operating b2b sales overall performance improvement brochure pdf bundle. Topics like overall performance improvement can be discussed with this completely editable template. It is available for immediate download depending on the needs and requirements of the user.

B2B Sales Representatives Performance Tracking Dashboard Pictures PDF
This slide provides information regarding B2B sales representatives performance tracking dashboard to measure leads by region, revenue breakdown, top performers by leads, revenues, etc. Deliver and pitch your topic in the best possible manner with this b2b sales representatives performance tracking dashboard pictures pdf Use them to share invaluable insights on b2b prospects performance measurement dashboard and impress your audience. This template can be altered and modified as per your expectations. So, grab it now.

Company Performance Dashboard With Weekly Sales Revenue Structure PDF
This slide showcases the dashboard of financial organizational performance. It include average revenue per unit, customer lifetime value etc. Showcasing this set of slides titled company performance dashboard with weekly sales revenue structure pdf. The topics addressed in these templates are company performance dashboard with weekly sales revenue. All the content presented in this PPT design is completely editable. Download it and make adjustments in color, background, font etc. as per your unique business setting.

Information Technology Sales Team Accomplishment Evaluation Dashboard Rules PDF
This slide shows IT team performance management dashboard. It provides information about person, design, research and development, testing, launch, timeline, etc.Showcasing this set of slides titled information technology sales team accomplishment evaluation dashboard rules pdf The topics addressed in these templates are information technology sales team accomplishment evaluation dashboard All the content presented in this PPT design is completely editable. Download it and make adjustments in color, background, font etc. as per your unique business setting.

Dashboard Showing Effective Management Of Sales Pipeline Rules PDF
This slide shows the process steps followed by the company for the recruitment of new employees. It stars from Identifying the hiring needs and ends with employment offer. Deliver an awe inspiring pitch with this creative Dashboard Showing Effective Management Of Sales Pipeline Rules PDF bundle. Topics like Dashboard Showing Effective Management Of Sales Pipeline can be discussed with this completely editable template. It is available for immediate download depending on the needs and requirements of the user.
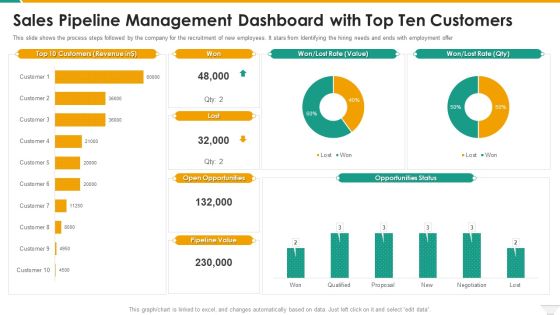
Sales Pipeline Management Dashboard With Top Ten Customers Microsoft PDF
This slide shows the process steps followed by the company for the recruitment of new employees. It stars from Identifying the hiring needs and ends with employment offer. Deliver an awe inspiring pitch with this creative Sales Pipeline Management Dashboard With Top Ten Customers Microsoft PDF bundle. Topics like Sales Pipeline Management Dashboard With Top Ten Customers can be discussed with this completely editable template. It is available for immediate download depending on the needs and requirements of the user.

Auto Sales Revenues Scorecard Of Multiple Countries Inspiration PDF
This graph or chart is linked to excel, and changes automatically based on data. Just left click on it and select Edit Data. Deliver an awe inspiring pitch with this creative Auto Sales Revenues Scorecard Of Multiple Countries Inspiration PDF bundle. Topics like Auto Sales Revenues, Scorecard Multiple Countries can be discussed with this completely editable template. It is available for immediate download depending on the needs and requirements of the user.

Auto Sales Scorecard For Petrol Vs Diesel Vehicles Template PDF
This graph or chart is linked to excel, and changes automatically based on data. Just left click on it and select Edit Data. Deliver an awe inspiring pitch with this creative Auto Sales Scorecard For Petrol Vs Diesel Vehicles Template PDF bundle. Topics like Top Products Revenue, Petrol Vs Diesel, Vehicles Incremental Sales, Marketing Activities Product can be discussed with this completely editable template. It is available for immediate download depending on the needs and requirements of the user.

Auto Sales Weekly Performance Assessment Scorecard Background PDF
This graph or chart is linked to excel, and changes automatically based on data. Just left click on it and select Edit Data. Deliver and pitch your topic in the best possible manner with this Auto Sales Weekly Performance Assessment Scorecard Background PDF. Use them to share invaluable insights on Auto Sales Weekly, Performance Assessment Scorecard and impress your audience. This template can be altered and modified as per your expectations. So, grab it now.
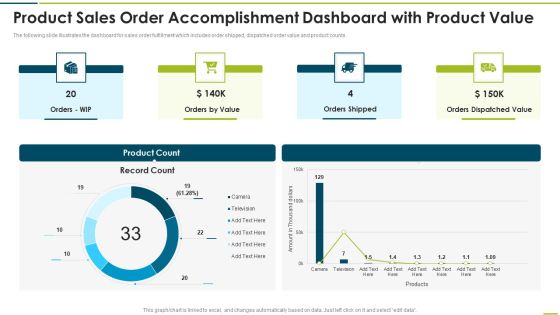
Product Sales Order Accomplishment Dashboard With Product Value Themes PDF
The following slide illustrates the dashboard for sales order fulfillment which includes order shipped, dispatched order value and product counts.Pitch your topic with ease and precision using this Product Sales Order Accomplishment Dashboard With Product Value Themes PDF This layout presents information on Orders Shipped, Dispatched Value, Orders Value It is also available for immediate download and adjustment. So, changes can be made in the color, design, graphics or any other component to create a unique layout.

Company Daily Sales Performance Scorecard With Target Download PDF
This graph or chart is linked to excel, and changes automatically based on data. Just left click on it and select Edit Data. Deliver an awe inspiring pitch with this creative Company Daily Sales Performance Scorecard With Target Download PDF bundle. Topics like Sales Target can be discussed with this completely editable template. It is available for immediate download depending on the needs and requirements of the user.

Company Monthly Sales Performance Scorecard With Region Sample PDF
This graph or chart is linked to excel, and changes automatically based on data. Just left click on it and select Edit Data. Deliver and pitch your topic in the best possible manner with this Company Monthly Sales Performance Scorecard With Region Sample PDF. Use them to share invaluable insights on Company Monthly, Sales Performance, Scorecard Region and impress your audience. This template can be altered and modified as per your expectations. So, grab it now.

Current Year Sales Performance Scorecard With Profits Structure PDF
This graph or chart is linked to excel, and changes automatically based on data. Just left click on it and select Edit Data. Deliver and pitch your topic in the best possible manner with this Current Year Sales Performance Scorecard With Profits Structure PDF. Use them to share invaluable insights on Current Year, YTD Sales, Previous Year and impress your audience. This template can be altered and modified as per your expectations. So, grab it now.
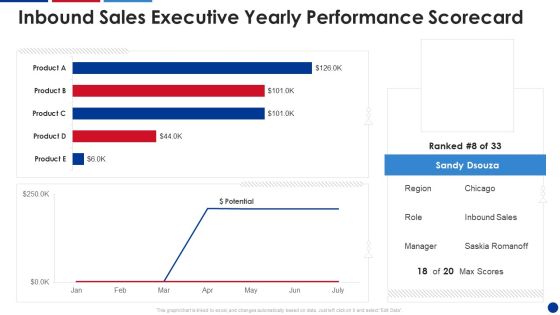
Inbound Sales Executive Yearly Performance Scorecard Information PDF
This graph or chart is linked to excel, and changes automatically based on data. Just left click on it and select Edit Data. Deliver and pitch your topic in the best possible manner with this Inbound Sales Executive Yearly Performance Scorecard Information PDF. Use them to share invaluable insights on Inbound Sales, Executive Yearly, Performance Scorecard and impress your audience. This template can be altered and modified as per your expectations. So, grab it now.
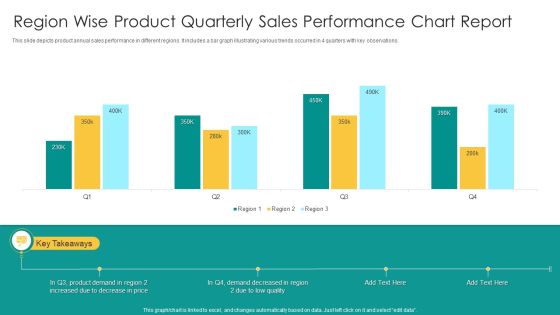
Region Wise Product Quarterly Sales Performance Chart Report Topics PDF
This slide depicts product annual sales performance in different regions. It includes a bar graph illustrating various trends occurred in 4 quarters with key observations. Showcasing this set of slides titled Region Wise Product Quarterly Sales Performance Chart Report Topics PDF. The topics addressed in these templates are Product Demand, Price, Low Quality. All the content presented in this PPT design is completely editable. Download it and make adjustments in color, background, font etc. as per your unique business setting.

B2B Sales Representatives Performance Tracking Dashboard Background PDF
This slide provides information regarding B2B sales representatives performance tracking dashboard to measure leads by region, revenue breakdown, top performers by leads, revenues, etc. Deliver and pitch your topic in the best possible manner with this B2B Sales Representatives Performance Tracking Dashboard Background PDF. Use them to share invaluable insights on Individual Performance, Achieved Highest, Revenue Relative and impress your audience. This template can be altered and modified as per your expectations. So, grab it now.

Sales Departmental Goals Achievement Graph Ppt Inspiration Slide Download PDF
This slide illustrates graphical representation of achievement percentage of each team member. It includes achievement percent, name, due date and target of respective member. Pitch your topic with ease and precision using this Sales Departmental Goals Achievement Graph Ppt Inspiration Slide Download PDF. This layout presents information on Sales Departmental, Goals, Achievement Graph. It is also available for immediate download and adjustment. So, changes can be made in the color, design, graphics or any other component to create a unique layout.
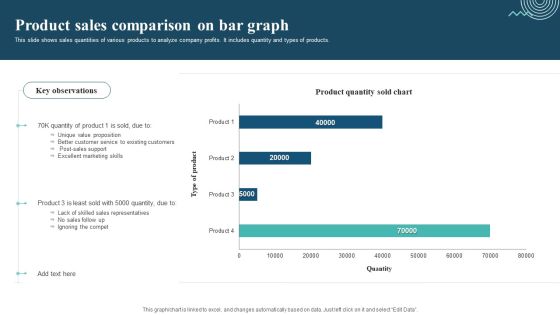
Product Sales Comparison On Bar Graph Sample PDF
This slide shows sales quantities of various products to analyze company profits. It includes quantity and types of products. Pitch your topic with ease and precision using this Product Sales Comparison On Bar Graph Sample PDF. This layout presents information on Unique Value Proposition, Excellent Marketing Skills, Ignoring The Compet. It is also available for immediate download and adjustment. So, changes can be made in the color, design, graphics or any other component to create a unique layout.
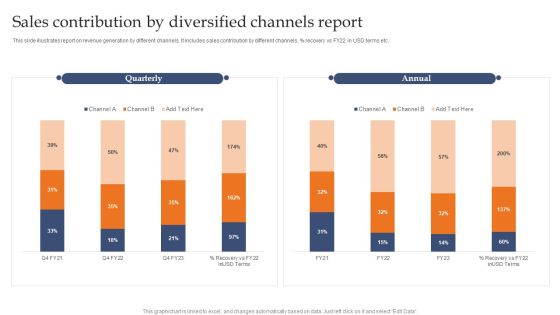
Sales Contribution By Diversified Channels Report Demonstration PDF
This slide illustrates report on revenue generation by different channels. It includes sales contribution by different channels, precent recovery vs FY22 in USD terms etc.Pitch your topic with ease and precision using this Sales Contribution By Diversified Channels Report Demonstration PDF. This layout presents information on Quarterly, Annual, Channel. It is also available for immediate download and adjustment. So, changes can be made in the color, design, graphics or any other component to create a unique layout.
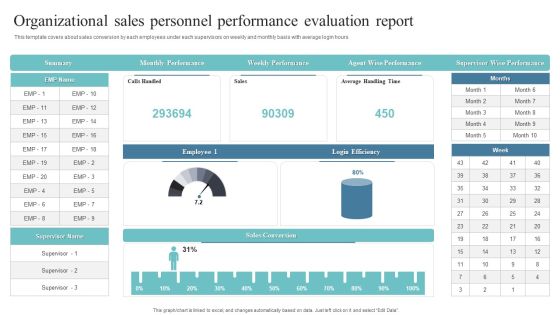
Organizational Sales Personnel Performance Evaluation Report Slides PDF
This template covers about sales conversion by each employees under each supervisors on weekly and monthly basis with average login hours.Pitch your topic with ease and precision using this Organizational Sales Personnel Performance Evaluation Report Slides PDF. This layout presents information on Weekly Performance, Wise Performance, Supervisor Wise Performance. It is also available for immediate download and adjustment. So, changes can be made in the color, design, graphics or any other component to create a unique layout.

Artificial Intelligence Sales Capabilities And Revenue Dashboard Portrait PDF
This slide illustrates artificial intelligence and business intelligence corporate revenue dashboard. It includes pipeline for Aug 2023, revenue for Sep 2023, AI augmented opportunities etc. Pitch your topic with ease and precision using this Artificial Intelligence Sales Capabilities And Revenue Dashboard Portrait PDF. This layout presents information on Sales Capabilities, Revenue Dashboard. It is also available for immediate download and adjustment. So, changes can be made in the color, design, graphics or any other component to create a unique layout.
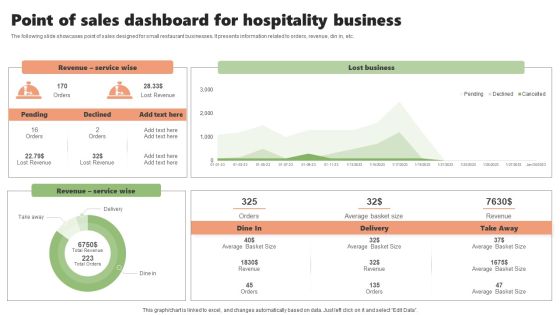
Point Of Sales Dashboard For Hospitality Business Slides PDF
The following slide showcases point of sales designed for small restaurant businesses. It presents information related to orders, revenue, din in, etc. Showcasing this set of slides titled Point Of Sales Dashboard For Hospitality Business Slides PDF. The topics addressed in these templates are Revenue Service Wise, Lost Business, Hospitality Business. All the content presented in this PPT design is completely editable. Download it and make adjustments in color, background, font etc. as per your unique business setting.

 Home
Home