Root Cause Analysis

Data And Analysis Ppt PowerPoint Presentation File Topics
This is a data and analysis ppt powerpoint presentation file topics. This is a six stage process. The stages in this process are root cause analysis, opportunity analysis, timeline analysis, force field analysis.

Data And Analysis Ppt PowerPoint Presentation Icon Diagrams
This is a Data And Analysis Ppt PowerPoint Presentation Icon Diagrams. This is a six stage process. The stages in this process are root cause analysis, opportunity analysis, timeline analysis, force field analysis.

Auditing Cause Effect Flow Ppt PowerPoint Presentation Sample
This is a auditing cause effect flow ppt powerpoint presentation sample. This is a three stage process. The stages in this process are root cause people, root cause equipment, root cause environment, root cause materials, root cause methods, effects resultant problem.
Fishbone Ishikawa Cause And Effect Analysis Table Of Contents Ppt PowerPoint Presentation Icon Format PDF
Presenting this set of slides with name fishbone ishikawa cause and effect analysis table of contents ppt powerpoint presentation icon format pdf. This is a seven stage process. The stages in this process are cause and effect analysis, cause and effect diagram, sources variation, environment, measurement system, material, machine. This is a completely editable PowerPoint presentation and is available for immediate download. Download now and impress your audience.

The Fishbone Analysis Tool What Is A Cause And Effect Diagram Guidelines PDF
Deliver an awe-inspiring pitch with this creative the fishbone analysis tool what is a cause and effect diagram guidelines pdf bundle. Topics like equipment, process, specify cause category, materials, environment, combines brainstorming mind map, business problem successfully can be discussed with this completely editable template. It is available for immediate download depending on the needs and requirements of the user.
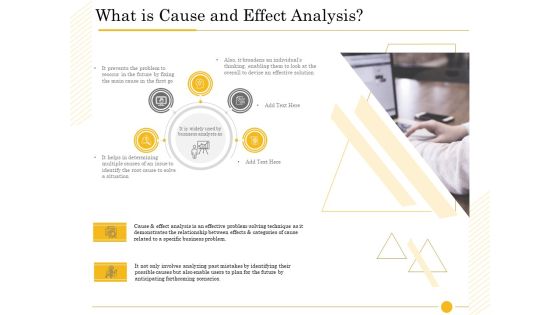
The Fishbone Tool What Is Cause And Effect Analysis Effective Sample PDF
Presenting the fishbone tool what is cause and effect analysis effective sample pdf to provide visual cues and insights. Share and navigate important information on one stage that need your due attention. This template can be used to pitch topics like business analysts, determining multiple, broadens individuals, devise effective solution, prevents problem, demonstrates relationship, anticipating forthcoming scenarios. In addtion, this PPT design contains high-resolution images, graphics, etc, that are easily editable and available for immediate download.
Fishbone Ishikawa Cause And Effect Analysis Idea Generation Ppt PowerPoint Presentation Layouts Diagrams PDF
Presenting this set of slides with name fishbone ishikawa cause and effect analysis idea generation ppt powerpoint presentation layouts diagrams pdf. This is a four stage process. The stages in this process are idea generation. This is a completely editable PowerPoint presentation and is available for immediate download. Download now and impress your audience.

Fishbone Ishikawa Cause And Effect Analysis Magnifying Glass Ppt PowerPoint Presentation Summary Objects PDF
Presenting this set of slides with name fishbone ishikawa cause and effect analysis magnifying glass ppt powerpoint presentation summary objects pdf. This is a four stage process. The stages in this process are magnifying glass. This is a completely editable PowerPoint presentation and is available for immediate download. Download now and impress your audience.

Cause And Effect Analysis Fishbone Diagram Ppt PowerPoint Presentation Gallery Designs PDF
Presenting this set of slides with name cause and effect analysis fishbone diagram ppt powerpoint presentation gallery designs pdf. This is a five stage process. The stages in this process are communication, training, fixtures. This is a completely editable PowerPoint presentation and is available for immediate download. Download now and impress your audience.

Fishbone Ishikawa Cause And Effect Analysis Ppt PowerPoint Presentation Complete Deck With Slides
Presenting this set of slides with name fishbone ishikawa cause and effect analysis ppt powerpoint presentation complete deck with slides. The topics discussed in these slides are business, management, strategy, planning, marketing. This is a completely editable PowerPoint presentation and is available for immediate download. Download now and impress your audience.
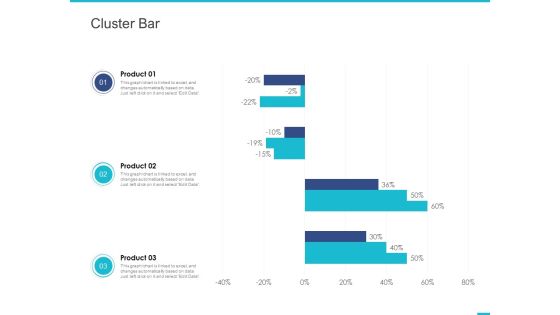
Fishbone Ishikawa Cause And Effect Analysis Cluster Bar Ppt PowerPoint Presentation Portfolio Summary PDF
Presenting this set of slides with name fishbone ishikawa cause and effect analysis cluster bar ppt powerpoint presentation portfolio summary pdf. The topics discussed in these slide is cluster bar. This is a completely editable PowerPoint presentation and is available for immediate download. Download now and impress your audience.
Fishbone Ishikawa Cause And Effect Analysis Icons Slide Ppt PowerPoint Presentation Professional Clipart PDF
Presenting this set of slides containing editable icons for topic fishbone ishikawa cause and effect analysis icons slide ppt powerpoint presentation professional clipart pdf. All icons in this slide are 100 percent editable. You can replace icons in your deck with any of these icons. Download now and impress your audience.

Fishbone Ishikawa Cause And Effect Analysis Our Goals Ppt PowerPoint Presentation Show Outfit PDF
Presenting this set of slides with name fishbone ishikawa cause and effect analysis our goals ppt powerpoint presentation show outfit pdf. This is a five stage process. The stages in this process are our goals. This is a completely editable PowerPoint presentation and is available for immediate download. Download now and impress your audience.

Fishbone Ishikawa Cause And Effect Analysis Our Mission Ppt PowerPoint Presentation Layouts Picture PDF
Presenting this set of slides with name fishbone ishikawa cause and effect analysis our mission ppt powerpoint presentation layouts picture pdf. This is a three stage process. The stages in this process are vision, mission, goal. This is a completely editable PowerPoint presentation and is available for immediate download. Download now and impress your audience.

Fishbone Ishikawa Cause And Effect Analysis Our Team Ppt PowerPoint Presentation Portfolio Professional PDF
Presenting this set of slides with name fishbone ishikawa cause and effect analysis our team ppt powerpoint presentation portfolio professional pdf. This is a three stage process. The stages in this process are our team. This is a completely editable PowerPoint presentation and is available for immediate download. Download now and impress your audience.
Fishbone Ishikawa Cause And Effect Analysis Puzzle Ppt PowerPoint Presentation File Graphics Template PDF
Presenting this set of slides with name fishbone ishikawa cause and effect analysis puzzle ppt powerpoint presentation file graphics template pdf. This is a five stage process. The stages in this process are puzzle. This is a completely editable PowerPoint presentation and is available for immediate download. Download now and impress your audience.
Fishbone Ishikawa Cause And Effect Analysis Sources Of Variation Machine Ppt PowerPoint Presentation Gallery Icon PDF
Presenting this set of slides with name fishbone ishikawa cause and effect analysis sources of variation machine ppt powerpoint presentation gallery icon pdf. The topics discussed in these slides are equipment, physical conditions, effectiveness, machine serviced regularly. This is a completely editable PowerPoint presentation and is available for immediate download. Download now and impress your audience.
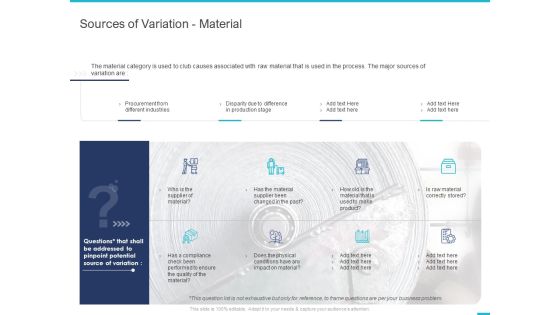
Fishbone Ishikawa Cause And Effect Analysis Sources Of Variation Material Ppt PowerPoint Presentation Graphics PDF
Presenting this set of slides with name fishbone ishikawa cause and effect analysis sources of variation material ppt powerpoint presentation graphics pdf. The topics discussed in these slides are procurement different industries, disparity due difference production stage, supplier material. This is a completely editable PowerPoint presentation and is available for immediate download. Download now and impress your audience.
Fishbone Ishikawa Cause And Effect Analysis Stacked Column Ppt PowerPoint Presentation File Icons PDF
Presenting this set of slides with name fishbone ishikawa cause and effect analysis stacked column ppt powerpoint presentation file icons pdf. The topics discussed in these slide is stacked column. This is a completely editable PowerPoint presentation and is available for immediate download. Download now and impress your audience.

Fishbone Ishikawa Cause And Effect Analysis Thank You Ppt PowerPoint Presentation File Backgrounds PDF
Presenting this set of slides with name fishbone ishikawa cause and effect analysis thank you ppt powerpoint presentation file backgrounds pdf. The topics discussed in these slide is thank you. This is a completely editable PowerPoint presentation and is available for immediate download. Download now and impress your audience.
Fishbone Ishikawa Cause And Effect Analysis Timeline Ppt PowerPoint Presentation Layouts Graphics PDF
Presenting this set of slides with name fishbone ishikawa cause and effect analysis timeline ppt powerpoint presentation layouts graphics pdf. This is a five stage process. The stages in this process are timeline, 2016 to 2020. This is a completely editable PowerPoint presentation and is available for immediate download. Download now and impress your audience.
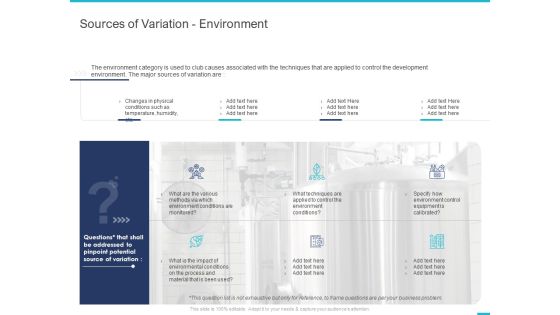
Fishbone Ishikawa Cause And Effect Analysis Sources Of Variation Environment Ppt PowerPoint Presentation Slides Objects PDF
Presenting this set of slides with name fishbone ishikawa cause and effect analysis sources of variation environment ppt powerpoint presentation slides objects pdf. The topics discussed in these slides are changes physical conditions, such temperature, humidity, environment conditions, specify environment control equipment calibrated. This is a completely editable PowerPoint presentation and is available for immediate download. Download now and impress your audience.

The Fishbone Analysis Tool Why Use Cause And Effect Diagram Mockup PDF
This is a the fishbone analysis tool why use cause and effect diagram mockup pdf template with various stages. Focus and dispense information on six stages using this creative set, that comes with editable features. It contains large content boxes to add your information on topics like communicate issues, encourages critical thinking, team members, facilitates system thinking, listing multiple causes. You can also showcase facts, figures, and other relevant content using this PPT layout. Grab it now.

Quality Assessment Cause Effect Diagram Risk Management Tool Clipart PDF
This slide covers quality risk management tool such as Cause effect diagram. Create an editable Quality Assessment Cause Effect Diagram Risk Management Tool Clipart PDF that communicates your idea and engages your audience. Whether youre presenting a business or an educational presentation, pre designed presentation templates help save time. Quality Assessment Cause Effect Diagram Risk Management Tool Clipart PDF is highly customizable and very easy to edit, covering many different styles from creative to business presentations. Slidegeeks has creative team members who have crafted amazing templates. So, go and get them without any delay.
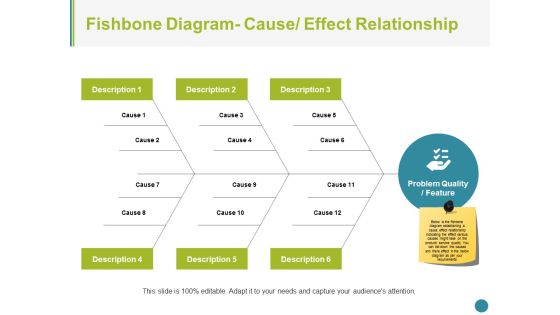
Fishbone Diagram Cause Effect Relationship Ppt PowerPoint Presentation Styles Files
This is a Fishbone Diagram Cause Effect Relationship Ppt PowerPoint Presentation Styles Files. This is a six stage process. The stages in this process are fishbone, management, strategy, analysis, business.
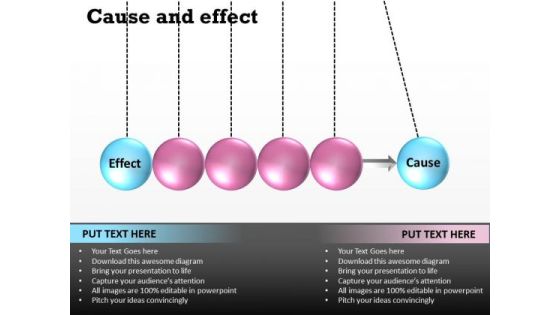
Mba Models And Frameworks Cause And Effect Marketing Diagram
Double Your Chances With Our MBA models and frameworks Cause And Effect Marketing Diagram Powerpoint Templates. The Value Of Your Thoughts Will Increase Two-Fold.
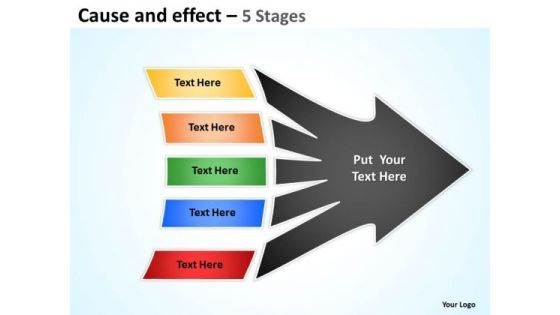
Business Framework Model Cause And Effect Step 5 Strategy Diagram
Our Business Framework Model Cause And Effect Step 5 Strategy Diagram Powerpoint Templates Team Are A Dogged Lot. They Keep At It Till They Get It Right.

Quality Evaluation Cause Effect Diagram Risk Management Tool Mockup PDF
This slide covers quality risk management tool such as Cause or effect diagram. If you are looking for a format to display your unique thoughts, then the professionally designed Quality Evaluation Cause Effect Diagram Risk Management Tool Mockup PDF is the one for you. You can use it as a Google Slides template or a PowerPoint template. Incorporate impressive visuals, symbols, images, and other charts. Modify or reorganize the text boxes as you desire. Experiment with shade schemes and font pairings. Alter, share or cooperate with other people on your work. Download Quality Evaluation Cause Effect Diagram Risk Management Tool Mockup PDF and find out how to give a successful presentation. Present a perfect display to your team and make your presentation unforgettable.

Network Planning And Analysis Chart Powerpoint Slides Designs Download
This is a network planning and analysis chart powerpoint slides designs download. This is a six stage process. The stages in this process are equipment planning, proof of concept, project execution, configuration, installation, gap and root cause analysis.
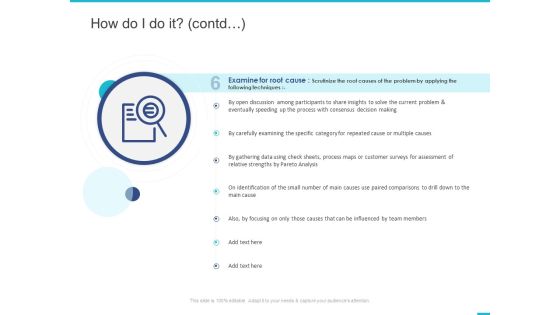
Fishbone Ishikawa Cause And Effect Analysis How Do I Do It Contd Assessment Ppt PowerPoint Presentation Show Clipart Images PDF
Presenting this set of slides with name fishbone ishikawa cause and effect analysis how do i do it contd assessment ppt powerpoint presentation show clipart images pdf. The topics discussed in these slides are examine root cause, following techniques, process, influenced, team members. This is a completely editable PowerPoint presentation and is available for immediate download. Download now and impress your audience.

Vicious Circle Effect On Quality Assurance Process Flow Of Cause And Effect Analysis Ppt Portfolio Structure PDF
Presenting vicious circle effect on quality assurance process flow of cause and effect analysis ppt portfolio structure pdf to provide visual cues and insights. Share and navigate important information on seven stages that need your due attention. This template can be used to pitch topics like brainstorm, draw fishbone diagram, align output cause categories, allocate causes, examine root cause, test reliability, identify problem. In addtion, this PPT design contains high-resolution images, graphics, etc, that are easily editable and available for immediate download.
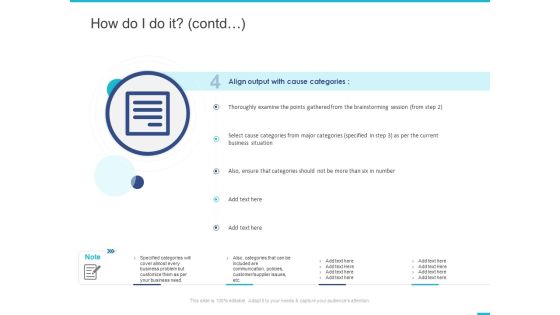
Fishbone Ishikawa Cause And Effect Analysis How Do I Do It Contd Communication Ppt PowerPoint Presentation Show Layout PDF
Presenting this set of slides with name fishbone ishikawa cause and effect analysis how do i do it contd communication ppt powerpoint presentation show layout pdf. This is a one stage process. The stages in this process are align output cause categories, brainstorming, business situation. This is a completely editable PowerPoint presentation and is available for immediate download. Download now and impress your audience.
Fishbone Ishikawa Cause And Effect Analysis How Do I Do It Contd Problem Ppt PowerPoint Presentation Icon Graphics Pictures PDF
Presenting this set of slides with name fishbone ishikawa cause and effect analysis how do i do it contd problem ppt powerpoint presentation icon graphics pictures pdf. This is a one stage process. The stages in this process are allocate causes, brainstorming, problem, further developed. This is a completely editable PowerPoint presentation and is available for immediate download. Download now and impress your audience.
Fishbone Ishikawa Cause And Effect Analysis Sources Of Variation Method Ppt PowerPoint Presentation Icon Example Topics PDF
Presenting this set of slides with name fishbone ishikawa cause and effect analysis sources of variation method ppt powerpoint presentation icon example topics pdf. The topics discussed in these slides are different methods followed produce products, alterations caused inappropriate methods, processes, effectiveness. This is a completely editable PowerPoint presentation and is available for immediate download. Download now and impress your audience.

Fishbone Ishikawa Cause And Effect Analysis How Do I Do It Contd Material Ppt PowerPoint Presentation Model Picture PDF
Presenting this set of slides with name fishbone ishikawa cause and effect analysis how do i do it contd material ppt powerpoint presentation model picture pdf. This is a one stage process. The stages in this process are draw fishbone diagram, problem, measurement system, material. This is a completely editable PowerPoint presentation and is available for immediate download. Download now and impress your audience.

Fishbone Ishikawa Cause And Effect Analysis How Do I Do It Contd Ppt PowerPoint Presentation Styles Template PDF
Presenting this set of slides with name fishbone ishikawa cause and effect analysis how do i do it contd ppt powerpoint presentation styles template pdf. This is a one stage process. The stages in this process are brainstorm, brainstorming session, involve, encourage participation. This is a completely editable PowerPoint presentation and is available for immediate download. Download now and impress your audience.
Fishbone Ishikawa Cause And Effect Analysis How Do I Do It Ppt PowerPoint Presentation Icon Graphics Tutorials PDF
Presenting this set of slides with name fishbone ishikawa cause and effect analysis how do i do it ppt powerpoint presentation icon graphics tutorials pdf. This is a one stage process. The stages in this process are identify problem, business, analyzed, problem. This is a completely editable PowerPoint presentation and is available for immediate download. Download now and impress your audience.

Fishbone Ishikawa Cause And Effect Analysis Sources Of Variation People Ppt PowerPoint Presentation Infographics Designs Download PDF
Presenting this set of slides with name fishbone ishikawa cause and effect analysis sources of variation people ppt powerpoint presentation infographics designs download pdf. The topics discussed in these slides are skill, knowledge, attitude worker, individual justified, equipment. This is a completely editable PowerPoint presentation and is available for immediate download. Download now and impress your audience.

Fishbone Ishikawa Cause And Effect Analysis Sources Of Variation Measurement System Ppt PowerPoint Presentation Layouts Graphic Tips PDF
Presenting this set of slides with name fishbone ishikawa cause and effect analysis sources of variation measurement system ppt powerpoint presentation layouts graphic tips pdf. The topics discussed in these slides are multiple measuring, variations due difference, measuring instruments, equipment, knowledge and experience. This is a completely editable PowerPoint presentation and is available for immediate download. Download now and impress your audience.
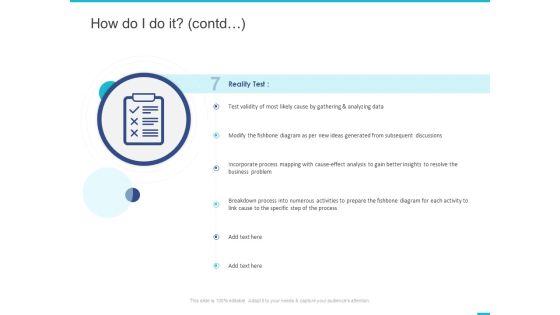
Fishbone Ishikawa Cause And Effect Analysis How Do I Do It Contd Process Ppt PowerPoint Presentation Portfolio Design Inspiration PDF
Presenting this set of slides with name fishbone ishikawa cause and effect analysis how do i do it contd process ppt powerpoint presentation portfolio design inspiration pdf. This is a one stage process. The stages in this process are reality test, analyzing data, business problem, process. This is a completely editable PowerPoint presentation and is available for immediate download. Download now and impress your audience.
Problem Failure Analysis Procedure Flowchart Designs PDF
This slide highlights root cause failure analysis process aimed at improving process performance by rectifying equipment reliability using effective troubleshooting. It covers outlining reasons to perform root cause analysis and repair equipment. Showcasing this set of slides titled Problem Failure Analysis Procedure Flowchart Designs PDF. The topics addressed in these templates are Evaluate Reasons, Problem Failure Analysis, Procedure Flowchart. All the content presented in this PPT design is completely editable. Download it and make adjustments in color, background, font etc. as per your unique business setting.
Problem Analysis Procedure Steps Demonstration PDF
This slide outlines steps of root cause analysis process aimed at determining underlying cause of an event or a problem. It covers six steps define problem, collect data, determine potential factors and root cause, prioritize causes and implement. Presenting Problem Analysis Procedure Steps Demonstration PDF to dispense important information. This template comprises six stages. It also presents valuable insights into the topics including Determine Potential Factors, Prioritize Causes, Determine Root Cause. This is a completely customizable PowerPoint theme that can be put to use immediately. So, download it and address the topic impactfully.

Risk Based Methodology Cause Effect Diagram Risk Management Tool Brochure PDF
This slide covers quality risk management tool such as Cause or effect diagram. Do you have an important presentation coming up Are you looking for something that will make your presentation stand out from the rest Look no further than Risk Based Methodology Cause Effect Diagram Risk Management Tool Brochure PDF. With our professional designs, you can trust that your presentation will pop and make delivering it a smooth process. And with Slidegeeks, you can trust that your presentation will be unique and memorable. So why wait Grab Risk Based Methodology Cause Effect Diagram Risk Management Tool Brochure PDF today and make your presentation stand out from the rest

PMP Tools Cause And Effect Diagram For Project Management Introduction PDF
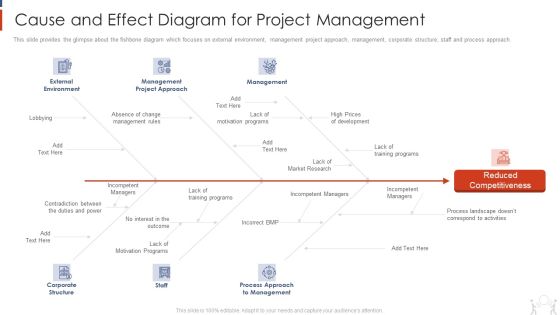
This slide provides the glimpse about the fishbone diagram which focuses on external environment, management project approach, management, corporate structure, staff and process approach.Introducing our well designed PMP Tools Cause And Effect Diagram For Project Management Introduction PDF set of slides. The slide displays editable icons to enhance your visual presentation. The icons can be edited easily. So customize according to your business to achieve a creative edge. Download and share it with your audience.
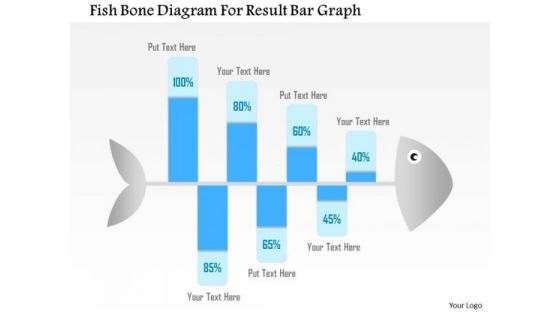
Business Diagram Fish Bone Diagram For Result Bar Graph Presentation Template
Graphic of fish bone has been used to design this Power Point template slide. This PPT slide contains the concept of problem analysis and root cause analysis. Use this PPT slide and display process of root cause analysis for any field. This PPT slide is very well designed for business and production related problem analysis.

Comprehensive Sports Event Marketing Plan Show Brands Support For Social Cause Diagrams PDF
This slide represents the details related to one of the strategies for effectively promoting sports events through social media platforms. It includes details related to overview, importance and impact of showing brands support for social cause. Slidegeeks is one of the best resources for PowerPoint templates. You can download easily and regulate Comprehensive Sports Event Marketing Plan Show Brands Support For Social Cause Diagrams PDF for your personal presentations from our wonderful collection. A few clicks is all it takes to discover and get the most relevant and appropriate templates. Use our Templates to add a unique zing and appeal to your presentation and meetings. All the slides are easy to edit and you can use them even for advertisement purposes.
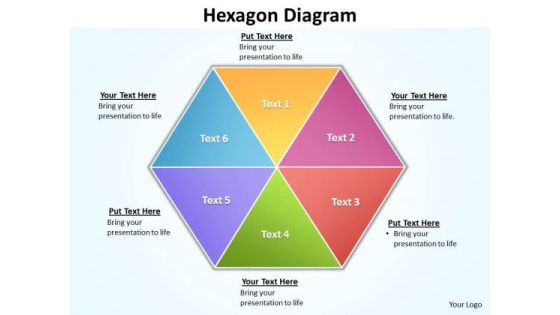
Ppt 6 Factors Hexagon Cause And Effect Diagram PowerPoint Template Editable Templates
PPT 6 factors hexagon cause and effect diagram powerpoint template editable Templates-This Business PowerPoint Diagram shows you the regular Hexagon describing six issues in one particular slide of Presentation. It symbolizes six-pointed star, Jewish star, Star of Bethlehem, stile, hexagon, hexagram and hexahedron.-PPT 6 factors hexagon cause and effect diagram powerpoint template editable Templates-Abstract, Background, Design, Digital, Elements, Graphic, Grey, Hexagon, Illustration, Light, Modern, Perspective, Triangles, Shapes, Shiny, Style, Technology, Template, Vector, Vertical, Virtual, Wallpaper, Web
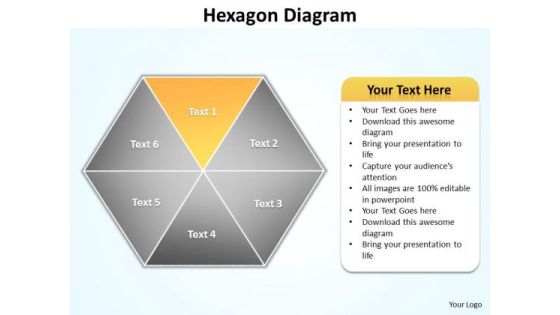
Ppt Yellow Factor Hexagon Cause And Effect Diagram PowerPoint Template Editable Templates
PPT yellow factor hexagon cause and effect diagram PowerPoint template editable Templates-Create visually stimulating Microsoft office PPT Presentations with our above Diagram. This image has been professionally designed to emphasize the concept of interrelated issues, Approaches or Methods. This Business Diagram can be used in Marketing, Banking, and Management etc. This Diagram explains the Yellow Component.-PPT yellow factor hexagon cause and effect diagram PowerPoint template editable Templates-attached, backgrounds, blue, cell, color, component, connect, connection, diagram, elements, geometric, graphic, group, hexagon, honeycomb, icon, illustration, intricacy, lines, link, map, mesh, model, network, science, shape, shiny, strategy, structure, symbol, teamwork, technology

Ppt Pink Factor Hexagon Cause And Effect Diagram PowerPoint Template Editable Templates
PPT pink factor hexagon cause and effect diagram PowerPoint template editable Templates-The Diagram offers an excellent background to build up the various stages of your business process. This PowerPoint Process Chart shows the seven Different Layers which are to be followed in any business. This Business Diagram can be used in Marketing, Banking, and Management etc. -PPT pink factor hexagon cause and effect diagram PowerPoint template editable Templates-attached, backgrounds, blue, cell, color, component, connect, connection, diagram, elements, geometric, graphic, group, hexagon, honeycomb, icon, illustration, intricacy, lines, link, map, mesh, model, network, science, shape, shiny, strategy, structure, symbol, teamwork, technology

Ppt Linear Abstraction Arrow Cause And Effect Diagram PowerPoint Template Templates
PPT linear abstraction arrow cause and effect diagram powerpoint template Templates-Use this linear diagram to emphasize the process of your business and corporate growth. Highlight your ideas broad based on strong fundamentals and illustrate how they step by step achieve the set growth factor.-PPT linear abstraction arrow cause and effect diagram powerpoint template Templates-analysis, arrow, background, business, chart, communication, concept, construction, delivery, design, development, engineering, fabrication, feasibiliti, generated, growth, idea, industry, making, production, products, science, sequence, shape
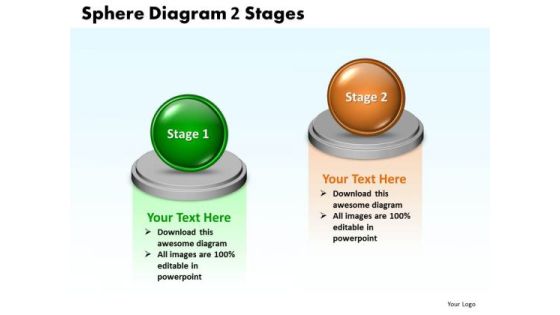
Ppt Sphere Cause And Effect Diagram PowerPoint Template 2 State Templates
PPT sphere cause and effect diagram powerpoint template 2 state Templates-This PPT slide can be used to compare two approaches and evaluate the effectiveness. You can easily insert text to this slide as per your requirement.-PPT sphere cause and effect diagram powerpoint template 2 state Templates-Around, Background, Ball, Big, Blue, Business, Circle, Competition, Competitive, Concept, Contrast, Design, Development, Diagram, Group, Icon, Illustration, Individual, Individuality, Isolated, Leadership, Partnership, Ring, Shapes, Sign, Sphere, Success, Symbol, Team, Teamwork, Wheel
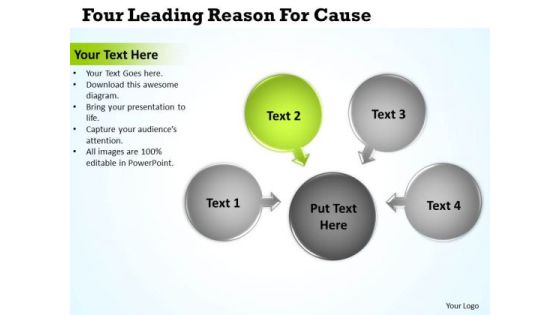
Four Leading Reason For Cause Circular Flow Motion Process PowerPoint Templates
We present our four leading reason for cause Circular Flow Motion Process PowerPoint templates.Download our Marketing PowerPoint Templates because this shows plans to increase the strength of your business relationships. Use our Business PowerPoint Templates because the majestic tiger lord of all it surveys.It exudes power even when it is in repose. Download our Arrows PowerPoint Templates because You have found the one missing link in the picture. That one strand that will bring together the entire edifice. Put it out there for all to see. Emphasise the value of its contribution in propelling the venture forward. Present our Circle Charts PowerPoint Templates because the Venn graphic comprising interlinking circles geometrically demonstate how various functions operating independantly, to a large extent, are essentially interdependant. Download and present our Shapes PowerPoint Templates because they are Gauranteed to focus the minds of your team.Use these PowerPoint slides for presentations relating to 3d, Abstract, Arrow, Background, Blue, Business, Circle, Concept, Connect, Connection, Design, Direction, Element, Group, Icon, Illustration, Internet, Link, Orientation, Pointer, Round, Shape. The prominent colors used in the PowerPoint template are Green, Gray, Black. Customers tell us our four leading reason for cause Circular Flow Motion Process PowerPoint templates are Ultra. Customers tell us our Connect PowerPoint templates and PPT Slides are Enchanting. Presenters tell us our four leading reason for cause Circular Flow Motion Process PowerPoint templates are Dynamic. PowerPoint presentation experts tell us our Concept PowerPoint templates and PPT Slides are Pretty. Customers tell us our four leading reason for cause Circular Flow Motion Process PowerPoint templates are specially created by a professional team with vast experience. They diligently strive to come up with the right vehicle for your brilliant Ideas. Professionals tell us our Concept PowerPoint templates and PPT Slides are Exuberant.
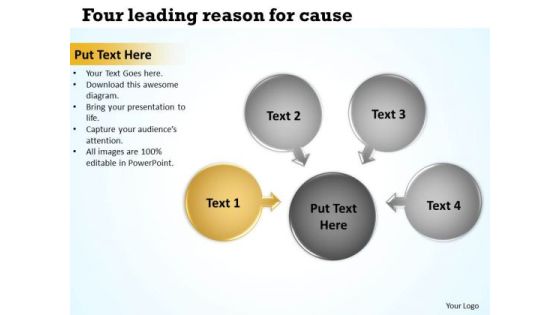
Four Leading Reason For Cause Ppt Circular Flow Motion Process PowerPoint Templates
We present our four leading reason for cause ppt Circular Flow Motion Process PowerPoint templates.Present our Marketing PowerPoint Templates because You can Channelise the thoughts of your team with our PowerPoint Templates and Slides. Urge them to focus on the goals you have set. Download and present our Business PowerPoint Templates because you have had your share of being a goldfish in a small bowl.you are ready to launch out and spread your wings. Download and present our Arrows PowerPoint Templates because they highlight the depth of your thought process. Present our Circle Charts PowerPoint Templates because Our PowerPoint Templates and Slides are Clear and concise. Use them and dispel any doubts your team may have. Use our Shapes PowerPoint Templates because you can Help your viewers automatically emphathise with your thoughts.Use these PowerPoint slides for presentations relating to 3d, Abstract, Arrow, Background, Blue, Business, Circle, Concept, Connect, Connection, Design, Direction, Element, Group, Icon, Illustration, Internet, Link, Orientation, Pointer, Round, Shape. The prominent colors used in the PowerPoint template are Yellow, Gray, Black. Customers tell us our four leading reason for cause ppt Circular Flow Motion Process PowerPoint templates provide great value for your money. Be assured of finding the best projection to highlight your words. Customers tell us our Blue PowerPoint templates and PPT Slides are designed by a team of presentation professionals. Presenters tell us our four leading reason for cause ppt Circular Flow Motion Process PowerPoint templates are Efficacious. PowerPoint presentation experts tell us our Circle PowerPoint templates and PPT Slides are Beautiful. Customers tell us our four leading reason for cause ppt Circular Flow Motion Process PowerPoint templates are Whimsical. Professionals tell us our Connect PowerPoint templates and PPT Slides are One-of-a-kind.
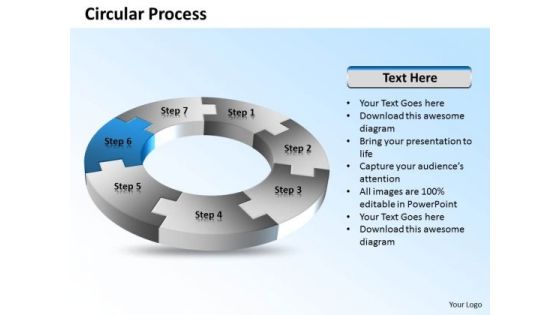
Ppt 7 Stages Circular Process Flow Cause And Effect Diagram PowerPoint Template Templates
PPT 7 stages circular process flow cause and effect diagram powerpoint template Templates-This diagram can use to examine all of business activities, and see how they're connected. This image has been conceived to enable you to emphatically communicate your ideas that can help you understand the sources of value for your organization. Add charm and personality to your presentations with our stunning high quality PowerPoint Template.-PPT 7 stages circular process flow cause and effect diagram powerpoint template Templates-Arrows, Background, Business, Chart, Circle, Circular, Financial, Flow, Graphic, Gray, Icon, Illustration, Isometric, Perspective, Process, Recycle, Round, Shape, Flow, Marketing, Leadership, Steps
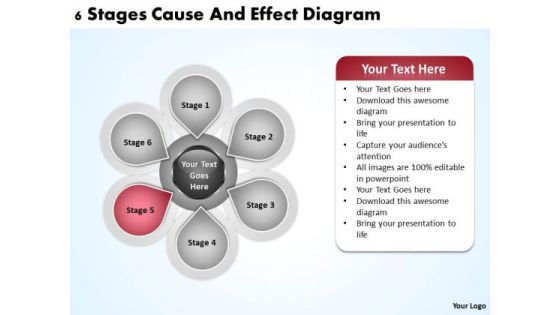
Business Process Diagram Vision 6 Stages Cause And Effect Ppt PowerPoint Templates
We present our business process diagram vision 6 stages cause and effect ppt PowerPoint templates.Download and present our Advertising PowerPoint Templates because You are well armed with penetrative ideas. Our PowerPoint Templates and Slides will provide the gunpowder you need. Use our Arrows PowerPoint Templates because You can Be the star of the show with our PowerPoint Templates and Slides. Rock the stage with your ideas. Download our Circle Charts PowerPoint Templates because You can Hit a home run with our PowerPoint Templates and Slides. See your ideas sail into the minds of your audience. Download our Business PowerPoint Templates because It will get your audience in sync. Download and present our Shapes PowerPoint Templates because Our PowerPoint Templates and Slides will definately Enhance the stature of your presentation. Adorn the beauty of your thoughts with their colourful backgrounds.Use these PowerPoint slides for presentations relating to Arrow, box, brochure, business, button, catalog, chart, circle, company, cross, data, design, diagram, direction, document, financial, glossy, goals, graph, junction, management, market, marketing, model, multiple, navigation, network, options, pie, plan, presentation, process, results, shiny, six, sphere, statistics, stock, structure, template, vector, website. The prominent colors used in the PowerPoint template are Blue, Gray, Black.
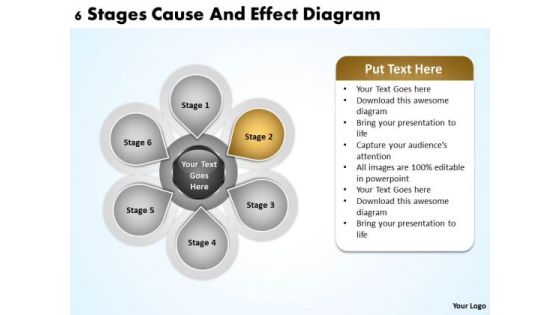
Business Process Flow Chart Examples 6 Stages Cause And Effect Diagram Ppt PowerPoint Slides
We present our business process flow chart examples 6 stages cause and effect diagram ppt PowerPoint Slides.Use our Marketing PowerPoint Templates because Our PowerPoint Templates and Slides are designed to help you succeed. They have all the ingredients you need. Present our Business PowerPoint Templates because Our PowerPoint Templates and Slides will embellish your thoughts. See them provide the desired motivation to your team. Download our Shapes PowerPoint Templates because Your audience will believe you are the cats whiskers. Download our Circle Charts PowerPoint Templates because Our PowerPoint Templates and Slides will bullet point your ideas. See them fall into place one by one. Use our Signs PowerPoint Templates because Our PowerPoint Templates and Slides will generate and maintain the level of interest you desire. They will create the impression you want to imprint on your audience.Use these PowerPoint slides for presentations relating to Brochure, business, button, catalog, chart, circle, company, cross, data, design, diagram, direction, document, financial, glossy, goals, graph, junction, management, market, marketing, model, multiple, navigation, network, options, pie, plan, presentation, process, results, shiny, six, sphere, statistics, stock, structure, template, vector, website. The prominent colors used in the PowerPoint template are Yellow, Gray, Black.
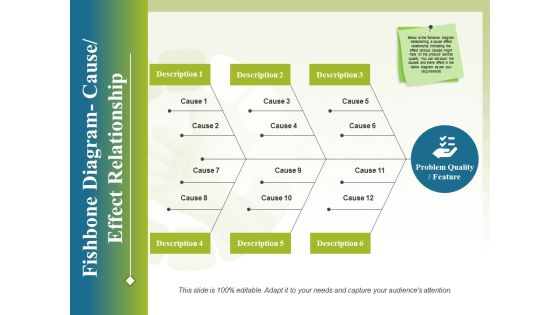
Fishbone Diagram Cause Effect Relationship Ppt PowerPoint Presentation Styles Design Inspiration
This is a fishbone diagram cause effect relationship ppt powerpoint presentation styles design inspiration. This is a three stage process. The stages in this process are business, process, analysis, strategy, management.

Business Operation Modeling Approaches Cause And Effect Diagram For Project Management Clipart PDF
This slide provides the glimpse about the fishbone diagram which focuses on external environment, management project approach, management, corporate structure, staff and process approach.Deliver an awe inspiring pitch with this creative business operation modeling approaches cause and effect diagram for project management clipart pdf bundle. Topics like external environment, management project approach, corporate structure can be discussed with this completely editable template. It is available for immediate download depending on the needs and requirements of the user.
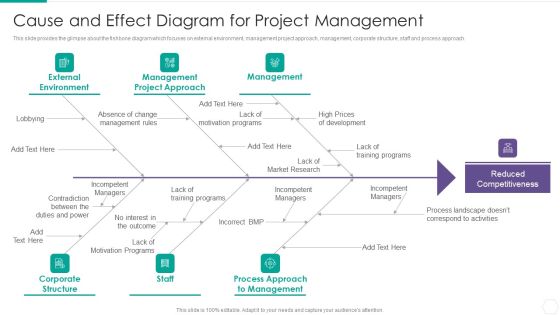
Quantitative Risk Assessment Cause And Effect Diagram For Project Management Rules PDF
This slide provides the glimpse about the fishbone diagram which focuses on external environment, management project approach, management, corporate structure, staff and process approach. This is a Quantitative Risk Assessment Cause And Effect Diagram For Project Management Rules PDF template with various stages. Focus and dispense information on six stages using this creative set, that comes with editable features. It contains large content boxes to add your information on topics like Management, External Environment, Corporate Structure, Market. You can also showcase facts, figures, and other relevant content using this PPT layout. Grab it now.
Project Management Modelling Techniques IT Cause And Effect Diagram For Project Management Information PDF
This slide provides the glimpse about the fishbone diagram which focuses on external environment, management project approach, management, corporate structure, staff and process approach. This is a project management modelling techniques it cause and effect diagram for project management information pdf template with various stages. Focus and dispense information on six stages using this creative set, that comes with editable features. It contains large content boxes to add your information on topics like external environment, management project approach, management, corporate structure, staff. You can also showcase facts, figures, and other relevant content using this PPT layout. Grab it now.

 Home
Home