Risk Table
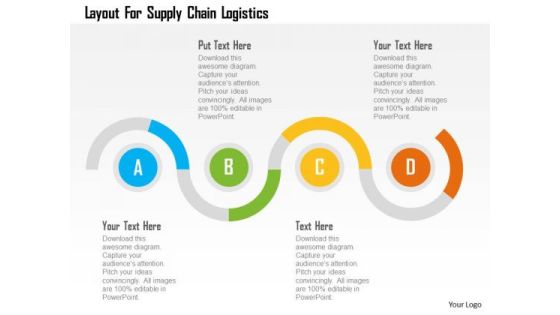
Business Diagram Layout For Supply Chain Logistics Presentation Template
This slide illustrates diagram of zigzag graphics. You may use it to represent concept of supply chain logistics. This diagram is suitable to display business information and also helps to keep your audience interested till the end of your presentation.

Lead Scoring Chart Powerpoint Slide Background
This is a lead scoring chart powerpoint slide background. This is a six stage process. The stages in this process are measurable roi on lead generation program, increased conversion rates from qualified lead to opportunity, increased sales productivity and effectiveness, shortened sales cycle, better forecast and pipeline visibility, better alignment of marketing and sales efforts.

Budget And Financial Snapshot Ppt PowerPoint Presentation Example
This is a budget and financial snapshot ppt powerpoint presentation example. This is a two stage process. The stages in this process are sales, operating income, net income.

Case Study Puzzle Matrix Ppt PowerPoint Presentation Templates
This is a case study puzzle matrix ppt powerpoint presentation templates. This is a four stage process. The stages in this process are puzzle, case study, matrix, puzzle matrix.

Magnifying Glass For Business Research Ppt PowerPoint Presentation Styles
This is a magnifying glass for business research ppt powerpoint presentation styles. This is a five stage process. The stages in this process are gears, technology, icons, search, magnify.
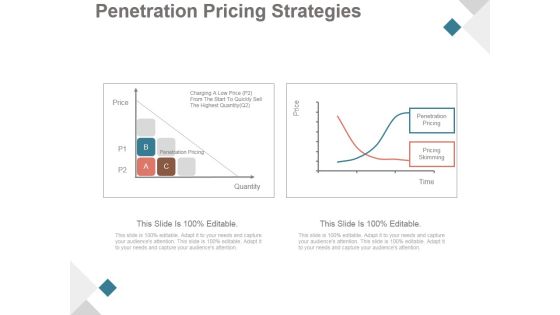
Penetration Pricing Strategies Ppt PowerPoint Presentation Slide
This is a penetration pricing strategies ppt powerpoint presentation slide. This is a two stage process. The stages in this process are penetration pricing, pricing skimming, quantity, price.

Big Data Analytics Process Flow Ppt PowerPoint Presentation Diagrams
This is a big data analytics process flow ppt powerpoint presentation diagrams. This is a four stage process. The stages in this process are data, decision, insight, info.

Five Stages For Achieving Business Success Ppt PowerPoint Presentation Pictures
This is a five stages for achieving business success ppt powerpoint presentation pictures. This is a five stage process. The stages in this process are business, marketing, success, winner, presentation.

Campaign Performance Ppt PowerPoint Presentation Show
This is a campaign performance ppt powerpoint presentation show. This is a four stage process. The stages in this process are brand, leads, sales, loyalty.
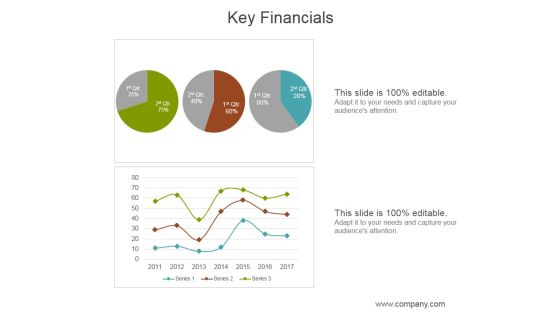
Key Financials Ppt PowerPoint Presentation Ideas
This is a key financials ppt powerpoint presentation ideas. This is a three stage process. The stages in this process are business, marketing, planning, financials, management.
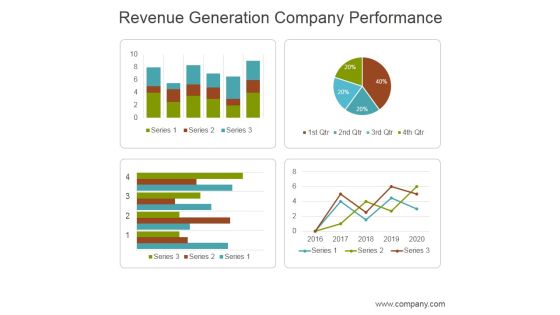
Revenue Generation Company Performance Ppt PowerPoint Presentation Layouts
This is a revenue generation company performance ppt powerpoint presentation layouts. This is a four stage process. The stages in this process are business, marketing, management, revenue, performance.
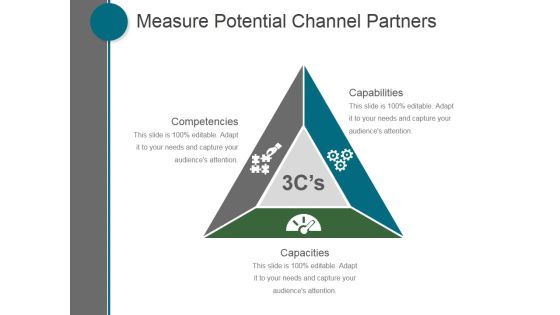
Measure Potential Channel Partners Template Ppt PowerPoint Presentation Show
This is a measure potential channel partners template ppt powerpoint presentation show. This is a three stage process. The stages in this process are capabilities, capacities, competencies.

Business Model Template 2 Ppt PowerPoint Presentation Ideas
This is a business model template 2 ppt powerpoint presentation ideas. This is a three stage process. The stages in this process are business, marketing, management, finance, planning.
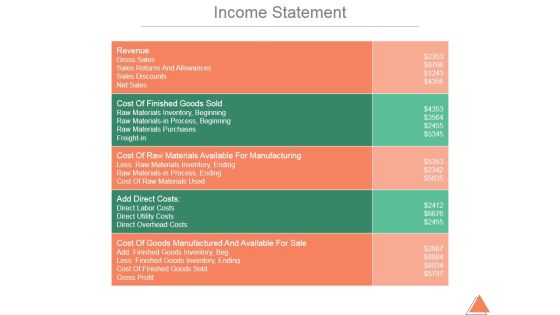
Income Statement Ppt PowerPoint Presentation Background Images
This is a income statement ppt powerpoint presentation background images. This is a five stage process. The stages in this process are revenue, gross sales, sales returns and allowances, sales discounts, net sales.
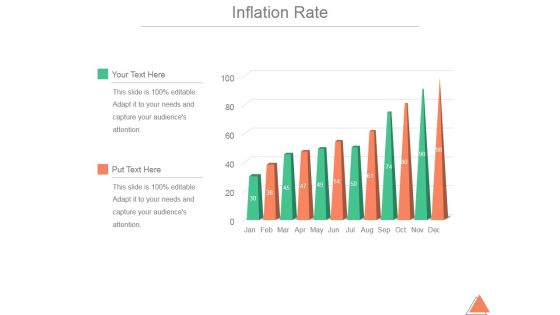
Inflation Rate Template 1 Ppt PowerPoint Presentation Influencers
This is a inflation rate template 1 ppt powerpoint presentation influencers. This is a twelve stage process. The stages in this process are business, marketing, growth, management, inflation rate.
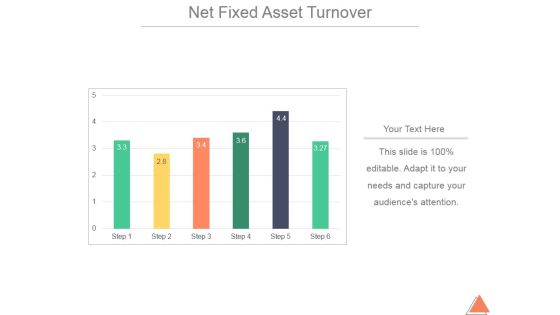
Net Fixed Asset Turnover Ppt PowerPoint Presentation Slide Download
This is a net fixed asset turnover ppt powerpoint presentation slide download. This is a one stage process. The stages in this process are business, marketing, finance, management, planning.

Key Driver Analytics Ppt PowerPoint Presentation Visuals
This is a key driver analytics ppt powerpoint presentation visuals. This is a four stage process. The stages in this process are icons, management, currency, technology, business.
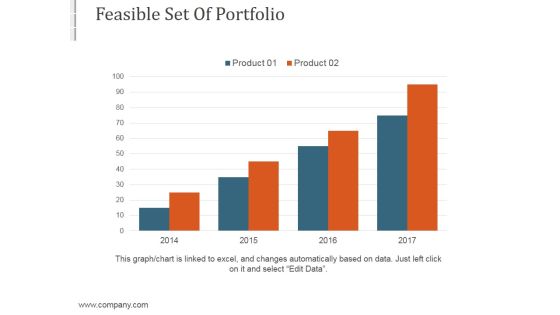
Feasible Set Of Portfolio Ppt PowerPoint Presentation Background Designs
This is a feasible set of portfolio ppt powerpoint presentation background designs. This is a four stage process. The stages in this process are business, marketing, strategy, success, finance.
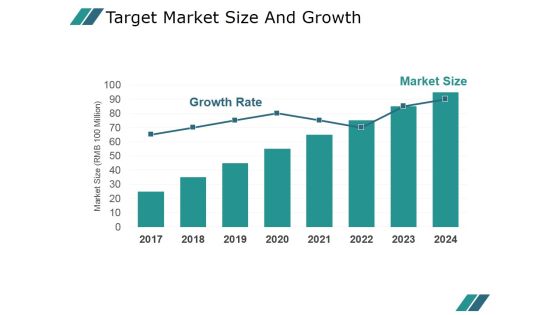
Target Market Size And Growth Template 2 Ppt PowerPoint Presentation Slides
This is a target market size and growth template 2 ppt powerpoint presentation slides. This is a eight stage process. The stages in this process are business, marketing, management, growth rate, finance.
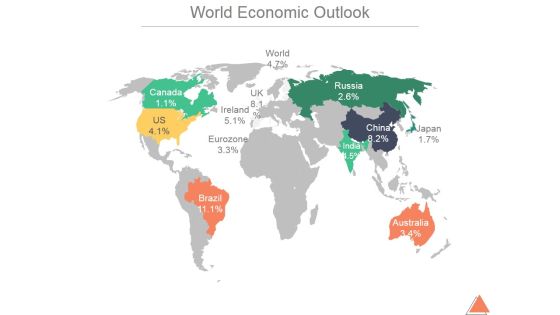
World Economic Outlook Ppt PowerPoint Presentation Background Image
This is a world economic outlook ppt powerpoint presentation background image. This is a twelve stage process. The stages in this process are business, marketing, management, location, outlook.

World Sector Growth Ppt PowerPoint Presentation Sample
This is a world sector growth ppt powerpoint presentation sample. This is a four stage process. The stages in this process are business, marketing, management, growth, finance.

Area Ppt PowerPoint Presentation Themes
This is a area ppt powerpoint presentation themes. This is a two stage process. The stages in this process are area chart, management, growth, strategy, business.

Benefits Of Big Data Ppt PowerPoint Presentation Inspiration
This is a benefits of big data ppt powerpoint presentation inspiration. This is a four stage process. The stages in this process are increased efficiency, better business decision making, improved customer experience and engagement, achieved financial savings.

Financial Strength Ppt PowerPoint Presentation Shapes
This is a financial strength ppt powerpoint presentation shapes. This is a four stage process. The stages in this process are business, marketing, success, business plan, bar graph.
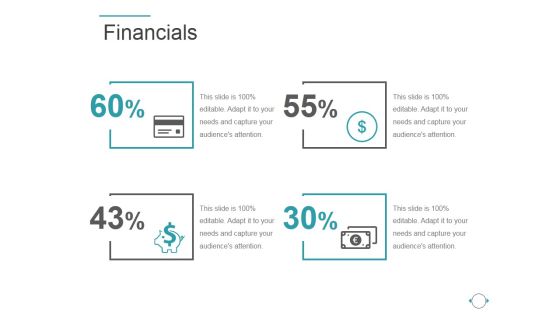
Financials Ppt PowerPoint Presentation Clipart
This is a financials ppt powerpoint presentation clipart. This is a four stage process. The stages in this process are icons, percentage, finance, success, strategy.
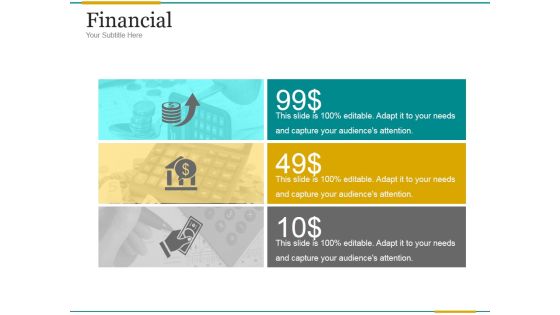
Financial Ppt PowerPoint Presentation Designs Download
This is a financial ppt powerpoint presentation designs download. This is a three stage process. The stages in this process are business, finances, success, strategy, management.

Market Research Findings Template 1 Ppt PowerPoint Presentation Backgrounds
This is a market research findings template 1 ppt powerpoint presentation backgrounds. This is a five stage process. The stages in this process are occassionals, talkers, pragmatists, personals, tribals, prodigies, the always on consumer segments.
Product Launch Budget Plan Ppt PowerPoint Presentation Icon
This is a product launch budget plan ppt powerpoint presentation icon. This is a ten stage process. The stages in this process are software and internet, aerospace and defense, healthcare, consumer, chemicals and energy, industrials, telecom .

Crm Marketing Dashboard Ppt PowerPoint Presentation Designs
This is a crm marketing dashboard ppt powerpoint presentation designs. This is a two stage process. The stages in this process are leads per week, leads this week target.

Crm Sales Rep Dashboard Ppt PowerPoint Presentation Influencers
This is a crm sales rep dashboard ppt powerpoint presentation influencers. This is a three stage process. The stages in this process are opp duration by pipeline, actual vs goal, opportunities est close next 25 days.

Brand Performance Dashboard Template 1 Ppt PowerPoint Presentation Microsoft
This is a brand performance dashboard template 1 ppt powerpoint presentation microsoft. This is a two stage process. The stages in this process are business, brand, performance, dashboard, marketing.

Competitor Positioning Ppt PowerPoint Presentation Layouts Templates
This is a competitor positioning ppt powerpoint presentation layouts templates. This is a two stage process. The stages in this process are gaining market share, losing market share, average market growth.

Customer Traction Ppt PowerPoint Presentation Outline Show
This is a customer traction ppt powerpoint presentation outline show. This is a four stage process. The stages in this process are business, marketing, management, success, presentation.

Marketing Dashboard Ppt PowerPoint Presentation Visual Aids Example 2015
This is a marketing dashboard ppt powerpoint presentation visual aids example 2015. This is a two stage process. The stages in this process are marketing, dashboard, funnel, business, process.

Revenue Model Ppt PowerPoint Presentation Slides Format
This is a revenue model ppt powerpoint presentation slides format. This is a five stage process. The stages in this process are business, financials, currency, growth, marketing.
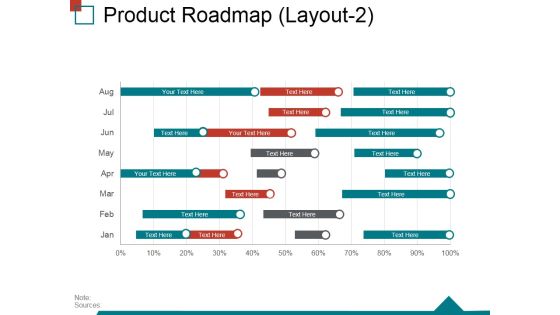
Product Roadmap Layout2 Ppt PowerPoint Presentation Gallery Template
This is a product roadmap layout2 ppt powerpoint presentation gallery template. This is a nine stage process. The stages in this process are product roadmap, business, marketing, management.

Revenue Per Employee Ppt PowerPoint Presentation Show Objects
This is a revenue per employee ppt powerpoint presentation show objects. This is a eight stage process. The stages in this process are annual revenue per employee, company revenue, revenue, success.

Bar Graph Ppt PowerPoint Presentation Layouts Pictures
This is a bar graph ppt powerpoint presentation layouts pictures. This is a four stage process. The stages in this process are fire, earthquake, axis title, in percentage.
Setting A Budget Ppt PowerPoint Presentation Outline Pictures
This is a setting a budget ppt powerpoint presentation outline pictures. This is a two stage process. The stages in this process are setting a budget, opperchunity, success, strategy, marketing.
Email Marketing Report Ppt PowerPoint Presentation Icon Graphics Tutorials
This is a email marketing report ppt powerpoint presentation icon graphics tutorials. This is a two stage process. The stages in this process are opens, bounces, unopened, click rate.

Print Media Publication Report Ppt PowerPoint Presentation Slides Files
This is a print media publication report ppt powerpoint presentation slides files. This is a four stage process. The stages in this process are the new york times, the washington post, the wall street journal.

Product Wise Performance Ppt PowerPoint Presentation Visual Aids Outline
This is a product wise performance ppt powerpoint presentation visual aids outline. This is a two stage process. The stages in this process are product wise performance, business, marketing, success.
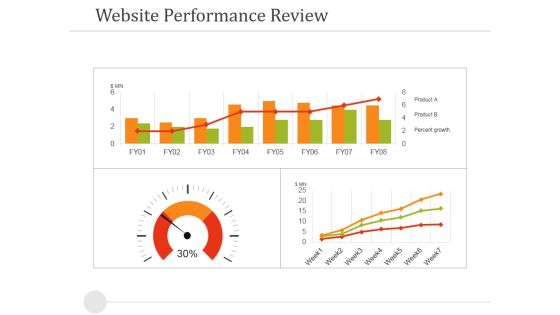
Website Performance Review Template 1 Ppt PowerPoint Presentation Portfolio Guide
This is a website performance review template 1 ppt powerpoint presentation portfolio guide. This is a four stage process. The stages in this process are website performance review, dashboard, business, marketing, finance.

Website Performance Review Template 2 Ppt PowerPoint Presentation Gallery Objects
This is a website performance review template 2 ppt powerpoint presentation gallery objects. This is a three stage process. The stages in this process are margin, revenue, expense, support, other operational.

Organic Visits And Backlinks Ppt PowerPoint Presentation Styles Microsoft
This is a organic visits and backlinks ppt powerpoint presentation styles microsoft. This is a two stage process. The stages in this process are deviation, planned costs vs actual costs.

Area Chart Ppt PowerPoint Presentation Pictures Rules
This is a area chart ppt powerpoint presentation pictures rules. This is a two stage process. The stages in this process are area chart, business, marketing, strategy, success.

Bar Chart Ppt PowerPoint Presentation Infographics Designs Download
This is a bar chart ppt powerpoint presentation infographics designs download. This is a twelve stage process. The stages in this process are bar chart, business, marketing, strategy, success.

Combo Chart Ppt PowerPoint Presentation Portfolio Infographics
This is a combo chart ppt powerpoint presentation portfolio infographics. This is a eight stage process. The stages in this process are market size, growth, years, finance, business.

Crm Dashboard Kpis Ppt PowerPoint Presentation Infographic Template Designs
This is a crm dashboard kpis ppt powerpoint presentation infographic template designs. This is a three stage process. The stages in this process are active subscribers, acquisition, revenue.

Crm Dashboard Sales Dashboard Template Ppt PowerPoint Presentation Professional Layout
This is a crm dashboard sales dashboard template ppt powerpoint presentation professional layout. This is a four stage process. The stages in this process are lead owner breakdown, sales by product march 2017, total lead ownership, month over month closing trend.

Crm Dashboard Top Customers Ppt PowerPoint Presentation Infographics Format
This is a crm dashboard top customers ppt powerpoint presentation infographics format. This is a ten stage process. The stages in this process are top customers, people, management, business, marketing.

Crm Marketing Dashboard Ppt PowerPoint Presentation Icon Graphic Tips
This is a crm marketing dashboard ppt powerpoint presentation icon graphic tips. This is a two stage process. The stages in this process are leads per week, leads this week.

Crm Rep Dashboard Ppt PowerPoint Presentation Styles Objects
This is a crm rep dashboard ppt powerpoint presentation styles objects. This is a three stage process. The stages in this process are negotiation, proposal, develop, qualification, identity.
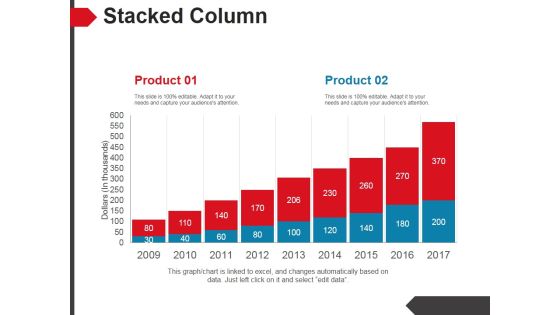
Stacked Column Ppt PowerPoint Presentation Example
This is a stacked column ppt powerpoint presentation example. This is a two stage process. The stages in this process are product, stacked column, business, marketing, strategy, success.
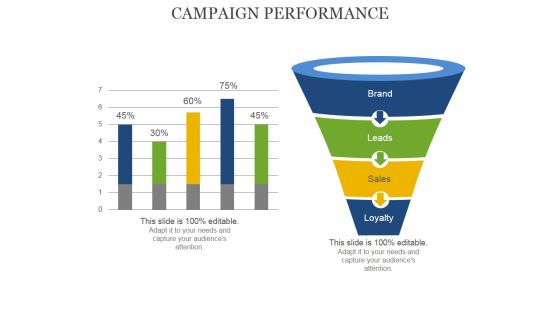
Campaign Performance Ppt PowerPoint Presentation Inspiration Vector
This is a campaign performance ppt powerpoint presentation inspiration vector. This is a two stage process. The stages in this process are loyalty, sales, leads, brand.

Bar Graph For Business Growth Powerpoint Templates
This PowerPoint slide contains graphics bar chart. This slide helps to exhibit business growth analysis. Sparkling thoughts are swirling around in your head. Filter them through with this diagram slide.

Show Your Skills For Success PowerPoint Templates Ppt Backgrounds For Slides 0613
Light The Fuse With Our Gear wheels Powerpoint Templates. Blast The Audience With The Force Of Your Ideas. In Depth Analysis Of Situations Is Your Forte. Use Our People Powerpoint Templates To Acquaint Your Listeners With Your Results.

Take The Right Pills For Disease PowerPoint Templates Ppt Backgrounds For Slides 0613
Light The Fuse With Our Medical Powerpoint Templates. Blast The Audience With The Force Of Your Ideas. In Depth Analysis Of Situations Is Your Forte. Use Our Business Powerpoint Templates To Acquaint Your Listeners With Your Results.
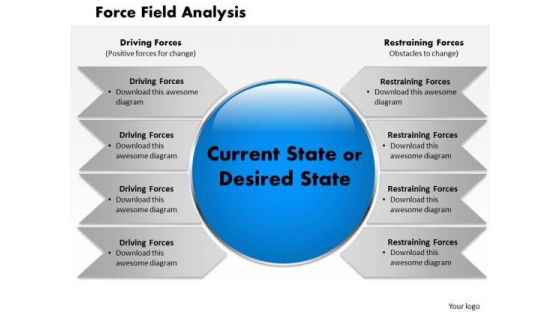
Force Field Anaysis PowerPoint Presentation Template
Good Camaraderie Is A Key To Teamwork. Our Force Field Analysis PowerPoint Presentation Template Powerpoint Templates Can Be A Cementing Force. Our Business Charts Powerpoint Templates Are An Agent Of Change. Let Your Thoughts Go Down Uncharted Courses.

Stock Photo Black Brown Pie Chart For Business Result PowerPoint Slide
This high quality image is designed with pie chart. Use this image to make business reports. Use this outstanding image in presentations relating to data analysis and reports. Go ahead and add charm to your presentations.
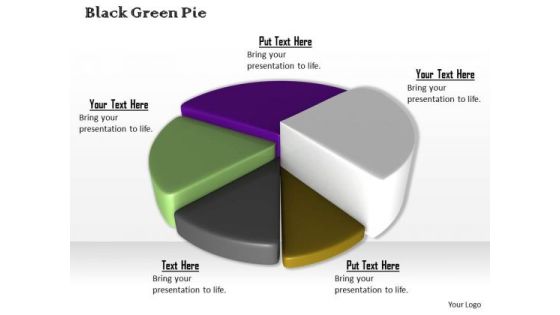
Stock Photo Colorful 3d Pie Chart For Business Result PowerPoint Slide
This high quality image is designed with pie chart. Use this image to make business reports. Use this outstanding image in presentations relating to data analysis and reports. Go ahead and add charm to your presentations.
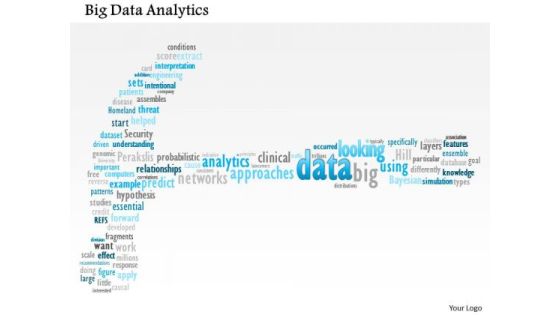
Business Framework Big Data Analytics PowerPoint Presentation
This unique power point diagram slide has been crafted with big data analytics. This data analytics is used to improve predictions and support decision making. Use this image slide for big data analysis related presentations.
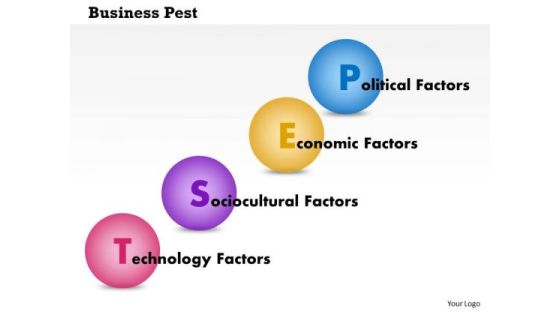
Business Framework Business Pest PowerPoint Presentation
Display social ,economic, social and technological status of any company with our PEST business framework Power Point slide. This PPTslide has been crafted with sequential order of PEST analysis. Use this PPT slide and get good comments on your efforts.

Business Framework Creating Value Proposition PowerPoint Presentation
This innovative image slide has been designed to display product value propositions. This business framework template may be used in your presentations to display research and analysis in marketing. This image slide will enhance the quality of your presentations.

Business Framework Creative Funnel Diagram PowerPoint Presentation
This innovative image slide has been designed with graphic of business strategies in funnel. This business framework template may be used in your presentations to display business strategy analysis. This image slide will enhance the quality of your presentations.
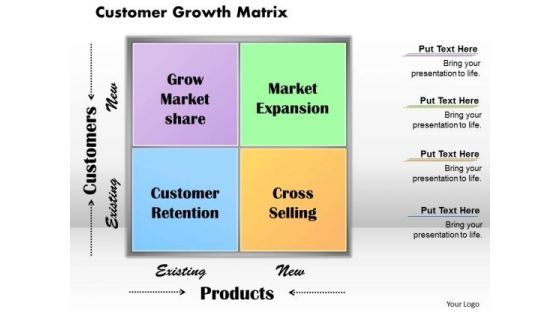
Business Framework Customer Growth Matrix PowerPoint Presentation
This innovative image slide has been designed to display marketing growth matrix. This business framework template may be used in your presentations to depict business marketing research analysis. This image slide will enhance the quality of your presentations.

Business Framework Porters Diamond PowerPoint Presentation
This business framework image slide displays Porter's analysis diamond model template. Use this image slide, in your presentations to depicts theory of why particular industries become competitive in particular locations. This image slide will enhance the quality of your presentations.

Business Diagram Kaizen Event Process PowerPoint Ppt Presentation
This business slide displays framework of kaizen event process. It contains graphics of arrow with five points depicting plan process, train process walk, root cause analysis, improve process and sustain process. Download this diagram as a tool for business presentations.

Business Diagram Percentage Pie Chart On Computer Tablet Presentation Slide Template
This business diagram power point template has been designed with graphic of pie chart. This pie chart contains the various percentage values for business result analysis. Use this pie chart for your business result display related presentations.
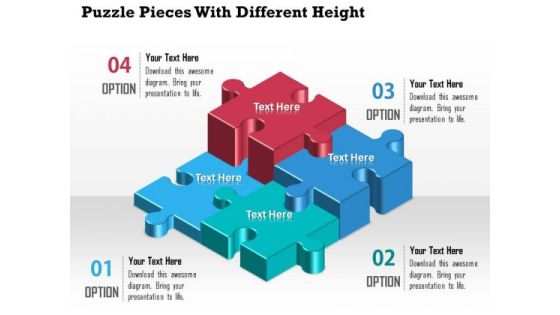
Business Diagram Puzzle Pieces With Different Height Presentation Template
A professional bar graph has been crafted with graphic of puzzles. All these puzzles are in different heights which shows the various levels of any data result representations. Use this diagram for your business result and data analysis related topics.
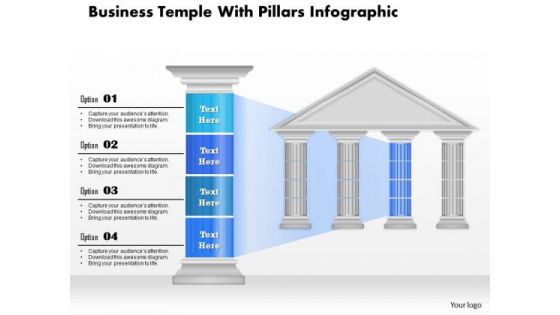
Business Diagram Business Temple With Pillars Infographic Presentation Template
This business power point template has been designed with business temple graphic. This image slide contains the concept of marketing strategies and business plan analysis. Highlight your business plans in any presentations with this exclusive temple design.

Business Diagram Business Temple With Text Blue Pillar Presentation Template
This business plan power point template has been designed with business temple graphic. This image slide contains the concept of marketing strategies and business plan analysis. Highlight your plans in any business presentations with this unique design.
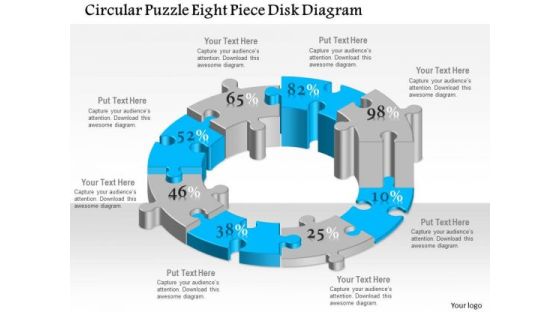
Business Diagram Circular Puzzle Eight Piece Disk Diagram Presentation Template
This business plan power point template has been designed with six staged circular puzzle diagram. This diagram template contains the concept of business process flow and result analysis representation. Use this diagram in your presentation and show these concepts.

Business Diagram Pie Chart Octagon Shape Presentation Template
This business plan power point template has been designed with pie chart in octagon shape. This PPT contains the concept of result analysis for any business process. Use this PPT for business and sales related presentations.

Business Diagram Process Pyramids Bar Chart Business Slide Presentation Template
Graphic of pyramid and bar chart has been used to design this power point template diagram. This PPT diagram contains the concept of business result analysis and process flow. Use this template slide and display result in your presentations.

Business Framework Business Brand Anchor PowerPoint Presentation
Explain the concept of new idea generation with this exclusive PPT slide. This PPT contain the graphic of two bulbs making a Venn diagram. This PPT can be used for any business presentation to representation result analysis.
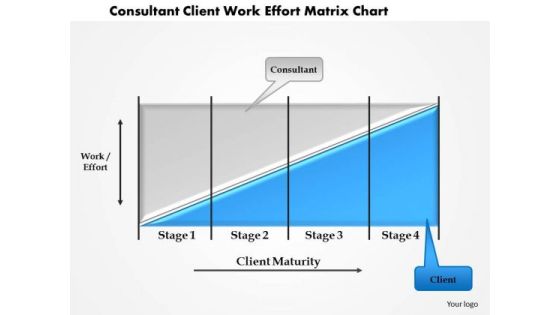
Business Framework Consultant Client Work Effort Matrix Chart PowerPoint Presentation
This business power point template slide has been crafted with graphic of bar graph. This bar graph is called as coase theorem. Use this professional diagram for your result analysis related presentation.

Business Framework Cyclical Placement Style For Strategy Map PowerPoint Presentation
A balancing scale style diagram has been used to design this PPT slide. This PPT slide contains the concept of cost benefit analysis. This PPT slide can be used for finance and money related topics in any presentation.
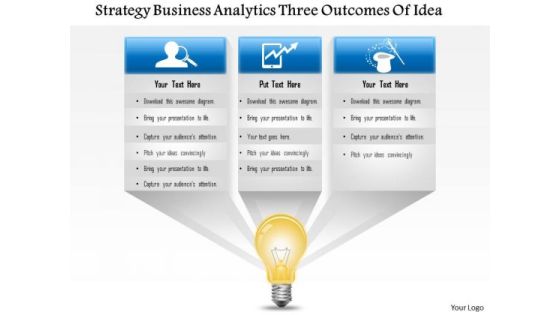
Business Framework Strategy Business Analytics 3 Outcomes Of Idea PowerPoint Presentation
A bulb with three text boxes has been used to design this PPT slide. This PPT slide contains the three outcomes for business analysis. Use this PPT slide for business presentations.
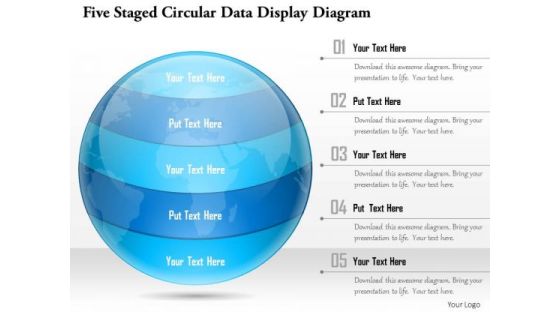
Business Diagram Five Staged Circular Data Display Diagram Presentation Template
This Power Point template slide has been crafted with graphic of five staged circular diagram. This PPT slide contains the concept of data analysis and representation. This PPT slide can be used for business data presentations.
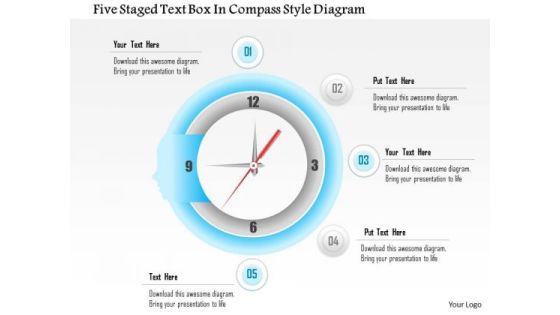
Business Diagram Five Staged Text Box In Compass Style Diagram Presentation Template
This Power Point template slide has been designed with graphic of five staged text boxes. This PPT slide contains the compass style diagram. This PPT slide can display data analysis. Use this PPT slide for your business presentations.

Business Diagram Four Staged Business Text Boxes For Data Representation Presentation Template
Four staged business text boxes are used to design this Power Point template slide. This PPT slide contains the concept of data representation. Use this PPT slide for your business and sales data analysis related topics in any presentation.
Business Diagram Four Staged Vertical Text Box Diagram Presentation Template
This PPT slide contains the concept of business data analysis. This Power Point template slide has been designed with graphic of four staged vertical text boxes diagram. Use this PPT slide and build an innovative presentation for your viewers.
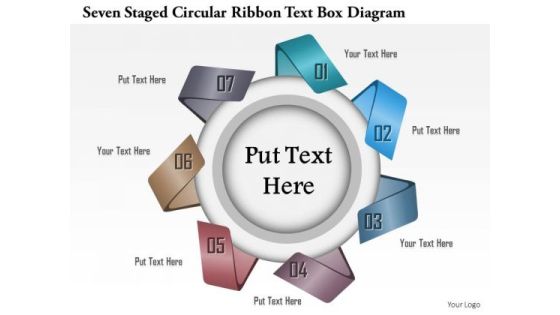
Business Diagram Seven Staged Circular Ribbon Text Box Diagram Presentation Template
This Power Point template slide has been used to display the concept of business data analysis. This PPT slide contains the graphic of seven staged circular ribbon style text boxes. Use this PPT slide for your business presentations.

Business Diagram Six Pie Charts For Result Representation And Percentage Presentation Template
Display the concept of result analysis in your business presentation. This PPT slide contains the graphic of six pie charts. Use this PPT slide for your business and marketing data related presentations.
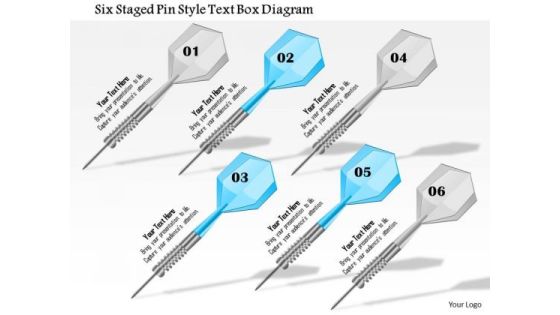
Business Diagram Six Staged Pin Style Text Box Diagram Presentation Template
This Power Point template slide has been crafted with graphic of six staged pin style text boxes. This PPT slide contain the concept of sales data analysis. Use this PPT slide for your business and sales related presentations.
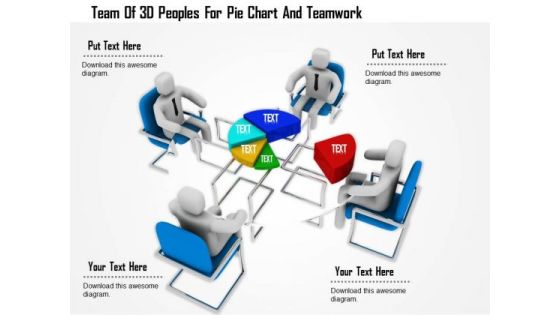
Team Of 3d Peoples For Pie Chart And Teamwork
This Power Point template has been designed with graphic of 3d team forming a pie chart. In this slide team is displaying data analysis. Use this editable slide to build innovative presentation for your viewers.

Team With Bar Graph And Teamwork
This Power Point template has been designed with graphic of 3d team forming a pie chart. In this slide team is displaying data analysis and comparison. Use this editable slide to build innovative presentation for your viewers.

Stock Photo Golden Dollar Symbol With Pie Graph PowerPoint Slide
This Power Point template has been crafted with graphic of golden dollar symbol and pie chart on a tablet. Display the concept of financial data analysis with this image. Use this image to present financial reports in business presentations.

Business Diagram Colored 3d Flow Chart For Data Processing Presentation Template
Colored 3d flow chart has been used to design this power point template. This PPT contains the concept of data processing. Use this PPT for your data communication and analysis related presentations.

Business Diagram Eight Staged Circular Puzzle Bar Graph Presentation Template
This Power Point template has been crafted with graphic of eight staged circular puzzle and bar graph. This PPT contains the financial result analysis related concept. Use this PPT for your business and success related presentations.
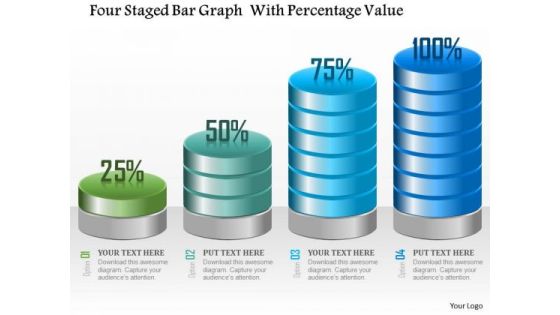
Business Diagram Four Staged Bar Graph With Percentage Value Presentation Template
Four staged bar graph with percentage value has been used to craft this power point template. This PPT contains the concept of making financial timeline and result analysis. This PPT can be used for business and finance related presentations.

Stock Photo Bar Graph With Cubes For Financial Data PowerPoint Slide
Graphic of bar graph and cubes are used to decorate this image template. This PPT contains the concept of financial data analysis. Use this PPT for finance and business related presentations.

Business Diagram 3d Venn Diagram For Global Business Project Presentation Template
This business diagram displays 3d Venn diagram. This editable slide is suitable to present business reports. Use this diagram for business and finance related topics and display complete data analysis in your presentation.

Business Diagram Business Workflow Layout Diagram For Process Flow Presentation Template
This business diagram displays graphic of multiple business icons around globe. This power point template contains the concept of business analysis and research. Use this diagram to build unique presentation for your viewers.

Business Framework Golden Circle PowerPoint Presentation
This business diagram has been designed with graphic of blue colored circle. This business slide is suitable to display data analysis in any business presentation. Use this slide to build a unique presentations for your viewers
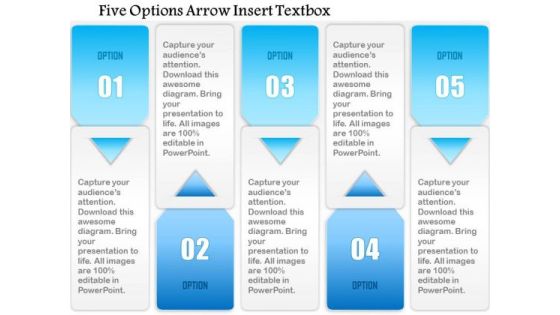
Business Diagram Five Options Arrow Insert Textbox Presentation Template
This PowerPoint template displays textbox diagram. This business diagram contains five points textboxes. Use this diagram, in your presentations to display timeline, strategy, icons and business analysis. Create professional presentations using this professional slide.
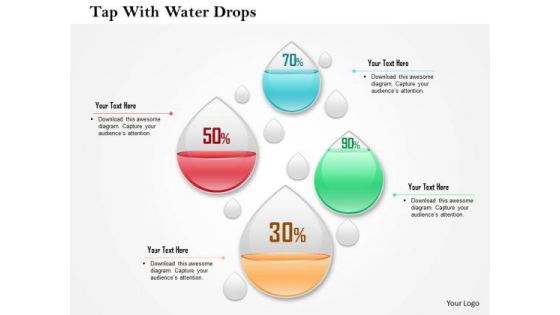
Business Diagram Four Water Drops With Percentage Values Presentation Template
This business diagram has been designed with graphic of four water drops and percentage values. This slide may be used to display percentage values for business analysis. Use this editable diagram for finance and business related presentations.

Business Diagram Big Data Big Insight From Data Feeds To Explain The Benefits Ppt Slide
Explain the benefits of big data analysis and data feeds with this technology diagram. This slide contains the graphic of scale with big data and big insight. Use this slide your data information and measurement related presentations.
Business Diagram Creative Sign With Highway Sign Text Big Data Next Exit Ppt Slide
This diagram has been designed with graphic of magnifier and text boxes. These boxes are used to display creative sign and highway sign for big data analysis. This diagram can be used for data related topics in any presentation.

Business Diagram Data Warehouse Model With Analytics And Business Intelligence Ppt Slide
This technology diagram has been designed with graphic of data warehouse model. This model depicts concept of business intelligence and analysis. Download this editable slide build an exclusive presentation.

Business Diagram Exponentially Growing Big Data With Icons Surrounding Cloud Ppt Slide
This slide contains the graphic of clouds and icons. This diagram has been designed with concept of big data growth. This diagram displays the exponential growth of data analysis. Use this diagram slide for your data technology related presentations.

Business Diagram Map Shuffle Reduce Phases Shown In Big Data Analytic Processing Ppt Slide
This technology slide has been designed with graphic of map and data text. This diagram helps to depict concept of data analysis and processing. Use this diagram slide for computer technology related presentations.
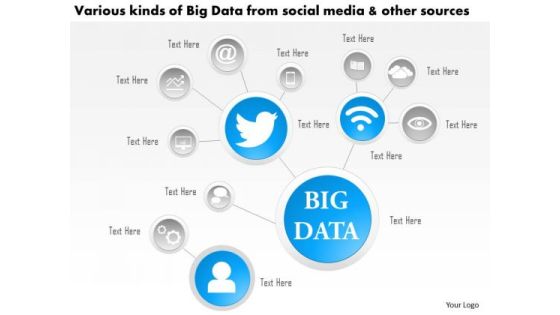
Business Diagram Various Kinds Of Big Data From Social Media And Other Sources Ppt Slide
This technology diagram contains the concept of big data analysis. This slide depicts various kinds of social media and other sources. Use this diagram for mobile and communication related presentations.

3d Man On The Top Of Puzzle Bar Graph
This PPT has been designed with graphic of 3d man and puzzle are graph. This PPT displays the concept of result analysis and financial growth. Use this PPT for your business and finance related presentations.
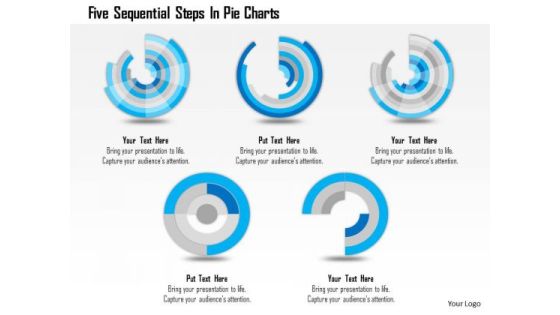
Business Diagram Five Sequential Steps In Pie Charts Presentation Template
Five sequential pie charts are used to craft this power point template. This PPT contains the concept of process flow and result analysis. Use this PPT for your business and sales related presentations and build quality presentation for your viewers.
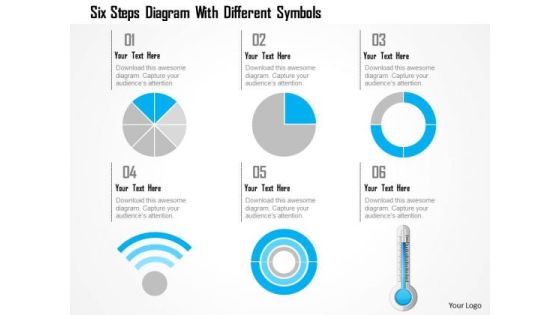
Business Diagram Six Steps Diagram With Different Symbols Presentation Template
This power point template has been crafted with graphic of 3d pie charts with Wi-Fi symbol and thermometer. This PPT contains the concept of calculation and result analysis. Use this PPT for your business and science related presentations.
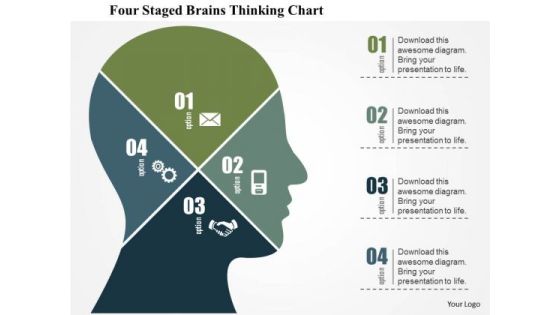
Business Diagram Four Staged Brains Thinking Chart Presentation Template
Graphic of four staged chart in human brain has been used to design this business diagram. This slide depicts concept of thinking process and analysis. Make your presentation more interactive with this business slide.

Business Diagram Global Data Globe With Educational Components Presentation Template
This business diagram has been designed with graphic of globe with icons. Use our diagram slide to organize data and to display data analysis. This diagram is suitable for global business and marketing related presentations.
Business Diagram Globe With Colorful Arrows And Icons Presentation Template
This business diagram has been designed with graphic of globe with arrow and icons. Use our diagram slide to organize data and to display data analysis. This diagram is suitable for global business and marketing related presentations.
Business Diagram Test Tube With Colored Bubbles For Science Data Presentation Template
Test tubes with colored bubbles are used to design this power point template slide. This PPt slide contains the concept of science data analysis. Use this PPT slide for your business and science related presentations.
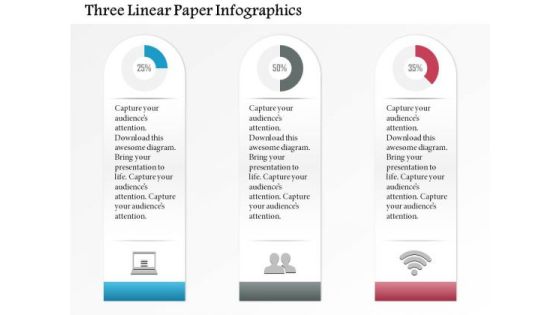
Business Diagram Three Linear Paper Infographics Presentation Template
Three linear paper info graphics has been used to design this power point template slide. This PPT slide contains the concept of data analysis and business data flow. Use this PPT slide for your business and marketing related presentations.

Business Diagram Circular Diagram For Company Vision Presentation Template
This power point template diagram has been crafted with three staged Venn diagram. This PPT contains the concept of future vision and analysis. Use this PPT for your business presentations.

Business Diagram Thermometer Graphics Indicating Progress Presentation Template
This power point template diagram has been designed with graphic of thermometer and bar graph. This PPT contains the concept of growth analysis. Use this PPT for business and marketing related presentations.

Business Diagram Colorful Infographics For Data Representation Presentation Template
This power point template diagram has been crafted with graphic of colorful info graphics. This PPT diagram contains the concept of analysis and data representations. Use this PPT for marketing and business related presentations.

Business Diagram Globe Bar Graph And Bulb For International Business Diagram Presentation Template
Graphic of globe and bar graph with bulb has been used to craft this power point template diagram. This PPT diagram contains the concept of international business growth analysis. Use this PPT for global business and sales related presentations.

Business Diagram Thumb In Vertical Order With App Graphics Presentation Template
This power point template diagram has been crafted with graphic of thumb in vertical order and apps. This PPT diagram contains the concept of application analysis. Use this PPT for business presentation and get good remarks.
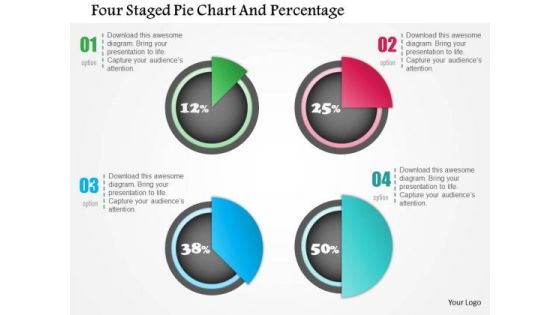
Business Diagram Four Staged Pie Chart And Percentage Presentation Template
Four staged pie chart and percentage values has been used to design this power point template. This PPT contains the concept of financial result analysis. Use this PPT for business and marketing related presentations.
Business Diagram Human Icon Bar Graph For Business Presentation Template
Graphic of human icons and bar graph has been used to decorate this power point template. This PPT contains the concept of business communication and result analysis. Use this PPT for business and marketing related presentations.

Business Diagram Business People Over Bar Chart PowerPoint Template
This Power Point template has been designed with graphic of business people and bar chart. This PPT contains the concept of result analysis and business data display. Use this PPT slide for your business and marketing related presentations.
 Home
Home