Risk Table
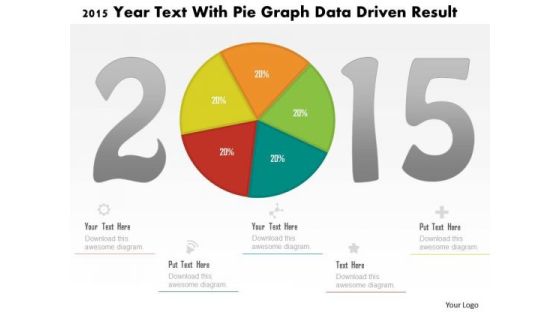
Business Diagram 2015 Year Text With Pie Graph Data Driven Result PowerPoint Slide
This business diagram displays 2015 year numbers with pie chart. This diagram is suitable to display business strategy for year 2015. Download this professional slide to present information in an attractive manner

Business Diagram Battery Connected With Bulb For Idea Generation PowerPoint Slide
This business slide displays battery icon connected with bulb. This diagram is a data visualization tool that gives you a simple way to present statistical information. This slide helps your audience examine and interpret the data you present.
Business Diagram Battery Icon With Power Icons Energy Technology PowerPoint Slide
This business diagram displays battery icon with power charging. Use this diagram, in your presentations to display energy saving, battery and technology. Create professional presentations using this diagram slide.
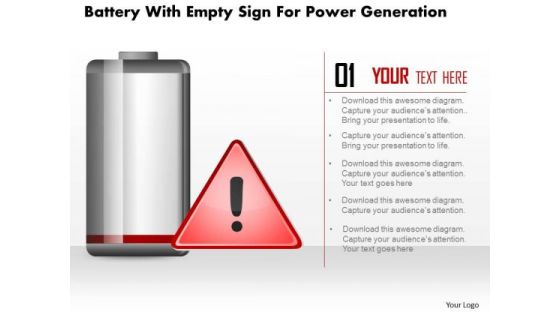
Business Diagram Battery With Empty Sign For Power Generation PowerPoint Slide
This business diagram displays empty sign alert on battery icon. Use this diagram, in your presentations to display energy saving, battery and technology. Create professional presentations using this diagram slide.

Business Diagram Data Driven Pie Chart Inside The Magnifier PowerPoint Slide
This business slide displays 3d colorful pie graph with magnifier. This diagram is a data visualization tool that gives you a simple way to present statistical information. This slide helps your audience examine and interpret the data you present.
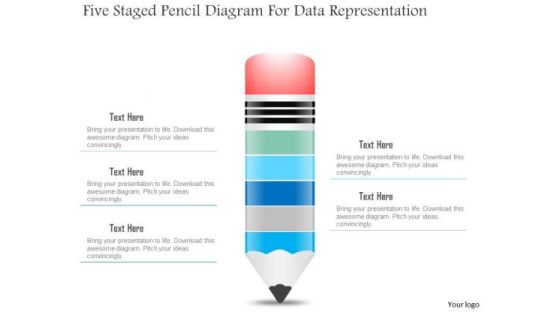
Business Diagram Five Staged Pencil Diagram For Data Representation PowerPoint Slide
This business slide displays five staged pencil diagram. It contains pencil graphic divided into five parts. This diagram slide depicts processes, stages, steps, points, options and education information display. Use this diagram, in your presentations to express your views innovatively.

Business Diagram Five Staged Timeline Diagram For Business PowerPoint Slide
This PowerPoint template displays five points timeline diagram. This business diagram has been designed with graphic of timeline with five points, text space and start, end points. Use this diagram, in your presentations to display process steps, stages, timelines and business management. Make wonderful presentations using this business slide.
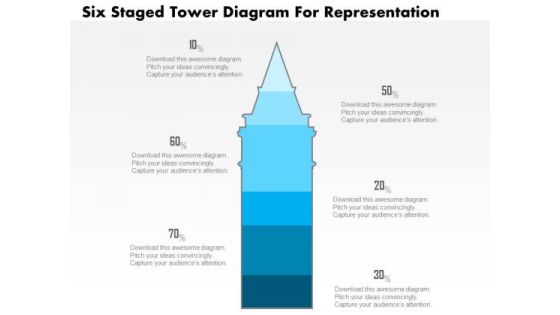
Business Diagram Five Staged Tower Diagram For Representation PowerPoint Slide
This business slide displays five staged tower diagram. It contains blue tower graphic divided into five parts. This diagram slide depicts processes, stages, steps, points, options information display. Use this diagram, in your presentations to express your views innovatively.
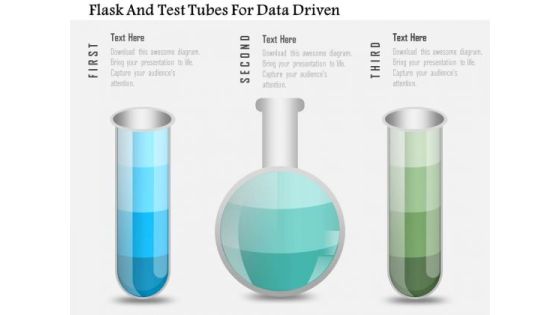
Business Diagram Flask And Test Tubes For Data Driven PowerPoint Slide
This data driven diagram has been designed with flask and test tubes. Download this diagram to give your presentations more effective look. It helps in clearly conveying your message to clients and audience.

Business Diagram Flask With Data Driven Chart PowerPoint Slide
This data driven diagram has been designed with flask graphics. Download this diagram to give your presentations more effective look. It helps in clearly conveying your message to clients and audience.
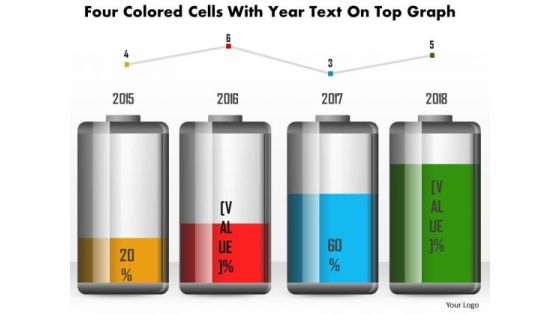
Business Diagram Four Colored Cells With Year Text On Top Graph PowerPoint Slide
This business diagram has been designed with battery cell graphic for business timeline. This slide can be used for business planning and management. Use this diagram for your business and success milestones related presentations.
Business Diagram Green Battery Cell With Full Charging Symbol PowerPoint Slide
This business diagram displays full battery charge icon. Use this diagram, in your presentations to display energy saving, battery and technology. Create professional presentations using this diagram slide.
Business Diagram Hour Glass With 3d Man And Icons PowerPoint Slide
This diagram displays 3d man with hour glass and icons. This diagram contains concept of communication and technology. Use this diagram to display business process workflows in any presentations.
Business Diagram Human Icons With Bubbles And Different Icons Inside PowerPoint Slide
This diagram displays graph with percentage value growth. This business slide is suitable to present and compare business data. Use this diagram to build professional presentations for your viewers.

Business Diagram Human Mind Diagram With Pie Graph For Representation PowerPoint Slide
This diagram displays human face graphic divided into sections. This section can be used for data display. Use this diagram to build professional presentations for your viewers.

Business Diagram Laptop With Data Driven Area Chart PowerPoint Slide
This diagram has been designed with laptop and data driven area chart. Download this diagram to give your presentations more effective look. It helps in clearly conveying your message to clients and audience.

Business Diagram Six Staged Pie Charts For Text Representation PowerPoint Slide
This slide displays graphic six staged pie charts. Download this diagram to present and compare business data. Use this diagram to display business process workflows in any presentation.
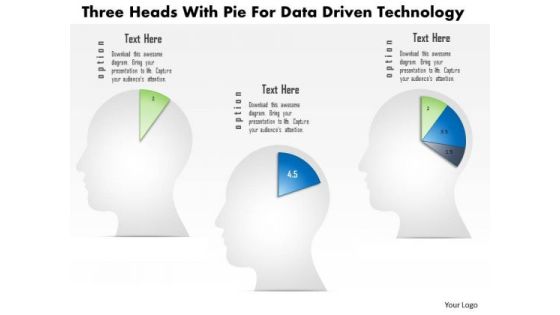
Business Diagram Three Heads With Pie For Data Driven Technology PowerPoint Slide
This business diagram displays three human faces with pie charts. This Power Point template has been designed to compare and present business data. You may use this diagram to impart professional appearance to your presentations.

Business Diagram Three Staged Pencil Diagram For Graph Formation PowerPoint Slide
This business diagram displays set of pencils. This Power Point template has been designed to compare and present business data. Download this diagram to represent stages of business growth.

Business Diagram Four Steps With 3d Business Person Standing Over It PowerPoint Slide
This business diagram displays bar graph with business person standing on it. This Power Point template has been designed to display personal growth. You may use this diagram to impart professional appearance to your presentations.
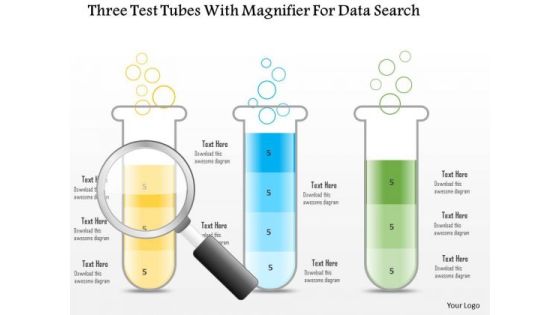
Business Diagram Three Test Tubes With Magnifier For Data Search PowerPoint Slide
This business diagram displays three test tubes with magnifying glass. This diagram is suitable to depict flow of business activities or steps. Download this professional slide to present information in an attractive manner.
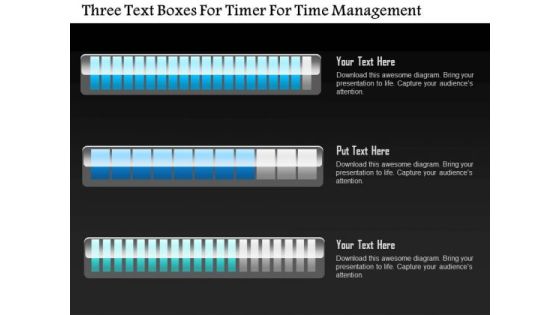
Business Diagram Three Text Boxes For Timer For Time Management PowerPoint Slide
This business diagram displays three text boxes. This diagram contains text boxes for data representation. Use this diagram to display business process workflows in any presentations.

Business Diagram Three Trucks For Data Representation For Business PowerPoint Slide
This business diagram displays three trucks graphic. This diagram contains trucks for percentage value growth. Use this diagram to display business growth over a period of time.

Business Diagram Two Tablets With Growth Bar Graph Data Driven PowerPoint Slide
This business diagram has been designed with comparative charts on tablets. This slide suitable for data representation. You can also use this slide to present business reports and information. Use this diagram to present your views in a wonderful manner.

Mapping Your Competitive Position Ppt PowerPoint Presentation Files
This is a mapping your competitive position ppt powerpoint presentation files. This is a four stage process. The stages in this process are gaining market share, losing market share, company growth, average market growth.

Employees Gender Deference Statistics Ppt PowerPoint Presentation Example File
This is a employees gender deference statistics ppt powerpoint presentation example file. This is a one stage process. The stages in this process are female, male, computer, technology.

Last 90 Days Results Ppt PowerPoint Presentation Introduction
This is a last 90 days results ppt powerpoint presentation introduction. This is a six stage process. The stages in this process are revenue, new customers, gross profit, sales comparison.

Customer Traction Ppt PowerPoint Presentation Information
This is a customer traction ppt powerpoint presentation information. This is a four stage process. The stages in this process are signed up, visited signup page, traffic, impressions, funnel.
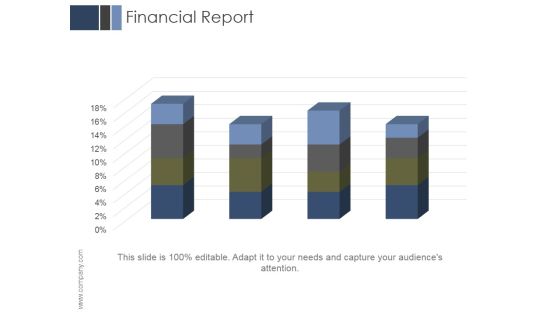
Financial Report Ppt PowerPoint Presentation Templates
This is a financial report ppt powerpoint presentation templates. This is a four stage process. The stages in this process are business, marketing, management, finance, report.
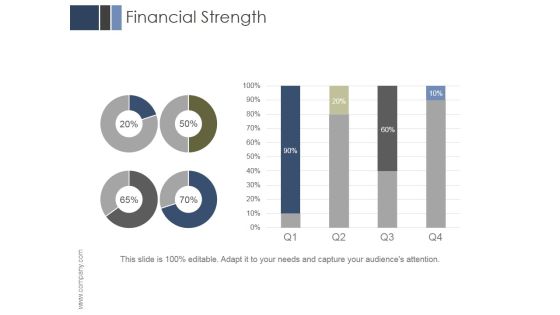
Financial Strength Ppt PowerPoint Presentation Graphics
This is a financial strength ppt powerpoint presentation graphics. This is a four stage process. The stages in this process are business, marketing, management, finance, strength.

Competitive Intelligence Ppt PowerPoint Presentation Example 2015
This is a competitive intelligence ppt powerpoint presentation example 2015. This is a four stage process. The stages in this process are business, marketing, management, matrix, planning.
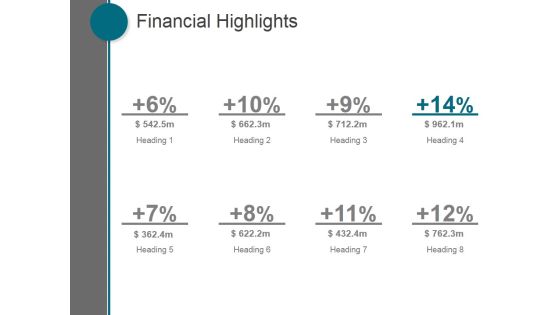
Financial Highlights Ppt PowerPoint Presentation Visual Aids
This is a financial highlights ppt powerpoint presentation visual aids. This is a eight stage process. The stages in this process are business, marketing, management, finance, strategy.

Digital Marketing Plan Ppt PowerPoint Presentation Show
This is a digital marketing plan ppt powerpoint presentation show. This is a five stage process. The stages in this process are national marketing, local marketing, public relations, content marketing.
Newspaper Ppt PowerPoint Presentation Background Images
This is a newspaper ppt powerpoint presentation background images. This is a one stage process. The stages in this process are business, marketing, newspaper, advertisement, management.

Competitor Positioning Ppt PowerPoint Presentation Summary
This is a competitor positioning ppt powerpoint presentation summary. This is a two stage process. The stages in this process are average market growth, gaining market share, losing market share, company growth.

Budgeting Planned Actual Comparison Ppt PowerPoint Presentation Shapes
This is a budgeting planned actual comparison ppt powerpoint presentation shapes. This is a three stage process. The stages in this process are planned cost, actual cost, value difference, finance, timeline.

Real Estate New Home Loan Applications Ppt PowerPoint Presentation Samples
This is a real estate new home loan applications ppt powerpoint presentation samples. This is a one stage process. The stages in this process are business, marketing, finance, management, applications.
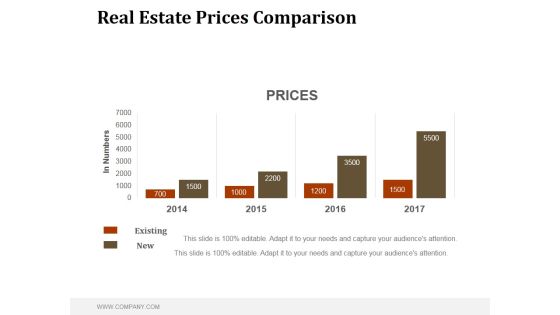
Real Estate Prices Comparison Ppt PowerPoint Presentation Example File
This is a real estate prices comparison ppt powerpoint presentation example file. This is a four stage process. The stages in this process are business, marketing, management, comparison, prices.
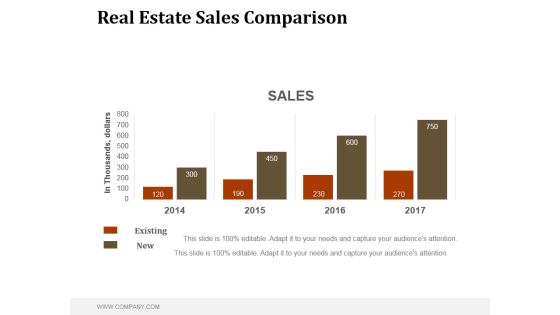
Real Estate Sales Comparison Ppt PowerPoint Presentation Good
This is a real estate sales comparison ppt powerpoint presentation good. This is a four stage process. The stages in this process are business, marketing, management, sales, comparison.

Conversion Rate Template 1 Ppt PowerPoint Presentation Show
This is a conversion rate template 1 ppt powerpoint presentation show. This is a two stage process. The stages in this process are gross revenue, net revenue .
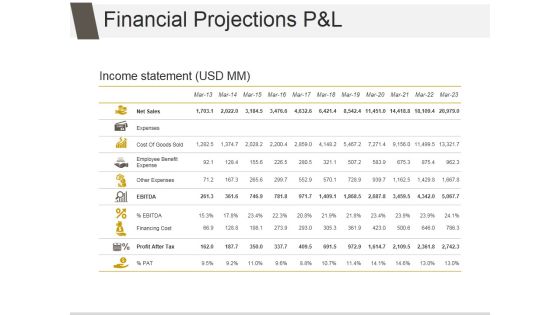
Financial Projections P And L Ppt PowerPoint Presentation Design Ideas
This is a financial projections p and l ppt powerpoint presentation design ideas. This is a eleven stage process. The stages in this process are net sales, expenses, cost of goods sold, employee benefit expense, other expenses, financing cost.

Clustered Column Ppt PowerPoint Presentation Backgrounds
This is a clustered column ppt powerpoint presentation backgrounds. This is a two stage process. The stages in this process are business, marketing, finance, compare, management.

Calculating Customer Lifetime Value Clv Ppt PowerPoint Presentation Styles Good
This is a calculating customer lifetime value clv ppt powerpoint presentation styles good. This is a five stage process. The stages in this process are average acquisition cost, average customer revenue, average customer costs, average customer profit, customer retention rate, cumulative retention rate, likely customer profit.

Changes In Competitive Environment Template 2 Ppt PowerPoint Presentation Professional Themes
This is a changes in competitive environment template 2 ppt powerpoint presentation professional themes. This is a four stage process. The stages in this process are brand, business, marketing, competitive landscape, growth.
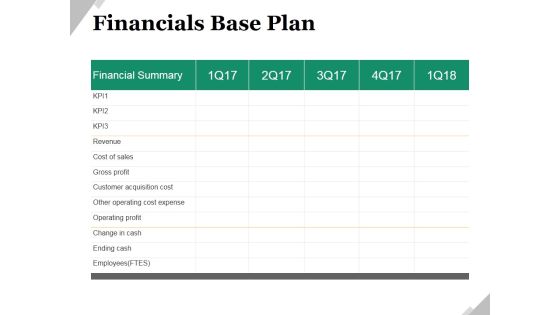
Financials Base Plan Ppt PowerPoint Presentation Model Shapes
This is a financials base plan ppt powerpoint presentation model shapes. This is a five stage process. The stages in this process are financial summary, business, marketing, revenue, cost of sales, gross profit.
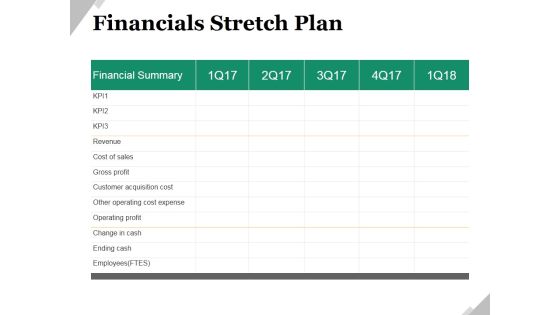
Financials Stretch Plan Ppt PowerPoint Presentation Ideas Shapes
This is a financials stretch plan ppt powerpoint presentation ideas shapes. This is a five stage process. The stages in this process are revenue, cost of sales, gross profit, customer acquisition cost, other operating cost expense, operating profit.
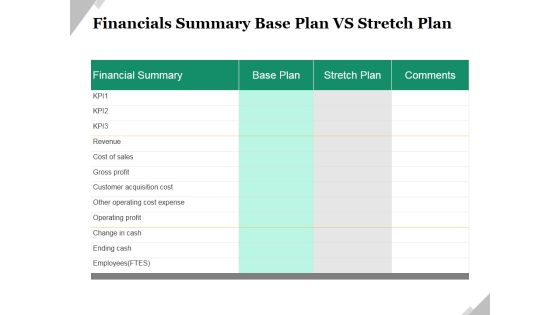
Financials Summary Base Plan Vs Stretch Plan Ppt PowerPoint Presentation Slides Information
This is a financials summary base plan vs stretch plan ppt powerpoint presentation slides information. This is a two stage process. The stages in this process are revenue, cost of sales, gross profit, customer acquisition cost, other operating cost expense, operating profit.

Campaign Report Ppt PowerPoint Presentation Slides Professional
This is a campaign report ppt powerpoint presentation slides professional. This is a five stage process. The stages in this process are email name, send date time, recipients, delivered, spam, opt out, open, click, transactions, revenue.
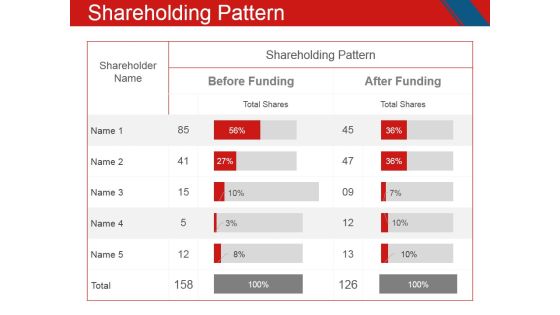
Shareholding Pattern Ppt PowerPoint Presentation Model Microsoft
This is a shareholding pattern ppt powerpoint presentation model microsoft. This is a two stage process. The stages in this process are shareholder name, shareholding pattern, before funding, after funding.

Calculating Customer Lifetime Value Clv Ppt PowerPoint Presentation Infographic Template Format
This is a calculating customer lifetime value clv ppt powerpoint presentation infographic template format. This is a five stage process. The stages in this process are average acquisition cost, average customer revenue, average customer costs, average customer profit, customer retention rate, cumulative retention rate.

Changes In Competitive Environment Template 2 Ppt PowerPoint Presentation Outline Slideshow
This is a changes in competitive environment template 2 ppt powerpoint presentation outline slideshow. This is a four stage process. The stages in this process are business, comparison, marketing, brand, management.

Dashboard Ppt PowerPoint Presentation Gallery Layouts
This is a dashboard ppt powerpoint presentation gallery layouts. This is a two stage process. The stages in this process are speed, meter, business, marketing, equipment.

Financials Base Plan Template 2 Ppt PowerPoint Presentation Outline Backgrounds
This is a financials base plan template 2 ppt powerpoint presentation outline backgrounds. This is a three stage process. The stages in this process are cost of sales, gross profit, customer acquisition cost, other operating cost expense, operating profit.
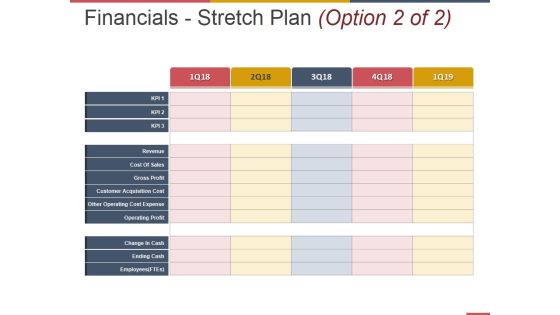
Financials Stretch Plan Template 1 Ppt PowerPoint Presentation Pictures Professional
This is a financials stretch plan template 1 ppt powerpoint presentation pictures professional. This is a three stage process. The stages in this process are cost of sales, gross profit, customer acquisition cost, other operating cost expense, operating profit.

Comparison Ppt PowerPoint Presentation Portfolio Inspiration
This is a comparison ppt powerpoint presentation portfolio inspiration. This is a two stage process. The stages in this process are business, marketing, comparison, finance, management.

Checklist For Go To Market Strategy In Ready To Eat Ready To Eat Food Market Analysis Rules PDF
Boost your pitch with our creative Checklist For Go To Market Strategy In Ready To Eat Ready To Eat Food Market Analysis Rules PDF. Deliver an awe-inspiring pitch that will mesmerize everyone. Using these presentation templates you will surely catch everyones attention. You can browse the ppts collection on our website. We have researchers who are experts at creating the right content for the templates. So you do not have to invest time in any additional work. Just grab the template now and use them.
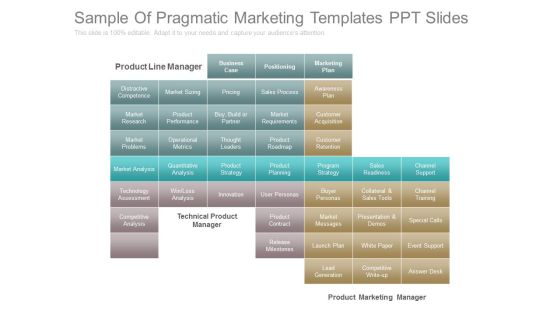
Sample Of Pragmatic Marketing Templates Ppt Slides
This is a sample of pragmatic marketing templates ppt slides. This is a one stage process. The stages in this process are product line manager, business case, positioning, marketing plan, distractive competence, market sizing, pricing, sales process, awareness plan, market research, product performance, buy build or partner, market requirements, customer acquisition, market problems, operational metrics, thought leaders, product roadmap, customer retention, market analysis, quantitative analysis, product strategy, product planning, program strategy, sales readiness, channel support, technology assessment, win loss analysis, innovation, user personas, buyer personas, collateral and sales tools, channel training, competitive analysis, technical product manager, product contract, market messages, presentation and demos, special calls, release milestones, launch plan, white paper, event support, lead generation, competitive write up, answer desk.
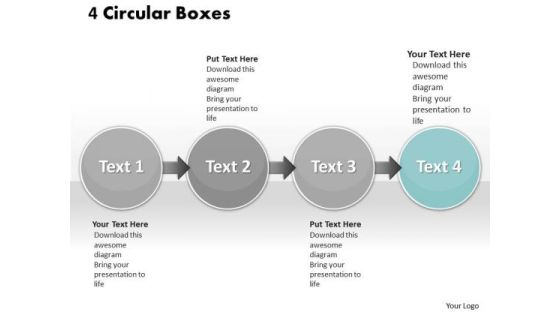
Ppt Four Interconnected Stock Exchange Text Circles PowerPoint Templates
PPT four interconnected stock exchange text circles PowerPoint Templates-Use this graphical approach to represent global business issues such as financial data, stock market Exchange, increase in sales, corporate presentations and more. It Signifies common, comprehensive, extensive, global, international, multinational, omnipresent, planetary, ubiquitous, universal etc.-PPT four interconnected stock exchange text circles PowerPoint Templates-Analysis, Arrow, Background, Backlink, Circle, Code, Content, Diagram, Engine, Illustration, Keyword, Optimization, Offpage, Process, Search, Template, Tracking, Unpage, Violet, Visitor,
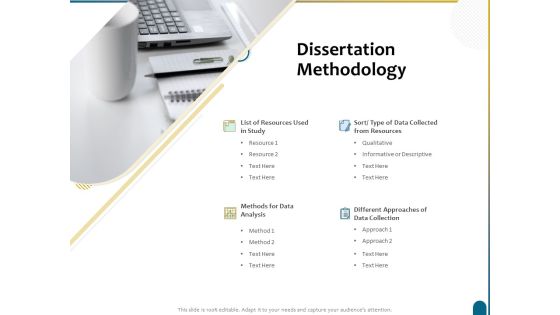
Dissertation Research Dissertation Methodology Ppt Pictures Files PDF
Presenting dissertation research dissertation methodology ppt pictures files pdf to provide visual cues and insights. Share and navigate important information on four stages that need your due attention. This template can be used to pitch topics like list of resources used in study, methods for data analysis, different approaches of data collection, sort or type of data collected from resources. In addition, this PPT design contains high-resolution images, graphics, etc, that are easily editable and available for immediate download.
Enterprise Thesis Business Dissertation Methodology Proposal Ppt Pictures Icon PDF
Presenting enterprise thesis business dissertation methodology proposal ppt pictures icon pdf to provide visual cues and insights. Share and navigate important information on four stages that need your due attention. This template can be used to pitch topics like list of resources used in study, methods for data analysis, different approaches of data collection. In addition, this PPT design contains high-resolution images, graphics, etc, that are easily editable and available for immediate download.


 Continue with Email

 Home
Home


