AI PPT Maker
Templates
PPT Bundles
Design Services
Business PPTs
Business Plan
Management
Strategy
Introduction PPT
Roadmap
Self Introduction
Timelines
Process
Marketing
Agenda
Technology
Medical
Startup Business Plan
Cyber Security
Dashboards
SWOT
Proposals
Education
Pitch Deck
Digital Marketing
KPIs
Project Management
Product Management
Artificial Intelligence
Target Market
Communication
Supply Chain
Google Slides
Research Services
 One Pagers
All Categories
-
Home
- Customer Favorites
- Revenue
Revenue

Illustration Of Dollar Growth Graph PowerPoint Template
This business slide contains graphics of dollar symbols on graph. This diagram helps to portray concept of financial planning. Present your views using this innovative slide and be assured of leaving a lasting impression.

Growth Graph With Design Elements PowerPoint Templates
The above template displays growth bar graph. This PowerPoint template signifies the concept of business and financial planning. Adjust the above diagram in your business presentations to visually support your content.

Dollar Infographic For Equity Accounting Powerpoint Template
Our professionally designed business diagram is as an effective tool for communicating concept of equity accounting. It contains dollar infographic diagram. Above slide is suitable to display financial planning and strategy.

Dollar Bulb With Idea Success Tags Powerpoint Template
Our above slide contains graphics of light bulb with dollars and idea success tags. It helps to display concepts of financial idea planning and success. Develop your strategy and communicate with your team with this professional slide design.

Dashboard Diagram For Finance And Strategic Analysis Powerpoint Slides
This PowerPoint template display graphics of clock with arrows around it and dollar symbol in center. You may use this PPT slide for financial and strategic analysis. This dashboard slide may useful for multilevel status report creation and approval process.

Four Companies With Web Services Powerpoint Slides
This PowerPoint template display graphics of four corporate buildings. You may use this PPT slide for financial and strategic analysis for web services companies. This dashboard slide may useful for multilevel status report creation and approval process.
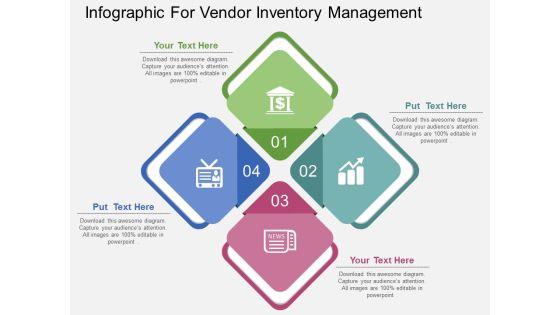
Infographic For Vendor Inventory Management Powerpoint Template
Our above slide display graphics of four connected steps with icons. Download this diagram slide to display financial management process. Adjust the above diagram in your business presentations to visually support your content.

Pie Chart Infographic Diagram Powerpoint Templates
This Power Point template has been designed with pie chart infographic. This business slide is useful to present financial ratio analysis. Use this diagram to make business presentation. Illustrate these thoughts with this slide.
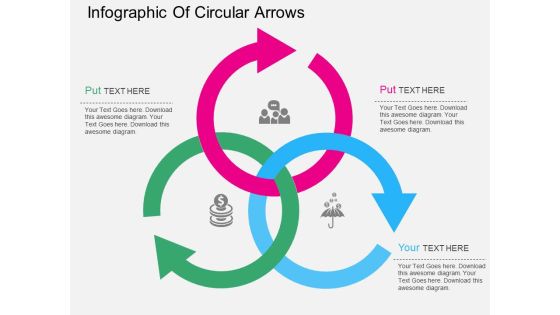
Infographic Of Circular Arrows Powerpoint Templates
This PPT slide has been designed with intersecting circular arrows. This PowerPoint template is suitable to present financial strategy for business. This professional slide helps in making an instant impact on viewers.

Four Directional Arrows Road Infographics Powerpoint Template
Download this exclusive business diagram to present four steps of financial reporting. This slide contains the four directional arrows road infographic. This PPT diagram slide is useful for business presentations.
Four Twisted Arrows With Creative Icons Powerpoint Template
This PowerPoint template has been designed with four twisted arrows and creative icons. This business diagram helps to exhibit financial accounting systems. Use this diagram to build an exclusive presentation.
Dollar Growth Tree In Gear Powerpoint Templates
This PowerPoint slide has been designed with dollar growth tree. This diagram is designed to display financial growth planning. This professional slide helps in making an instant impact on viewers.

Dollar Trophy For Goal Success Powerpoint Templates
This PowerPoint slide has been designed with diagram of dollar trophy. This diagram is designed to depict concepts of goal and financial success. This professional slide helps in making an instant impact on viewers.
Roadmap With Year Based Timeline And Icons Powerpoint Slides
This infographic roadmap template can be used for multiple purposes including financial planning, new milestones and tasks. It contains year based timeline diagram. Download this PowerPoint timeline template to make impressive presentations.

Colorful Cards With Icons For Technology Powerpoint Templates
This slide has been designed with graphics of colorful cards with icons of bulb, dollar, gear and magnifier. You may download this slide for financial analysis. Deliver amazing presentations to mesmerize your audience.
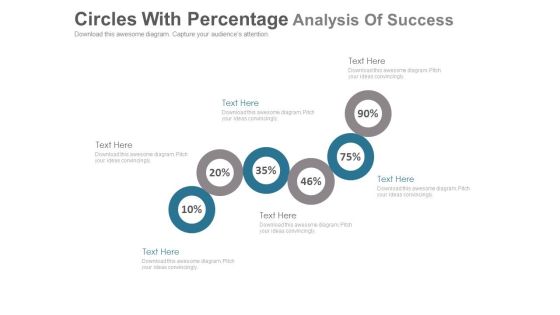
Six Circles For Percentage Value Analysis Powerpoint Slides
This PowerPoint template has been designed with six circles and percentage values. This PPT slide can be used to display financial ratio analysis. You can download finance PowerPoint template to prepare awesome presentations.
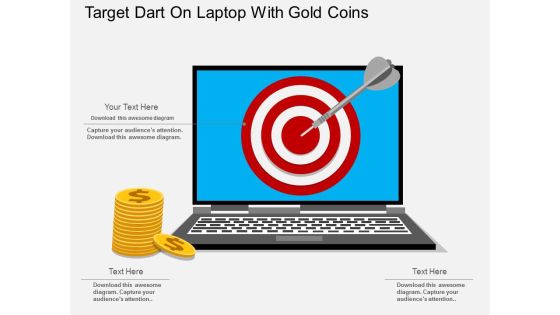
Target Dart On Laptop With Gold Coins Powerpoint Template
This business PowerPoint slide displays target dart on laptop with gold coins. This diagram is suitable for financial planning and target related topics. Download this PPT slide to make impressive presentations.

Three Human Faces In Question Mark Shape Powerpoint Templates
Adjust the above image into your Presentations to visually support your content. This slide has been professionally designed to financial targets. This template offers an excellent background to build impressive presentation.

Three Text Tags With Alphabets Powerpoint Templates
The above template displays a diagram of circular arrows with icons. This diagram has been professionally designed to display steps of financial planning. Capture the attention of your audience.
Four Banners With Finance Icons Powerpoint Template
This PowerPoint template has been designed with graphics of four banners with finance icons. Download this professional slide to depict steps of financial planning. Enlighten your audience with your breathtaking ideas.

Linear Arrows Year Based Timeline For Business Powerpoint Slides
This linear arrows timeline template can be used for multiple purposes including event planning, new milestones and tasks. This PPT slide may be helpful to display financial strategy timeline. Download this PowerPoint timeline template to make impressive presentations.
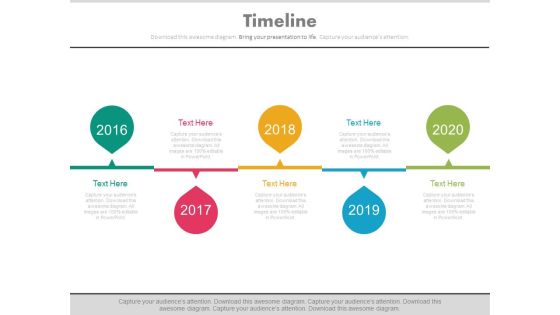
Linear Timeline For Specific Organizational Objectives Powerpoint Slides
This PowerPoint timeline template can be used for specific organizational objectives. This PPT slide may be helpful to display financial strategy timeline. Download this PowerPoint timeline template to make impressive presentations.

Timeline Steps For Organizational Strategy Powerpoint Slides
This infographic timeline template can be used for multiple purposes including financial planning, new milestones and tasks. It contains organizational strategy timeline diagram. Download this PowerPoint timeline template to make impressive presentations.
Five Pointers With Science And Education Icons Powerpoint Template
Our professionally designed business diagram is as an effective tool for communicating concept of science and education. It contains five pointers infographic diagram. Above slide is also suitable to display financial planning and strategy.

Infographic Of Puzzle Bag Powerpoint Templates
Adjust the above image into your presentations to visually support your content. This slide has been professionally designed with puzzle bag infographic. This template offers an excellent background to build financial target related presentation.
Pie Chart With Seven Business Icons Powerpoint Templates
Our compelling template consists with a design of pie chart with seven business icons. This slide has been professionally designed to exhibit financial ratio analysis. This template offers an excellent background to build impressive presentation.

Cost Comparison Table Chart Powerpoint Slides
Our above PPT slide displays cost comparison table chart. This diagram may be used to display cost comparison and financial analysis. Download this PowerPoint template to leave permanent impression on your audience.
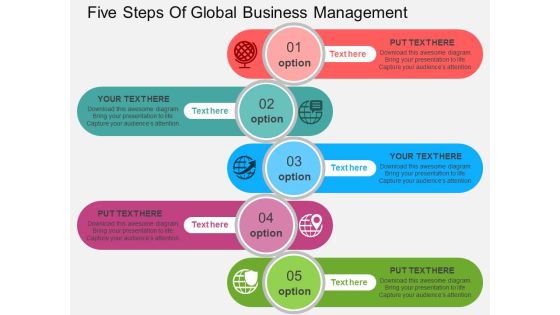
Five Steps Of Global Business Management Powerpoint Templates
Our above business diagram has been designed with graphics of six tags with icons. This slide is suitable to present financial planning. Use this business diagram to present your work in a more smart and precise manner.

Five Steps Of Successful Strategies For Teams Powerpoint Templates
Our above business diagram has been designed with graphics of six tags with icons. This slide is suitable to present financial management. Use this business diagram to present your work in a more smart and precise manner.
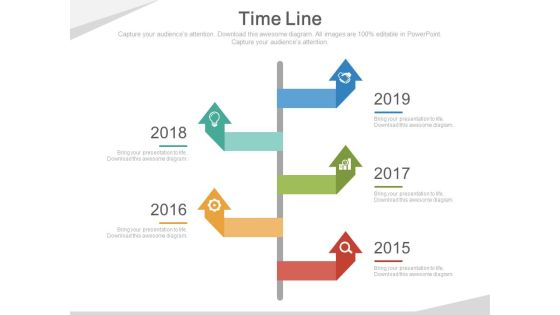
Five Arrows Signboard Style Timeline Diagram Powerpoint Slides
This five arrows signboard style timeline template can be used for multiple purposes including event planning, new milestones and tasks. This PPT slide may be helpful to display financial strategy timeline. Download this PowerPoint timeline template to make impressive presentations.
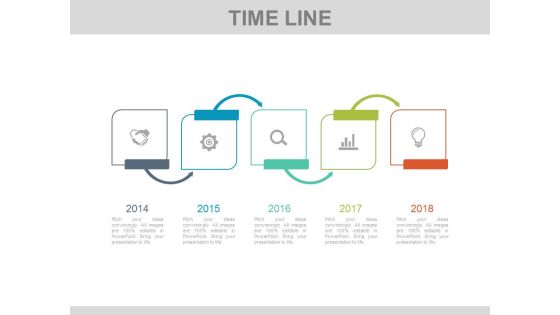
Five Steps Linear Timeline Infographic Diagram Powerpoint Slides
This infographic timeline template can be used for multiple purposes including financial planning, new milestones and tasks. It contains linear timeline infographic diagram. Download this PowerPoint timeline template to make impressive presentations.
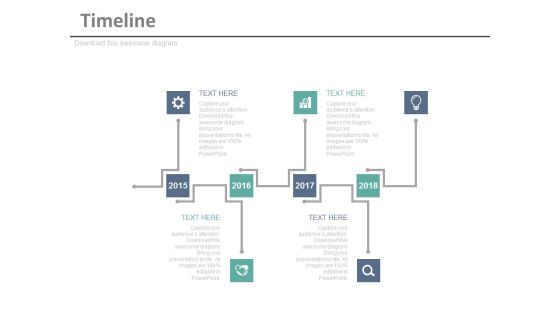
Timeline Infographic Diagram For Business Achievements Powerpoint Slides
This timeline infographic template can be used for multiple purposes including event planning, new milestones and tasks. This PPT slide may be helpful to display financial strategy timeline. Download this PowerPoint timeline template to make impressive presentations.
Four Circles With Percentage Values And Icons Powerpoint Slides
This PowerPoint template displays info graphic diagram of linear circles. This diagram may be used to exhibit financial growth and analysis. Grab center stage with this slide and capture the attention of your audience.
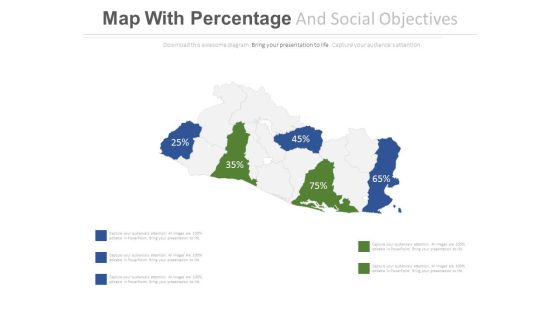
Map With Highlighted Areas And Percentage Values Powerpoint Slides
This PowerPoint template displays map diagram with highlighted areas and percentage values. You may use this PPT slide to exhibit area wise financial growth. Download this PowerPoint map diagram to build impressive presentations.
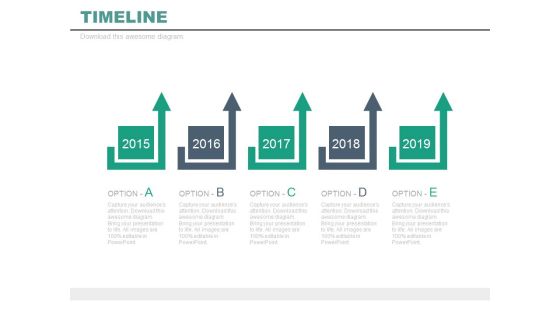
Five Options Timeline For Marketing Plan Powerpoint Slides
This five years timeline template can be used to display marketing plan. This PPT slide may be helpful to display financial strategy and timeline. Download this PowerPoint timeline template to make impressive presentations.

Five Sequential Year Tags Timeline Diagram Powerpoint Slides
This PowerPoint timeline template can be used for specific organizational objectives. This PPT slide may be helpful to display financial strategy and timeline. Download this PowerPoint timeline template to make impressive presentations.
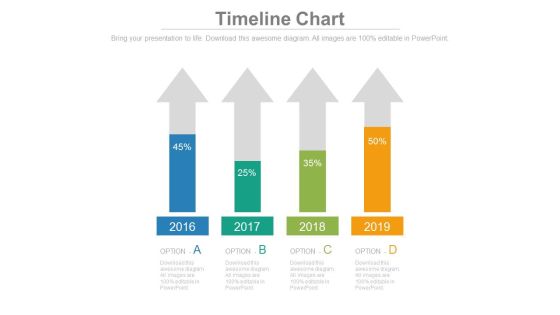
Four Arrows With Percentage Data Analysis Powerpoint Slides
This timeline template can be used for multiple purposes including financial planning, new milestones and tasks. It contains four upward arrows with percentage values. Download this PowerPoint timeline template to make impressive presentations.

Three Timeline Tags For Business Planning Powerpoint Slides
This three years timeline template can be used to display marketing plan. This PPT slide may be helpful to display financial strategy and timeline. Download this PowerPoint timeline template to make impressive presentations.

Arrow Steps Chart For Business Success Powerpoint Template
This PowerPoint template has been designed with graphics of arrow steps chart. Download this slide for planning of financial targets. Grab the attention of your listeners with this PPT slide.
Four Tags With Finance And Growth Icons Powerpoint Template
Our above business diagram has been designed with graphics of four text tags with icons. This business may be used to display financial strategy. Use this PowerPoint template to present your work in a more smart and precise manner.
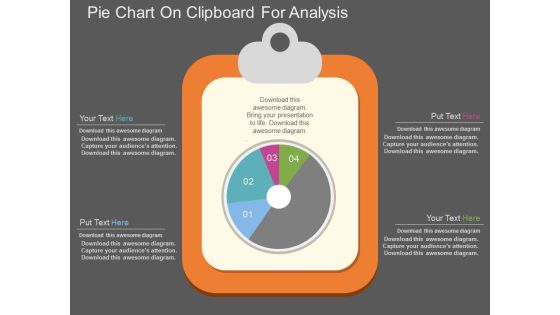
Pie Chart On Clipboard For Analysis Powerpoint Template
This PowerPoint template has been designed with graphics of pie chart on clipboard. Download this PPT slide for business and financial analysis. You may also use this professional template to depict statistical analysis.
Four Staged Colored Tags And Finance Icons Powerpoint Template
Our above business diagram has been designed with graphics of four text tags with icons. This business may be used to display financial strategy. Use this PowerPoint template to present your work in a more smart and precise manner.
Seven Staged Business Cubes And Icons Powerpoint Template
This PowerPoint template has been designed with graphics of seven cubes and business icons. Download this PPT slide for business and financial analysis. You may also use this professional template to depict statistical analysis.
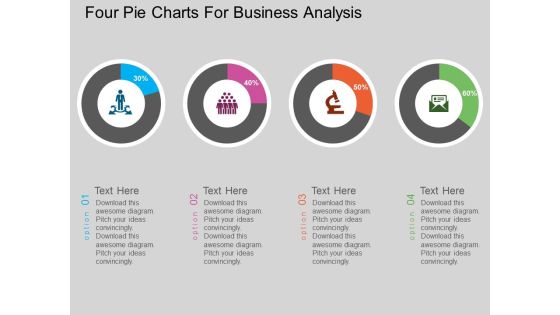
Four Pie Charts For Business Analysis Powerpoint Template
This PowerPoint template has been designed with graphics of four pie charts This diagram can be used to display financial planning and business analysis. Capture the attention of your audience with this slide.
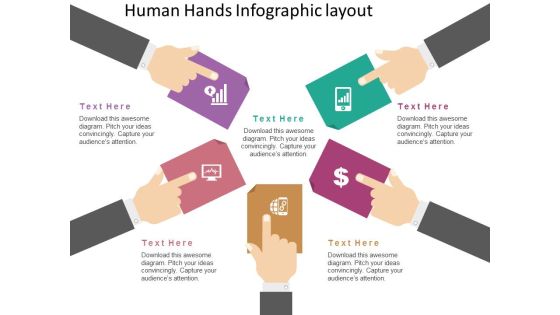
Human Hands Infographic Layout Powerpoint Template
Our professionally designed business diagram is as an effective tool for communicating concepts of financial planning. This slide illustrates human hands infographic. Convey your views with this diagram slide.

Competitor Analysis Marketing Plan Powerpoint Show
This is a competitor analysis marketing plan powerpoint show. This is a eight stage process. The stages in this process are market analysis, market growth, goals and objectives, team and founders, financial plan, marketing plan.\n\n

Innovation Technology Development Powerpoint Slides Show
This is an innovation technology development powerpoint slides show. This is a seven stage process. The stages in this process are geographical location, enter new market, competence capabilities, diversify the business, new product development, financial issues.
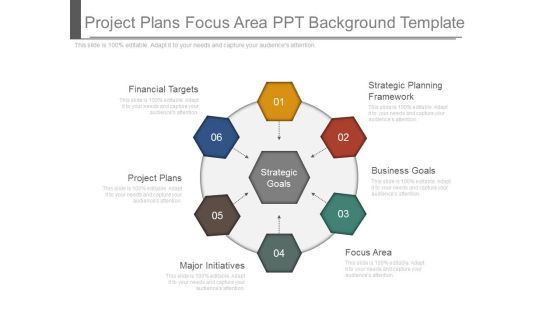
Project Plans Focus Area Ppt Background Template
This is a project plans focus area ppt background template. This is a six stage process. The stages in this process are financial targets, strategic planning framework, project plans, business goals, major initiatives, focus area.

Industries Targeted For Growth Ppt Presentation
This is an industries targeted for growth ppt presentation. This is a five stage process. The stages in this process are owned enterprises, accessible markets, financial incentives, industries targeted for growth, low tariffs, accessible markets.\n\n
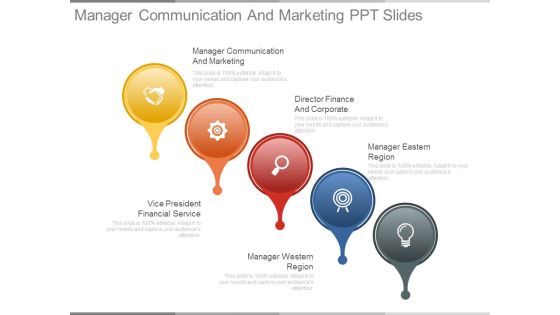
Manager Communication And Marketing Ppt Slides
This is a manager communication and marketing ppt slides. This is a five stage process. The stages in this process are manager communication and marketing, director finance and corporate, manager eastern region, vice president financial service, manager western region.

Business Necessity Capabilities Powerpoint Slides Rules
This is a business necessity capabilities powerpoint slides rules. This is a six stage process. The stages in this process are greater financial impact, strategic support capabilities, advantage capabilities, greater strategic, essential capabilities, business necessity capabilities.
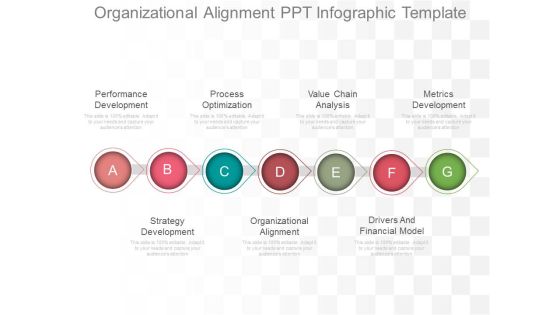
Organizational Alignment Ppt Infographic Template
This is a organizational alignment ppt infographic template. This is a seven stage process. The stages in this process are performance development, process optimization, value chain analysis, metrics development, strategy development, organizational alignment, drivers and financial model.
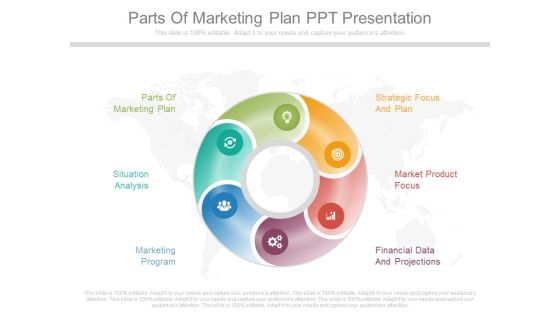
Parts Of Marketing Plan Ppt Presentation
This is a parts of marketing plan ppt presentation. This is a six stage process. The stages in this process are parts of marketing plan, strategic focus and plan, situation analysis, market product focus, marketing program, financial data and projections.

Executive Summary Mission Statement Ppt Example
This is a executive summary mission statement ppt example. This is a eight stage process. The stages in this process are financial planning, swot analysis, competitor analysis, marketing plan, product description, company background, mission statement, executive summary.

Evolving Technological Changes Ppt Slides
This is a evolving technological changes ppt slides. This is a three stage process. The stages in this process are evolving technological changes, competitors are large with greater financial resources, rule changes by card associated changes.

Customer Relationship Powerpoint Slide Background Designs
This is a customer relationship powerpoint slide background designs. This is a five stage process. The stages in this process are internal processes, financial measures, learning and growth, traditional strategic management, customer relationship.
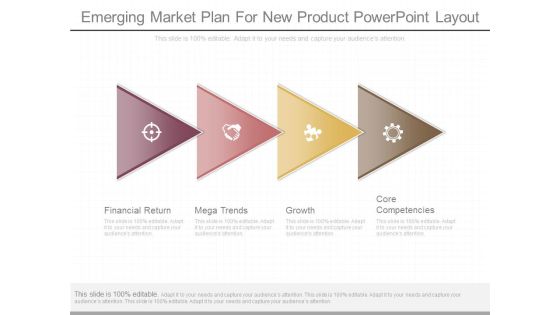
Emerging Market Plan For New Product Powerpoint Layout
This is a emerging market plan for new product powerpoint layout. This is a four stage process. The stages in this process are financial return, mega trends, growth, core competencies.

Lower Costs Powerpoint Show
This is a lower costs powerpoint show. This is a six stage process. The stages in this process are learning and growth perspective, lower costs, product offering, financial perspective, customer perspective, business process perspective.

Objectives Of Corporate Governance Ppt Diagrams
This is a objectives of corporate governance ppt diagrams. This is a five stage process. The stages in this process are legal and financial discipline, delivering values, accountability, transparency, stakeholder analysis.

Administrative Management Powerpoint Guide
This is a administrative management powerpoint guide. This is a four stage process. The stages in this process are credit and assurance, internal risk management and mitigation, administrative management, federal financial assistance.
