AI PPT Maker
Templates
PPT Bundles
Design Services
Business PPTs
Business Plan
Management
Strategy
Introduction PPT
Roadmap
Self Introduction
Timelines
Process
Marketing
Agenda
Technology
Medical
Startup Business Plan
Cyber Security
Dashboards
SWOT
Proposals
Education
Pitch Deck
Digital Marketing
KPIs
Project Management
Product Management
Artificial Intelligence
Target Market
Communication
Supply Chain
Google Slides
Research Services
 One Pagers
All Categories
-
Home
- Customer Favorites
- Revenue
Revenue

Business Diagram Data Driven Pie Chart Inside The Magnifier PowerPoint Slide
This business slide displays 3d colorful pie graph with magnifier. This diagram is a data visualization tool that gives you a simple way to present statistical information. This slide helps your audience examine and interpret the data you present.
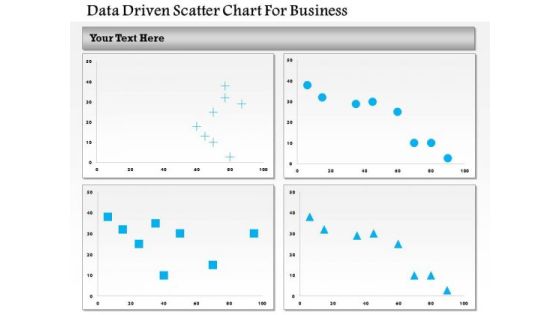
Business Diagram Data Driven Scatter Chart For Business PowerPoint Slide
This business diagram has been designed with four comparative charts. This slide suitable for data representation. You can also use this slide to present business analysis and reports. Use this diagram to present your views in a wonderful manner.
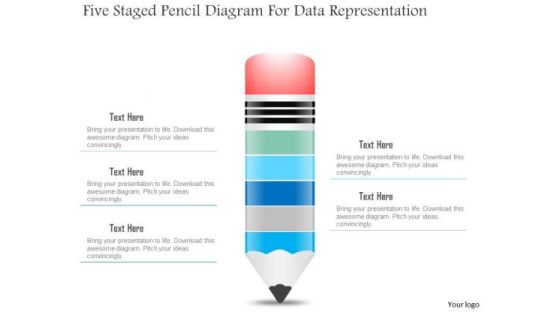
Business Diagram Five Staged Pencil Diagram For Data Representation PowerPoint Slide
This business slide displays five staged pencil diagram. It contains pencil graphic divided into five parts. This diagram slide depicts processes, stages, steps, points, options and education information display. Use this diagram, in your presentations to express your views innovatively.

Business Diagram Five Staged Timeline Diagram For Business PowerPoint Slide
This PowerPoint template displays five points timeline diagram. This business diagram has been designed with graphic of timeline with five points, text space and start, end points. Use this diagram, in your presentations to display process steps, stages, timelines and business management. Make wonderful presentations using this business slide.
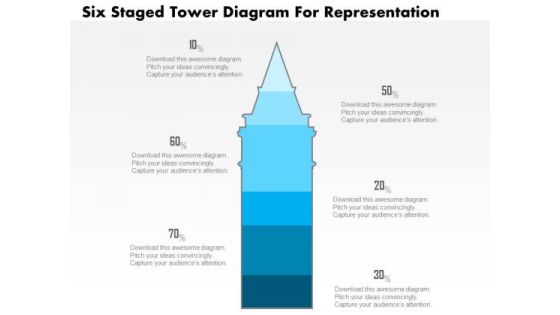
Business Diagram Five Staged Tower Diagram For Representation PowerPoint Slide
This business slide displays five staged tower diagram. It contains blue tower graphic divided into five parts. This diagram slide depicts processes, stages, steps, points, options information display. Use this diagram, in your presentations to express your views innovatively.
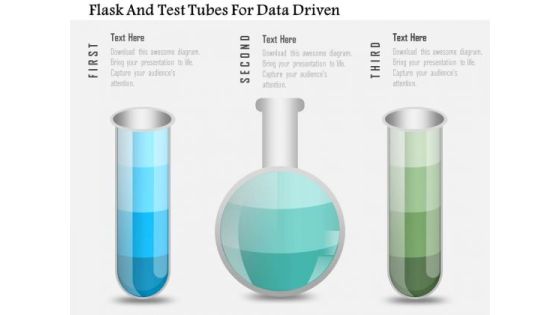
Business Diagram Flask And Test Tubes For Data Driven PowerPoint Slide
This data driven diagram has been designed with flask and test tubes. Download this diagram to give your presentations more effective look. It helps in clearly conveying your message to clients and audience.

Business Diagram Flask With Data Driven Chart PowerPoint Slide
This data driven diagram has been designed with flask graphics. Download this diagram to give your presentations more effective look. It helps in clearly conveying your message to clients and audience.
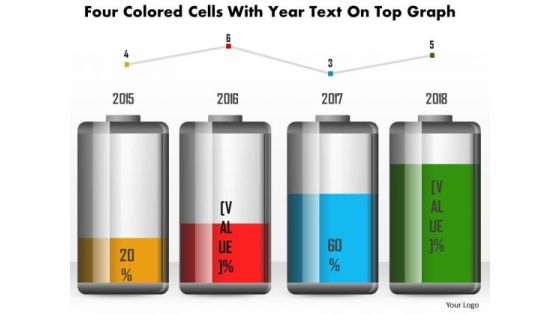
Business Diagram Four Colored Cells With Year Text On Top Graph PowerPoint Slide
This business diagram has been designed with battery cell graphic for business timeline. This slide can be used for business planning and management. Use this diagram for your business and success milestones related presentations.
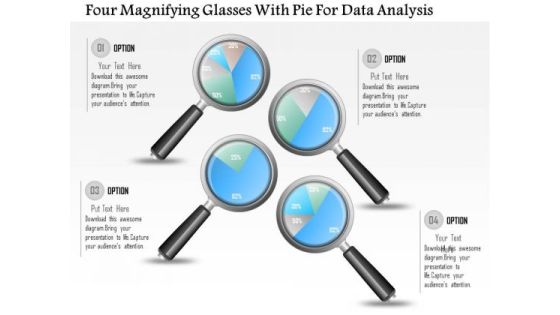
Business Diagram Four Magnifying Glasses With Pie For Data Analysis PowerPoint Slide
This business diagram displays graphic of pie charts in shape of magnifying glasses This business slide is suitable to present and compare business data. Use this diagram to build professional presentations for your viewers.
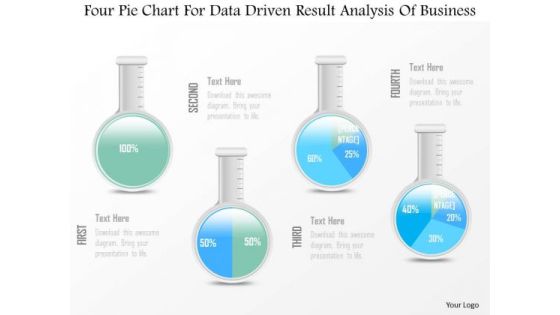
Business Diagram Four Pie Chart For Data Driven Result Analysis Of Business PowerPoint Slide
This business diagram displays graphic of pie charts in shape of flasks. This business slide is suitable to present and compare business data. Use this diagram to build professional presentations for your viewers.
Business Diagram Green Battery Cell With Full Charging Symbol PowerPoint Slide
This business diagram displays full battery charge icon. Use this diagram, in your presentations to display energy saving, battery and technology. Create professional presentations using this diagram slide.
Business Diagram Hour Glass With 3d Man And Icons PowerPoint Slide
This diagram displays 3d man with hour glass and icons. This diagram contains concept of communication and technology. Use this diagram to display business process workflows in any presentations.
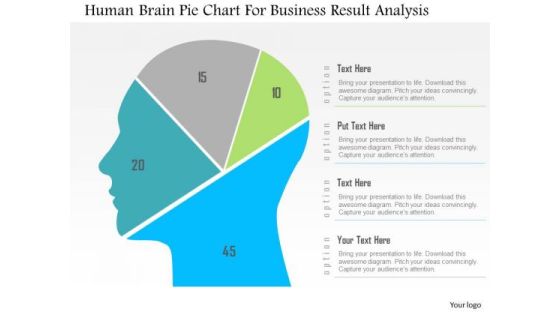
Business Diagram Human Brain Pie Chart For Business Result Analysis PowerPoint Slide
This diagram displays human face graphic divided into sections. This section can be used for data display. Use this diagram to build professional presentations for your viewers.
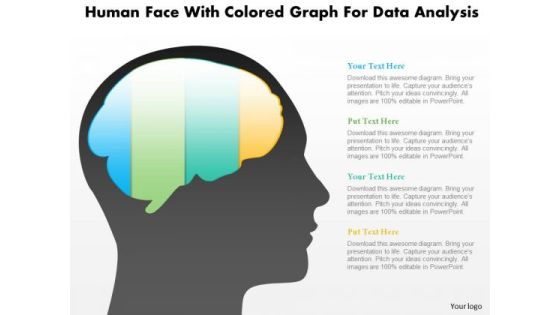
Business Diagram Human Face With Colored Graph For Data Analysis PowerPoint Slide
This diagram displays human face graphic with colored graph. This diagram can be used to represent strategy, planning, thinking of business plan. Display business options in your presentations by using this creative diagram.
Business Diagram Human Icons With Bubbles And Different Icons Inside PowerPoint Slide
This diagram displays graph with percentage value growth. This business slide is suitable to present and compare business data. Use this diagram to build professional presentations for your viewers.

Business Diagram Human Mind Diagram With Pie Graph For Representation PowerPoint Slide
This diagram displays human face graphic divided into sections. This section can be used for data display. Use this diagram to build professional presentations for your viewers.

Business Diagram Laptop With Data Driven Area Chart PowerPoint Slide
This diagram has been designed with laptop and data driven area chart. Download this diagram to give your presentations more effective look. It helps in clearly conveying your message to clients and audience.
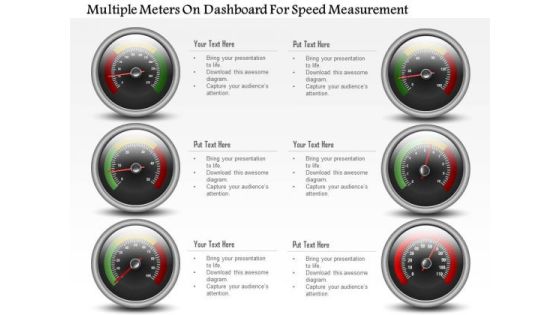
Business Diagram Multiple Meters On Dashboard For Speed Measurement PowerPoint Slide
This business diagram has been designed with multiple meters on dashboard. This slide can be used for business planning and progress. Use this diagram for your business and success milestones related presentations.

Business Diagram Six Staged Pie Charts For Text Representation PowerPoint Slide
This slide displays graphic six staged pie charts. Download this diagram to present and compare business data. Use this diagram to display business process workflows in any presentation.

Business Diagram Tablet With Pie And Business Bar Graph For Result Analysis PowerPoint Slide
This PowerPoint template displays technology gadgets with various business charts. Use this diagram slide, in your presentations to make business reports for statistical analysis. You may use this diagram to impart professional appearance to your presentations.
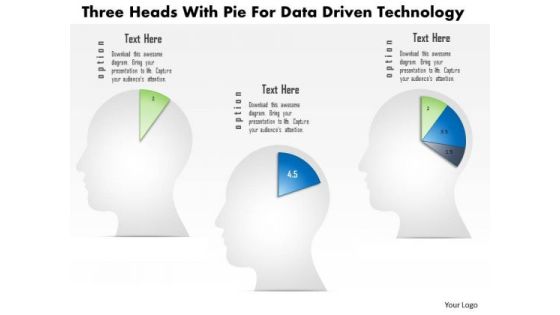
Business Diagram Three Heads With Pie For Data Driven Technology PowerPoint Slide
This business diagram displays three human faces with pie charts. This Power Point template has been designed to compare and present business data. You may use this diagram to impart professional appearance to your presentations.

Business Diagram Three Staged Pencil Diagram For Graph Formation PowerPoint Slide
This business diagram displays set of pencils. This Power Point template has been designed to compare and present business data. Download this diagram to represent stages of business growth.

Business Diagram Four Steps With 3d Business Person Standing Over It PowerPoint Slide
This business diagram displays bar graph with business person standing on it. This Power Point template has been designed to display personal growth. You may use this diagram to impart professional appearance to your presentations.
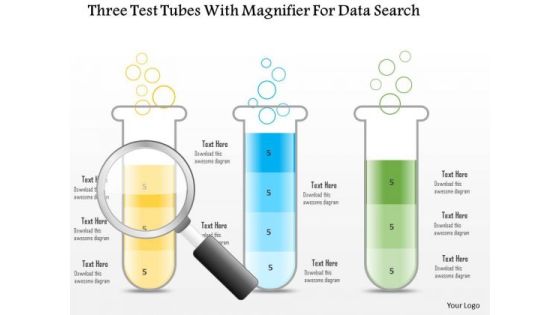
Business Diagram Three Test Tubes With Magnifier For Data Search PowerPoint Slide
This business diagram displays three test tubes with magnifying glass. This diagram is suitable to depict flow of business activities or steps. Download this professional slide to present information in an attractive manner.
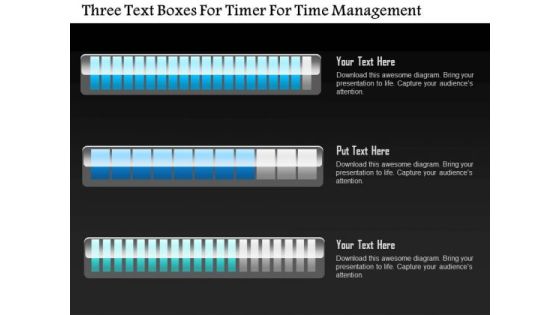
Business Diagram Three Text Boxes For Timer For Time Management PowerPoint Slide
This business diagram displays three text boxes. This diagram contains text boxes for data representation. Use this diagram to display business process workflows in any presentations.

Business Diagram Three Trucks For Data Representation For Business PowerPoint Slide
This business diagram displays three trucks graphic. This diagram contains trucks for percentage value growth. Use this diagram to display business growth over a period of time.

Business Diagram Two Tablets With Growth Bar Graph Data Driven PowerPoint Slide
This business diagram has been designed with comparative charts on tablets. This slide suitable for data representation. You can also use this slide to present business reports and information. Use this diagram to present your views in a wonderful manner.

Infographic Bar Chart For Business Practices Powerpoint Template
The PowerPoint template displays infographic of bar chart. This diagram has been professionally designed to display business practices. Grab centre stage with this diagram slide.

Bar Graph For Future Planning Powerpoint Template
This business diagram display bar graph for years 2015 and 2016. You may use this slide to display statistical analysis. This diagram provides an effective way of displaying information you can edit text, color, shade and style as per you need.

Growth Arrow On Bar Graph Infographics Powerpoint Template
This PowerPoint template has been designed with growth arrow on bar graph. You may download this diagram slide to display growth and progress concepts. Illustrate your plans to your listeners with this impressive template.
3D Men Icon With Percentage Values Powerpoint Templates
This PowerPoint template contains graphics of 3d men icons with percentage values. You may use this diagram for concepts of growth, progress and success. Communicate effectively with your group through this slide.

Truck Design With Percentage Values Powerpoint Template
Our compelling template consists with truck design with percentage values. This PPT slide has been professionally designed to exhibit transport and logistics concepts. This template offers an excellent background to build impressive presentation.
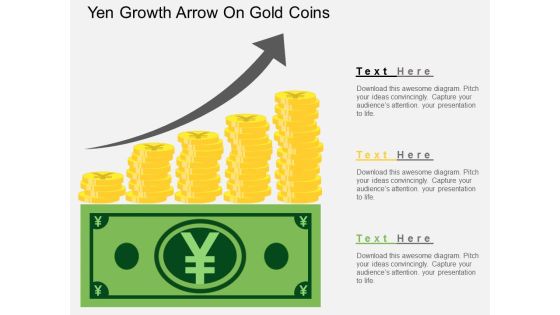
Yen Growth Arrow On Gold Coins Powerpoint Template
This PowerPoint template has been designed with Yen growth arrow on gold coins. Download this business slide to depict Yen currency growth in international market. Accelerate the impact of your ideas using this template.
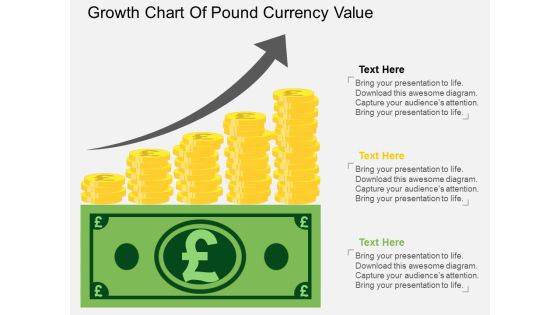
Growth Chart Of Pound Currency Value Powerpoint Template
The above PPT template displays growth chart of Pound currency. This diagram helps to exhibit Pound currency value growth. Adjust the above diagram in your business presentations to visually support your content.

Tablet With Bar Graph And Pie Chart Powerpoint Templates
This business slide has been designed with business graphs on computer tablet. You may download this PPT slide to display statistical analysis. This slide will help you to sequence your thoughts.
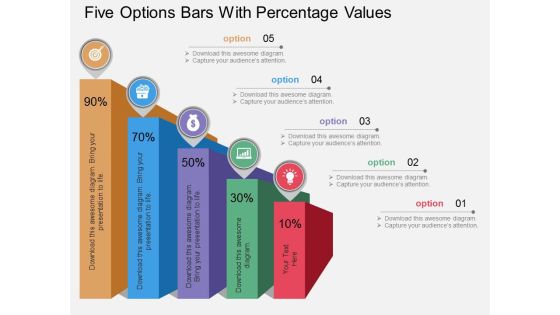
Five Options Bars With Percentage Values Powerpoint Template
Our professionally designed business diagram is as an effective tool for communicating ideas and planning. It contains five options bars with percentage values. Convey your views with this diagram slide. It will amplify the strength of your logic.
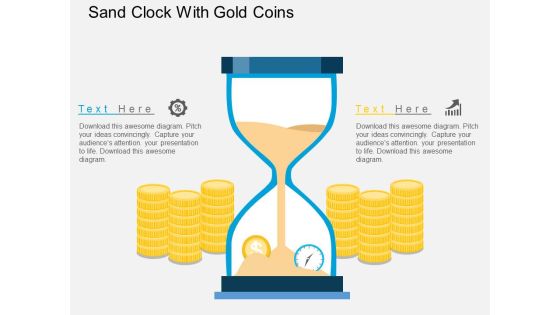
Sand Clock With Gold Coins Powerpoint Template
Our professionally designed business diagram is as an effective tool for communicating business ideas and strategies for corporate planning. This PPT slide contains sand clock with gold coins. Download this template to build interactive presentation.
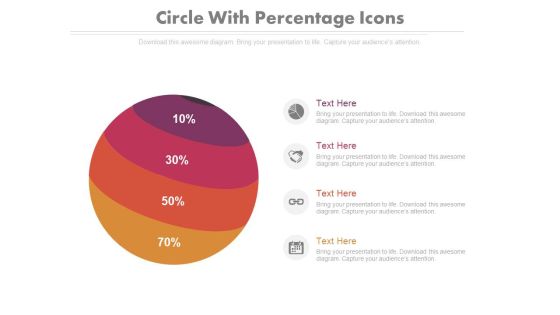
Four Parts Circle Chart With Percentage Ratio Powerpoint Slides
This PowerPoint template contains four parts circle chart with percentage ratio. You may download this PPT slide design to display your ideas in visual manner. You can easily customize this template to make it more unique as per your need.
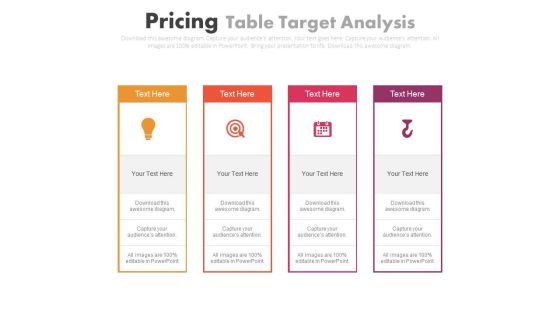
Four Steps Of Idea And Target Planning Powerpoint Slides
This PowerPoint template contains infographic diagram of display board. You may download this PPT slide design to display four ideas of target planning. You can easily customize this template to make it more unique as per your need.

Hand Holding Hammer Over A Piggy Bank Powerpoint Templates
Our above business diagram displays vertical process infographic layout. This slide is suitable for to depict marketing and sales steps. Use this business diagram to present your work in a more smart and precise manner.
Commercial Goals Branded Content Ppt Sample
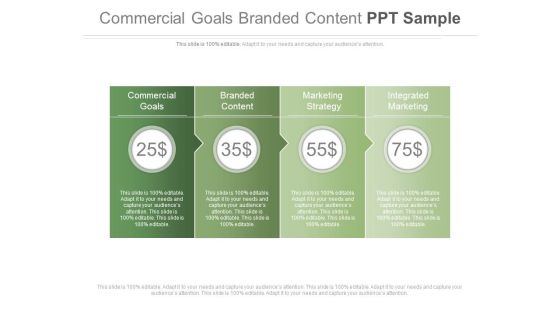
This is a commercial goals branded content ppt sample. This is a four stage process. The stages in this process are success, marketing, business and finance.
Strategic Marketing Segmentation Strategy Ppt Slide
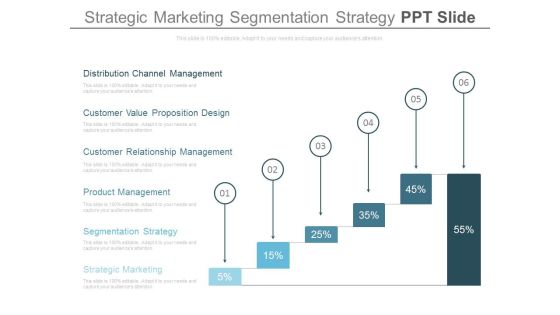
This is a strategic marketing segmentation strategy ppt slide. This is a six stages process. The stage in this process are marketing, business, success, finance.\n

Strategy Marketing Pyramid Corporate Strategy Ppt Sample
This is a strategy marketing pyramid corporate strategy ppt sample. This is a four stages process. The stage in this process are circle charts, marketing, business, Finance.\n\n .\n
Map Africa Ppt Slide
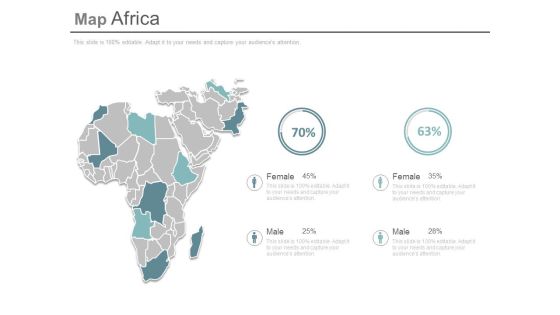
This is a map africa ppt slide. This is a one stage process. The stages in this process are geographical, finanace, success, business.

Feasible Set Of Portfolio Ppt Slides
This is a feasible set of portfolio ppt slides. This is a one stage process. The stages in this process are success, business, time Planning.

Seller Portals Seller Requirements Ppt Example
This is a seller portals seller requirements ppt example. This is a four stage process. The stages in this process are globe, finance, business, marketing.

High Volume Build Great Products Ppt Presentation
This is a high volume build great products ppt presentation. This is a four stage process. The stages in this process are finance, business, marketing, success.

Market Opportunity Analysis Powerpoint Slide Design Ideas
This is a market opportunity analysis powerpoint slide design ideas. This is a five stage process. The stages in this process are market opportunity analysis, market sizing and forecasting, market landscape analysis, trends analysis, market alerts newsletters.

Client Relationship Management Powerpoint Slides Design
This is a client relationship management powerpoint slides design. This is a three stage process. The stages in this process are business process management, finance accounting, client relationship management.

Strategic Intent Which Develops Ppt Slides
This is a strategic intent which develops ppt slides. This is a five stage process. The stages in this process are organizational improvement, environmental assessment drives, goal deployment and alignment, strategic intent which develops, critical goals.

Report Marketing Analysis Diagram Powerpoint Ideas
This is a report marketing analysis diagram powerpoint ideas. This is a five stage process. The stages in this process are man, communication, board, graph, business.
Market Research And Statistics Ppt Sample Presentations
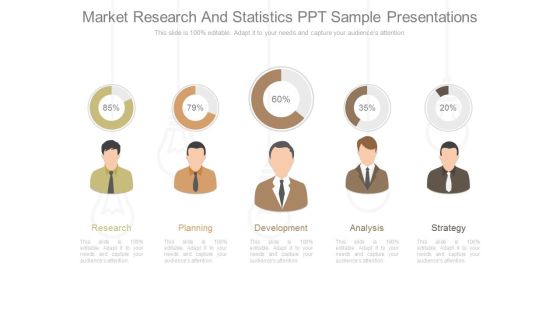
This is a market research and statistics ppt sample presentations. This is a five stage process. The stages in this process are research, planning, development, analysis, strategy.

Scorecard Reporting Template Ppt Slide
This is a scorecard reporting template ppt slide. This is a five stage process. The stages in this process are goals, measures, targets, frequency, source.
Face To Face Communication Diagram Presentation Design
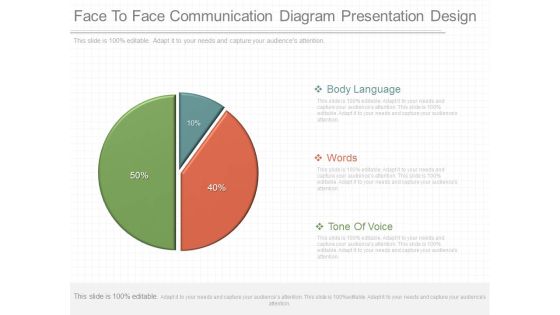
This is a face to face communication diagram presentation design. This is a three stage process. The stages in this process are body language, words, tone of voice.

Crowd Sourcing International Business Ppt Diagram
This is a crowd sourcing international business ppt diagram. This is a five stage process. The stages in this process are strategy, focus groups, views and ideas, values, survey.\n\n\n
Identify Key Operational Powerpoint Slide Download
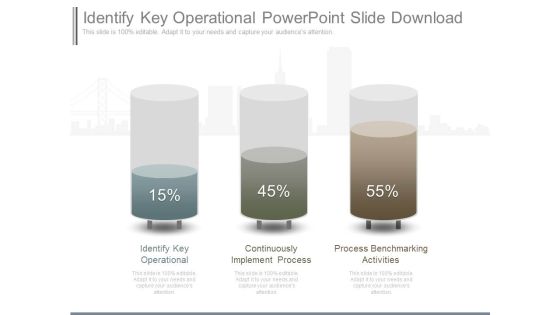
This is a identify key operational powerpoint slide download. This is a three stage process. The stages in this process are identify key operational, continuously implement process, process benchmarking activities.\n\n\n\n\n

Business Reengineering Definition And Principles Slide Graphics
This is a business reengineering definition and principles slide graphics. This is a six stage process. The stages in this process are business reengineering definition and principles, business reengineering examples, business reengineering framework, business reengineering project life cycle, business reengineering teams and infrastructures, total quality management business reengineering.

Cost Analysis Powerpoint Slide Background Picture
This is a cost analysis powerpoint slide background picture. This is a four stage process. The stages in this process are cost analysis, cost prediction, workflow processes, monitoring and escalation.

Corporate Dashboard Template Presentation Portfolio
This is a corporate dashboard template presentation portfolio. This is a five stage process. The stages in this process are product, strategy, marketing, customer, management.

Accounting Key Performance Indicators Ppt Powerpoint
This is a accounting key performance indicators ppt powerpoint. This is a four stage process. The stages in this process are cost per invoice, invoice processing speed, productivity per team member, variance analysis.
