AI PPT Maker
Templates
PPT Bundles
Design Services
Business PPTs
Business Plan
Management
Strategy
Introduction PPT
Roadmap
Self Introduction
Timelines
Process
Marketing
Agenda
Technology
Medical
Startup Business Plan
Cyber Security
Dashboards
SWOT
Proposals
Education
Pitch Deck
Digital Marketing
KPIs
Project Management
Product Management
Artificial Intelligence
Target Market
Communication
Supply Chain
Google Slides
Research Services
 One Pagers
All Categories
-
Home
- Customer Favorites
- Revenue
Revenue

B2B Sales Representatives Performance Tracking Dashboard Elements PDF
This slide provides information regarding B2B sales representatives performance tracking dashboard to measure leads by region, revenue breakdown, top performers by leads, revenues, etc. Deliver an awe inspiring pitch with this creative B2B Sales Representatives Performance Tracking Dashboard Elements PDF bundle. Topics like Revenue Actual, Sales Representatives Performance, Tracking Dashboard can be discussed with this completely editable template. It is available for immediate download depending on the needs and requirements of the user.

B2B Sales Representatives Performance Tracking Dashboard Background PDF
This slide provides information regarding B2B sales representatives performance tracking dashboard to measure leads by region, revenue breakdown, top performers by leads, revenues, etc. Deliver and pitch your topic in the best possible manner with this B2B Sales Representatives Performance Tracking Dashboard Background PDF. Use them to share invaluable insights on Individual Performance, Achieved Highest, Revenue Relative and impress your audience. This template can be altered and modified as per your expectations. So, grab it now.
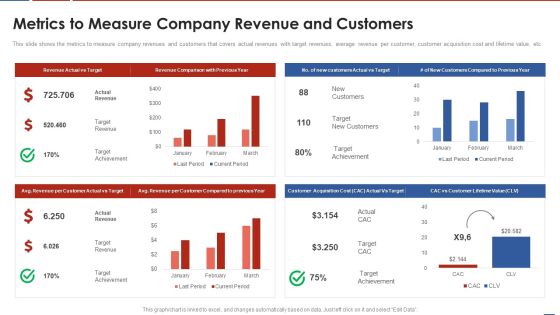
Formulating Product Development Action Plan To Enhance Client Experience Metrics To Measure Company Diagrams PDF
This slide shows the metrics to measure company revenues and customers that covers actual revenues with target revenues, average revenue per customer, customer acquisition cost and lifetime value, etc. Deliver and pitch your topic in the best possible manner with this formulating product development action plan to enhance client experience metrics to measure company diagrams pdf. Use them to share invaluable insights on target revenues, average revenue per customer, customer acquisition cost, lifetime value and impress your audience. This template can be altered and modified as per your expectations. So, grab it now.

Budgetary Comparison Of Social Media Brand Recommendation Strategies Mockup PDF
Following slide demonstrates brand endorsement budgetary comparison matrix for determining platform with maximum revenue growth. It includes platform such as Instagram, twitter, LinkedIn, snapchat and Facebook. Showcasing this set of slides titled Budgetary Comparison Of Social Media Brand Recommendation Strategies Mockup PDF. The topics addressed in these templates are Platforms, Strategy, Implementation Cost, Expected Revenue, Actual Revenue, Variance. All the content presented in this PPT design is completely editable. Download it and make adjustments in color, background, font etc. as per your unique business setting.

Income Statement Showing Financial Forecast And Essential Metrics Structure PDF
This slide displays the income statement of an organization with the projections of next year revenue and net income. It shows that there will more revenue as compared to the previous years and hence it will generate more income. Presenting Income Statement Showing Financial Forecast And Essential Metrics Structure PDF to dispense important information. This template comprises two stages. It also presents valuable insights into the topics including Revenue, Operating Expenses, Operating Income. This is a completely customizable PowerPoint theme that can be put to use immediately. So, download it and address the topic impactfully.

Financial Banking PPT Operational And Financial Overview Of The Target Company Pictures PDF
The slide provides the operational and financial details of the target company. It covers the details such as top five applications by revenue, Revenue and EBITDA Earning before, interest, tax, depreciation, and amortization from the year 2017 to 2021, and Number of apps created in last five years. Deliver and pitch your topic in the best possible manner with this financial banking ppt operational and financial overview of the target company pictures pdf. Use them to share invaluable insights on portfolio, revenue, operational and financial details and impress your audience. This template can be altered and modified as per your expectations. So, grab it now.

Analyzing Financial Performance For FY 2020 Template 24 One Pager Documents
This one pager covers details regarding the analysis of financial performance for fiscal year 2020 in terms of revenue, operating income, R AND D expenses, revenue generated by business segment, revenue generated by product categories etc. Presenting you an exemplary Analyzing Financial Performance For FY 2020 Template 24 One Pager Documents. Our one-pager comprises all the must-have essentials of an inclusive document. You can edit it with ease, as its layout is completely editable. With such freedom, you can tweak its design and other elements to your requirements. Download this Analyzing Financial Performance For FY 2020 Template 24 One Pager Documents brilliant piece now.

Analyzing Financial Performance For FY 2022 Template 185 One Pager Documents
This one pager covers details regarding the analysis of financial performance for fiscal year 2022 in terms of revenue, net income, revenue generated by business segment, revenue generated by region etc. Presenting you an exemplary Analyzing Financial Performance For FY 2022 Template 185 One Pager Documents. Our one-pager comprises all the must-have essentials of an inclusive document. You can edit it with ease, as its layout is completely editable. With such freedom, you can tweak its design and other elements to your requirements. Download this Analyzing Financial Performance For FY 2022 Template 185 One Pager Documents brilliant piece now.

Analyzing Financial Performance For FY 2022 Template 229 One Pager Documents
This one pager covers details regarding the analysis of financial performance for fiscal year 2022 in terms of revenue, operating income, R AND D expenses, revenue generated by business segment, revenue generated by product categories etc. Presenting you an exemplary Analyzing Financial Performance For FY 2022 Template 229 One Pager Documents. Our one-pager comprises all the must-have essentials of an inclusive document. You can edit it with ease, as its layout is completely editable. With such freedom, you can tweak its design and other elements to your requirements. Download this Analyzing Financial Performance For FY 2022 Template 229 One Pager Documents brilliant piece now.

Financial Report Of An IT Firm Financials Comparison Of The Company With Its Competitors Portrait PDF
The slide provides companys financial comparison with its top fiver competitors on the basis of 2023 financials Revenue, Operating Income, employee count, R and D expenses etc.Deliver and pitch your topic in the best possible manner with this Financial Report Of An IT Firm Financials Comparison Of The Company With Its Competitors Portrait PDF Use them to share invaluable insights on Operating Profit, Revenue Employee, Expenses Revenue and impress your audience. This template can be altered and modified as per your expectations. So, grab it now.

Earning Potential From Corporate Mergers And Acquisitions Clipart PDF
This slide illustrates profit generated from mergers and acquisitions in last 5 years and future profit potential from similar deals. It includes closed transactions, revenue generation, revenue growth etc. Presenting Earning Potential From Corporate Mergers And Acquisitions Clipart PDF to dispense important information. This template comprises five stages. It also presents valuable insights into the topics including Operating Profit, Acquired Business, Revenue Generated. This is a completely customizable PowerPoint theme that can be put to use immediately. So, download it and address the topic impactfully.

Analyzing Financial Performance For FY 2022 Template 247 One Pager Documents
This one pager covers details regarding the analysis of financial performance for fiscal year 2022 in terms of revenue, net profit, revenue generated by business segment, revenue generated by region etc. Presenting you an exemplary Analyzing Financial Performance For FY 2022 Template 247 One Pager Documents. Our one-pager comprises all the must-have essentials of an inclusive document. You can edit it with ease, as its layout is completely editable. With such freedom, you can tweak its design and other elements to your requirements. Download this Analyzing Financial Performance For FY 2022 Template 247 One Pager Documents brilliant piece now.
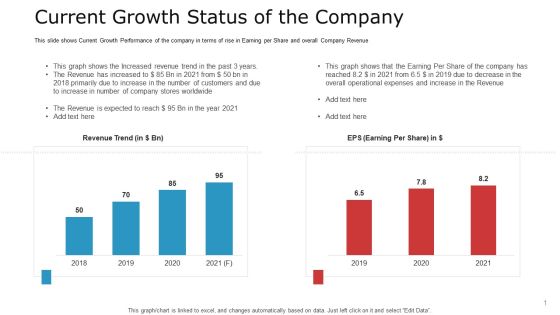
Pitch Deck To Raise Capital From Commercial Financial Institution Using Bonds Current Growth Status Of The Company Guidelines PDF
This slide shows Current Growth Performance of the company in terms of rise in Earning per Share and overall Company Revenue Deliver and pitch your topic in the best possible manner with this pitch deck to raise capital from commercial financial institution using bonds current growth status of the company guidelines pdf. Use them to share invaluable insights on the revenue is expected to reach dollar 95 bn in the year 2021, increase in the revenue, operational expenses and impress your audience. This template can be altered and modified as per your expectations. So, grab it now.

Commercial Banking Template Collection Operational And Financial Overview Of The Target Company Inspiration PDF
The slide provides the operational and financial details of the target company. It covers the details such as top five applications by revenue Revenue and EBITDA Earning before, interest, tax, depreciation, and amortization from the year 2016 to 2020 and Number of apps created in last five years. Deliver an awe-inspiring pitch with this creative commercial banking template collection operational and financial overview of the target company inspiration pdf bundle. Topics like financial highlight, revenue and ebitda, app portfolio can be discussed with this completely editable template. It is available for immediate download depending on the needs and requirements of the user.
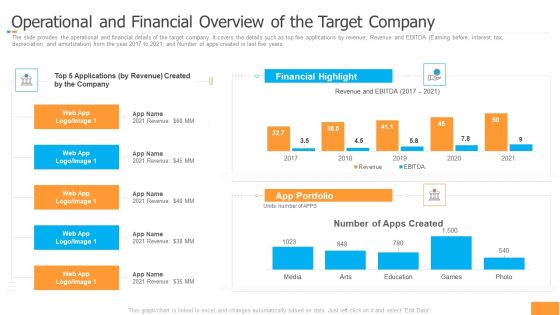
Funding Pitch Book Outline Operational And Financial Overview Of The Target Company Portrait PDF
The slide provides the operational and financial details of the target company. It covers the details such as top five applications by revenue Revenue and EBITDA Earning before, interest, tax, depreciation, and amortization from the year 2016 to 2020 and Number of apps created in last five years. Deliver an awe inspiring pitch with this creative funding pitch book outline operational and financial overview of the target company portrait pdf bundle. Topics like portfolio, financial, revenue can be discussed with this completely editable template. It is available for immediate download depending on the needs and requirements of the user.
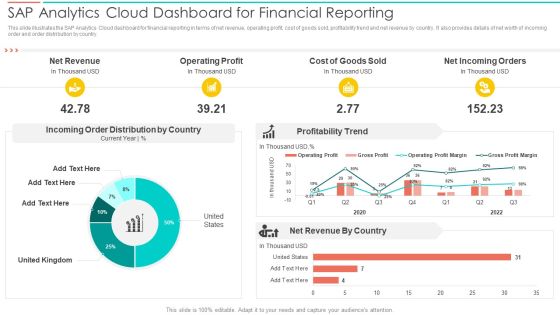
SAC Planning And Implementation SAP Analytics Cloud Dashboard For Financial Reporting Introduction PDF
This slide illustrates the SAP Analytics Cloud dashboard for financial reporting in terms of net revenue, operating profit, cost of goods sold, profitability trend and net revenue by country. It also provides details of net worth of incoming order and order distribution by country. Deliver an awe inspiring pitch with this creative SAC Planning And Implementation SAP Analytics Cloud Dashboard For Financial Reporting Introduction PDF bundle. Topics like Net Revenue, Operating Profit, Cost Goods Sold can be discussed with this completely editable template. It is available for immediate download depending on the needs and requirements of the user.

Pharmaceutical And Clinical Research Summary Executive Summary Guidelines PDF
The slide describes brief company details which depict company outline, key statistics and financial overview. The major facts covered are number of regulatory approvals, employee count, global market share, revenue CAGR, market capitalization and total revenue. This is a Pharmaceutical And Clinical Research Summary Executive Summary Guidelines PDF template with various stages. Focus and dispense information on six stages using this creative set, that comes with editable features. It contains large content boxes to add your information on topics like Revenue, Gross Profit, Net Profit. You can also showcase facts, figures, and other relevant content using this PPT layout. Grab it now.
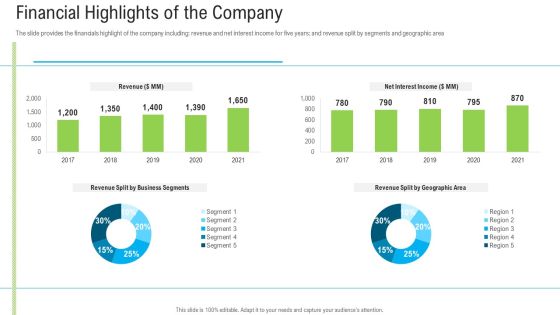
Pitch Deck To Raise Funding From Secondary Market Financial Highlights Of The Company Sample PDF
The slide provides the financials highlight of the company including revenue and net interest income for five years and revenue split by segments and geographic area. Deliver and pitch your topic in the best possible manner with this pitch deck to raise funding from secondary market financial highlights of the company sample pdf. Use them to share invaluable insights on revenue, net interest income, financial highlights of the company and impress your audience. This template can be altered and modified as per your expectations. So, grab it now.
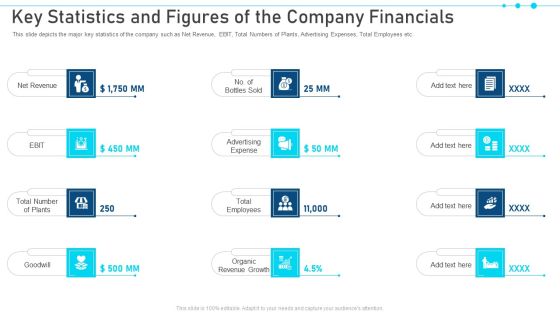
Key Statistics And Figures Of The Company Financials Information PDF
This slide depicts the major key statistics of the company such as Net Revenue, EBIT, Total Numbers of Plants, Advertising Expenses, Total Employees etc. This is a key statistics and figures of the company financials information pdf. template with various stages. Focus and dispense information on tweleve stages using this creative set, that comes with editable features. It contains large content boxes to add your information on topics like net revenue, ebit, total number of plants, goodwill, organic revenue growth. You can also showcase facts, figures, and other relevant content using this PPT layout. Grab it now.

Corporate Sales Capability And Financial Forecast Dashboard Download PDF
This slide illustrates facts and figures related to expected revenue generation in upcoming months in a corporation. It includes expected sales revenue for FY23, yearly sales revenue etc. Showcasing this set of slides titled Corporate Sales Capability And Financial Forecast Dashboard Download PDF. The topics addressed in these templates are Corporate Sales, Capability And Financial, Forecast Dashboard. All the content presented in this PPT design is completely editable. Download it and make adjustments in color, background, font etc. as per your unique business setting

Competitors Global Market Share And Earnings Comparative Analysis Report Slides PDF
This slide covers comparison matrix of company and competitors market share and revenue. It also includes pie chart depicting the total global revenue market share. Showcasing this set of slides titled Competitors Global Market Share And Earnings Comparative Analysis Report Slides PDF. The topics addressed in these templates are Revenue, Global Market Share, Earnings Comparative Analysis Report. All the content presented in this PPT design is completely editable. Download it and make adjustments in color, background, font etc. as per your unique business setting.

Unit Market And Earnings Share From Brand Product Sales Clipart PDF
This slide covers market share and revenue earned from multi brands. It also includes number of sales along with percentage of revenue market share. Pitch your topic with ease and precision using this Unit Market And Earnings Share From Brand Product Sales Clipart PDF. This layout presents information on Unit Sales, Unit Market Share, Sales Revenue. It is also available for immediate download and adjustment. So, changes can be made in the color, design, graphics or any other component to create a unique layout.
Basic Income Enablement Of Execution Model Information PDF
The following slide outlines a revenue execution model of basic enablement aimed to increase revenue and reduce costs to bring significant impact on business goals. It covers defining enablement of revenue goals, identify methods, assess situations, implement change and measure outcomes. Presenting Basic Income Enablement Of Execution Model Information PDF to dispense important information. This template comprises five stages. It also presents valuable insights into the topics including Assess Situations, Measure Outcomes, Implement Changes. This is a completely customizable PowerPoint theme that can be put to use immediately. So, download it and address the topic impactfully.

Logistics And Supply Chain Platform Funding Pitch Deck Financial Performance Diagrams PDF
Mentioned slide provides insights into increase business revenue over the years. It includes revenue in MM and year of revenue growth Boost your pitch with our creative Logistics And Supply Chain Platform Funding Pitch Deck Financial Performance Diagrams PDF. Deliver an awe-inspiring pitch that will mesmerize everyone. Using these presentation templates you will surely catch everyones attention. You can browse the ppts collection on our website. We have researchers who are experts at creating the right content for the templates. So you do not have to invest time in any additional work. Just grab the template now and use them.
Web Designing Icon Investor Funding Elevator Pitch Deck Financial Projection Clipart PDF
Following slide showcases anticipated business revenue growth for next 4 years. It includes revenue in USD and annual forecasted revenue. This modern and well arranged Web Designing Icon Investor Funding Elevator Pitch Deck Financial Projection Clipart PDF provides lots of creative possibilities. It is very simple to customize and edit with the Powerpoint Software. Just drag and drop your pictures into the shapes. All facets of this template can be edited with Powerpoint no extra software is necessary. Add your own material, put your images in the places assigned for them, adjust the colors, and then you can show your slides to the world, with an animated slide included.
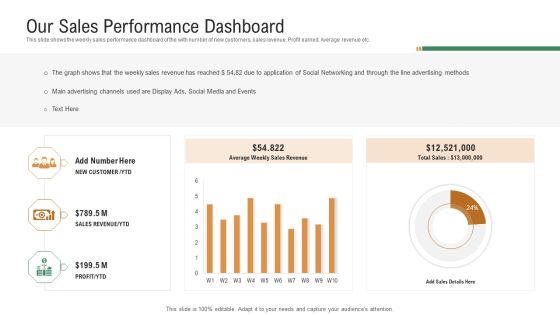
Investor Pitch Deck To Generate Venture Capital Funds Our Sales Performance Dashboard Ppt Show Format PDF
This slide shows the weekly sales performance dashboard of the with number of new customers, sales revenue, Profit earned, Average revenue etc. Deliver and pitch your topic in the best possible manner with this investor pitch deck to generate venture capital funds our sales performance dashboard ppt show format pdf. Use them to share invaluable insights on sales revenue, profit, main advertising channels, social networking, advertising methods and impress your audience. This template can be altered and modified as per your expectations. So, grab it now.

AI Investor Financing Pitch Deck Traction Market Sizing AI Ppt Styles Portfolio PDF
This template covers the product market fit in market research. Market pull into additional verticals. This is a ai investor financing pitch deck traction market sizing ai ppt styles portfolio pdf template with various stages. Focus and dispense information on three stages using this creative set, that comes with editable features. It contains large content boxes to add your information on topics like revenue market research, revenue human resources, revenue media and entertainment. You can also showcase facts, figures, and other relevant content using this PPT layout. Grab it now.

Fundraising From Corporate Investment Key Statistics And Figures Of The Company Rules PDF
This slide depicts the major key statistics of the company such as Net Revenue, EBIT, Total Numbers of Plants, Advertising Expenses, Total Employees etc. This is a fundraising from corporate investment key statistics and figures of the company rules pdf template with various stages. Focus and dispense information on twelve stages using this creative set, that comes with editable features. It contains large content boxes to add your information on topics like net revenue, advertising expense, total employees, organic revenue growth. You can also showcase facts, figures, and other relevant content using this PPT layout. Grab it now.

Unschool Platform Business Profile Executive Summary Icons PDF
The slide highlights the executive summary of Unschool Learning platform. It shows company outline, company resources industry experts, internship partners, and active learners, revenue and upcoming courses. This is a Revenue, Industry Experts, Industry Demands template with various stages. Focus and dispense information on five stages using this creative set, that comes with editable features. It contains large content boxes to add your information on topics like Revenue, Industry Experts, Industry Demands. You can also showcase facts, figures, and other relevant content using this PPT layout. Grab it now.

Strategies To Design An Effective Income Generation Strategy For New Ventures Formats PDF
This slide covers different techniques to build revenue models for small and medium enterprises. It includes ideal revenue model, limit projections to limited timeframe, attracts potential investors and mitigate for variables. Presenting Strategies To Design An Effective Income Generation Strategy For New Ventures Formats PDF to dispense important information. This template comprises four stages. It also presents valuable insights into the topics including Attract Potential Investors, Ideal Revenue Model, Mitigate For Variables. This is a completely customizable PowerPoint theme that can be put to use immediately. So, download it and address the topic impactfully.

Clinical Services Company Profile Executive Summary Ideas PDF
The slide describes brief company details which depict company outline, key statistics and financial overview. The major facts covered are number of regulatory approvals, employee count, global market share, revenue CAGR, market capitalization and total revenue. Presenting Clinical Services Company Profile Executive Summary Ideas PDF to provide visual cues and insights. Share and navigate important information on one stages that need your due attention. This template can be used to pitch topics like Gross Profit, Revenue, Global Market. In addtion, this PPT design contains high resolution images, graphics, etc, that are easily editable and available for immediate download.

Business Executive Summary KPI Dashboard For Year 2023 Graphics PDF
The following slide highlights the overall business performance for the financial year 2021 to assess variations and trace accuracy. It includes KPIs such as total income, expenditures, revenue and expense breakdown, fund structure etc. Pitch your topic with ease and precision using this Business Executive Summary KPI Dashboard For Year 2023 Graphics PDF. This layout presents information on Revenue Breakdown, Revenue Category, Expense Breakdown. It is also available for immediate download and adjustment. So, changes can be made in the color, design, graphics or any other component to create a unique layout.
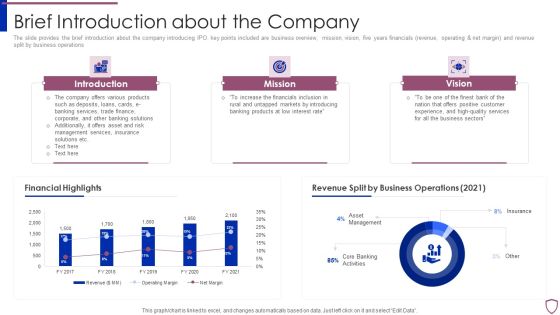
Financing Catalogue For Security Underwriting Agreement Brief Introduction About The Company Structure PDF
The slide provides the brief introduction about the company introducing IPO. key points included are business overview, mission, vision, five years financials revenue, operating and net margin and revenue split by business operations. Deliver an awe inspiring pitch with this creative financing catalogue for security underwriting agreement brief introduction about the company structure pdf bundle. Topics like introduction, mission, vision, financial highlights, revenue split by business operations can be discussed with this completely editable template. It is available for immediate download depending on the needs and requirements of the user.

Pitch Book For Investor Funding Contract Brief Introduction About The Company Portrait PDF
The slide provides the brief introduction about the company introducing IPO. key points included are business overview, mission, vision, five years financials revenue, operating and net margin and revenue split by business operations. Deliver an awe inspiring pitch with this creative pitch book for investor funding contract brief introduction about the company portrait pdf bundle. Topics like financial highlights, revenue, services, management can be discussed with this completely editable template. It is available for immediate download depending on the needs and requirements of the user.

Fiverr Capital Fundraising Fiverr At A Glance Ppt Infographics Slideshow PDF
This slide provides information in brief about some of the statistics of Fiverr such as revenue, number of buyers and sellers, revenue growth rate, geographical presence, number of categories etc. Presenting Fiverr Capital Fundraising Fiverr At A Glance Ppt Infographics Slideshow PDF to provide visual cues and insights. Share and navigate important information on eight stages that need your due attention. This template can be used to pitch topics like Buyers Since Inception, Sellers Since Inception, Revenue Existing Cohort. In addtion, this PPT design contains high resolution images, graphics, etc, that are easily editable and available for immediate download.
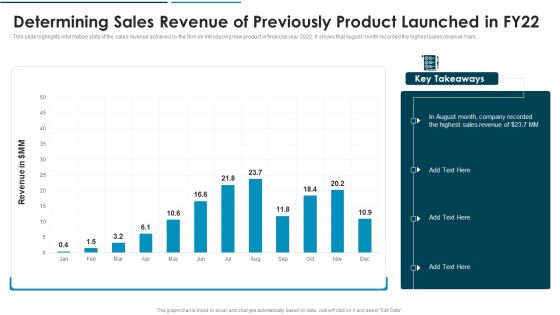
Go To Market Approach For New Product Product Launched In FY22 Inspiration PDF
This slide highlights information stats of the sales revenue achieved by the firm on introducing new product in financial year 2022. It shows that August month recorded the highest sales revenue mark.Deliver and pitch your topic in the best possible manner with this Go To Market Approach For New Product Product Launched In FY22 Inspiration PDF Use them to share invaluable insights on Determining Sales Revenue Of Previously Product Launched In Fy22 and impress your audience. This template can be altered and modified as per your expectations. So, grab it now.

Marketing Agency Company Outline Key Statistics Structure PDF
The following slide highlights the financial statistics for the year 2021. The stats show the change in global data and insights revenue, total revenue, EBITDA, SaaS platform revenue and operating net cash flow. The Marketing Agency Company Outline Key Statistics Structure PDF is a compilation of the most recent design trends as a series of slides. It is suitable for any subject or industry presentation, containing attractive visuals and photo spots for businesses to clearly express their messages. This template contains a variety of slides for the user to input data, such as structures to contrast two elements, bullet points, and slides for written information. Slidegeeks is prepared to create an impression.

Retail Weekly Sales Performance Report Dashboard To Measure Performance Ppt Gallery File Formats PDF
The following slide exhibits dashboard for small-scale retailers and product sales for chosen time period. It presents information related to revenue breakdown, total income, etc. Showcasing this set of slides titled Retail Weekly Sales Performance Report Dashboard To Measure Performance Ppt Gallery File Formats PDF. The topics addressed in these templates are Revenue Breakdown, Total Income, Total Revenue. All the content presented in this PPT design is completely editable. Download it and make adjustments in color, background, font etc. as per your unique business setting.
Monthly Sales Performance Tracking And Monitoring Dashboard Diagrams PDF
This slide showcases a dashboard presenting various metrics to measure and analyze sales performance for revenue growth. It includes key components such as number of sales, revenue, profit, cost, sales revenue, sales increment, cost analysis and cross sell. Make sure to capture your audiences attention in your business displays with our gratis customizable Monthly Sales Performance Tracking And Monitoring Dashboard Diagrams PDF. These are great for business strategies, office conferences, capital raising or task suggestions. If you desire to acquire more customers for your tech business and ensure they stay satisfied, create your own sales presentation with these plain slides.
Monthly Sales Performance Tracking And Monitoring Dashboard Designs PDF
This slide showcases a dashboard presenting various metrics to measure and analyze sales performance for revenue growth. It includes key components such as number of sales, revenue, profit, cost, sales revenue, sales increment, cost analysis and cross sell. Make sure to capture your audiences attention in your business displays with our gratis customizable Monthly Sales Performance Tracking And Monitoring Dashboard Designs PDF. These are great for business strategies, office conferences, capital raising or task suggestions. If you desire to acquire more customers for your tech business and ensure they stay satisfied, create your own sales presentation with these plain slides.
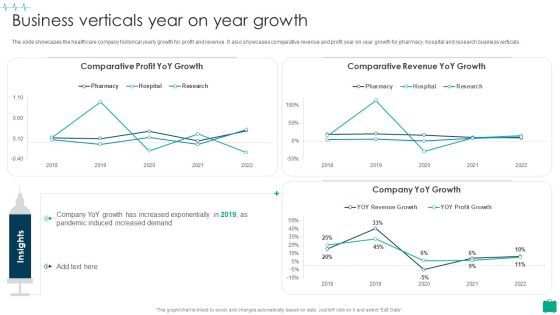
Healthcare Services Company Profile Business Verticals Year On Year Growth Summary PDF
The slide showcases the healthcare company historical yearly growth for profit and revenue. It also showcases comparative revenue and profit year on year growth for pharmacy, hospital and research business verticals.Deliver and pitch your topic in the best possible manner with this Healthcare Services Company Profile Business Verticals Year On Year Growth Summary PDF Use them to share invaluable insights on Comparative Profit, Comparative Revenue, Increased Exponentially and impress your audience. This template can be altered and modified as per your expectations. So, grab it now.

Hospital Medical Research Company Profile Business Verticals Year On Year Growth Themes PDF
The slide showcases the healthcare company historical yearly growth for profit and revenue. It also showcases comparative revenue and profit year on year growth for pharmacy, hospital and research business verticals Deliver an awe inspiring pitch with this creative Hospital Medical Research Company Profile Business Verticals Year On Year Growth Themes PDF bundle. Topics like Comparative Profit, YoY Growth, Comparative Revenue, Company YoY Growth can be discussed with this completely editable template. It is available for immediate download depending on the needs and requirements of the user.
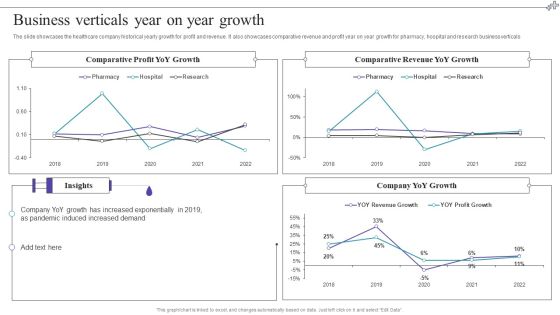
Medical Care Company Overview Business Verticals Year On Year Growth Elements PDF
The slide showcases the healthcare company historical yearly growth for profit and revenue. It also showcases comparative revenue and profit year on year growth for pharmacy, hospital and research business verticals. Deliver an awe inspiring pitch with this creative Medical Care Company Overview Business Verticals Year On Year Growth Elements PDF bundle. Topics like Company Yoy Growth, Comparative Revenue, Comparative Profit can be discussed with this completely editable template. It is available for immediate download depending on the needs and requirements of the user.
Weekly E Mail Performance Report Icon Ppt Inspiration Example File PDF
This slide displays the overall revenue that has been earned by an organization during a weekly performance report with the gross margin percent, total revenue , no. Of customers, etc. Showcasing this set of slides titled Weekly E Mail Performance Report Icon Ppt Inspiration Example File PDF. The topics addressed in these templates are Gross Margin, Total Revenue, Customers. All the content presented in this PPT design is completely editable. Download it and make adjustments in color, background, font etc. as per your unique business setting.

Strategic Playbook For Enterprise Administration Roadmap Graphics PDF
Purpose of the following slide is to highlight multiple revenue models that the organization can use to generate income. These model can be transaction based, advertisement based, commission based, and recurring revenue model. Presenting Strategic Playbook For Enterprise Administration Roadmap Graphics PDF to provide visual cues and insights. Share and navigate important information on five stages that need your due attention. This template can be used to pitch topics like Commission Based Model, Recurring Revenue Model, Advertisement Based Model. In addtion, this PPT design contains high resolution images, graphics, etc, that are easily editable and available for immediate download.
Monthly Services Business Marketing Strategy Implementation Timeline Professional PDF
Following slide demonstrates dashboard for monitoring services company sales strategy impact on maximizing business profits. It includes elements such as number of sales, revenue, profit, cost, monthly sales revenue, cost breakdown, up and cross sell, revenue collected and sales by communication channel. Showcasing this set of slides titled Monthly Services Business Marketing Strategy Implementation Timeline Professional PDF. The topics addressed in these templates are Strategy, Lead Generation, Customer Retention. All the content presented in this PPT design is completely editable. Download it and make adjustments in color, background, font etc. as per your unique business setting.

Early Stage Funding Break Even Point Analysis Ppt Infographic Template Graphics Design PDF
The slide shows the break-even point of the company. It provides the company s revenue and cost at different unit of products. Presenting early stage funding break even point analysis ppt infographic template graphics design pdf. to provide visual cues and insights. Share and navigate important information on one stages that need your due attention. This template can be used to pitch topics like sales revenue, break even point bep, profit, variable costs, revenue. In addtion, this PPT design contains high resolution images, graphics, etc, that are easily editable and available for immediate download.

Transportation And Logistics Services Company Profile Competitor Comparison By Operations Inspiration PDF
The slide showcases the competitor comparison by operations and revenue. It depicts comparison metrics which includes service coverage, fleet size, order size, total deliveries, workforce, revenue and net profit. Deliver and pitch your topic in the best possible manner with this Transportation And Logistics Services Company Profile Competitor Comparison By Operations Inspiration PDF. Use them to share invaluable insights on Service Coverage, Fleet Size, Workforce, Order Size, Revenue and impress your audience. This template can be altered and modified as per your expectations. So, grab it now.

Beauty Care Product Sales Comparison With Units Sold Ppt Outline Graphics PDF
This slide shows matrix which can be used by organizations to compare sales performance of various products. It includes cost of revenue, units sold, revenue and profit. Showcasing this set of slides titled Beauty Care Product Sales Comparison With Units Sold Ppt Outline Graphics PDF. The topics addressed in these templates are Cosmetic Category, Cost Of Revenue, Units Sold. All the content presented in this PPT design is completely editable. Download it and make adjustments in color, background, font etc. as per your unique business setting.

Key Metrics In Software Sales Strategy Pictures PDF
This slide presents key metrics to be tracked in software sales plan, that helps organisations to keep track of growth and profits generated over time. It includes monthly recurring revenue, average revenue per user, customer lifetime value and lead velocity rate Presenting Key Metrics In Software Sales Strategy Pictures PDF to dispense important information. This template comprises four stages. It also presents valuable insights into the topics including Monthly Recurring Revenue, Customer Lifetime Value, Lead Velocity Rate. This is a completely customizable PowerPoint theme that can be put to use immediately. So, download it and address the topic impactfully.

Hotels Social Infrastructure Development Business Executive Report Topics PDF
This slide showcase business summary of hotel social infrastructure development to increase profit and revenue of hotel chains. It includes elements such as target market, competitors, management team, problems solutions competitive advantages, revenue model. Persuade your audience using this Hotels Social Infrastructure Development Business Executive Report Topics PDF. This PPT design covers ten stages, thus making it a great tool to use. It also caters to a variety of topics including Revenue Model, Competitive Advantages, Solutions, Problems. Download this PPT design now to present a convincing pitch that not only emphasizes the topic but also showcases your presentation skills.

Strategic Marketing For Hair And Beauty Salon To Increase Dashboard Monitoring Sales Slides PDF
This slide presents a dashboard tracking revenue and sales by products and services. It includes KPIs such as revenue by service and products, units sold, monthly revenue. Make sure to capture your audiences attention in your business displays with our gratis customizable Strategic Marketing For Hair And Beauty Salon To Increase Dashboard Monitoring Sales Slides PDF. These are great for business strategies, office conferences, capital raising or task suggestions. If you desire to acquire more customers for your tech business and ensure they stay satisfied, create your own sales presentation with these plain slides.
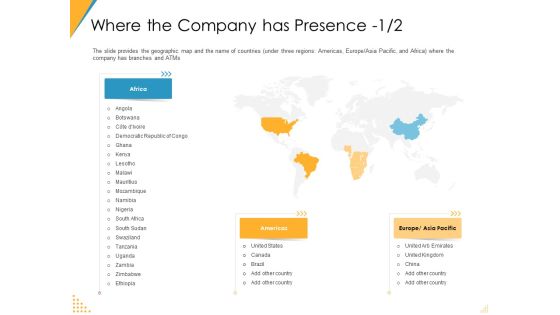
Investor Pitch Deck Post Market Financing Where The Company Has Presence Formats PDF
The slide provides the key facts related to geographic presence of the company. Additionally, it provides the revenue split by geography and top 10 countries which has highest contribution in the companys revenue in the year 2021. Deliver an awe-inspiring pitch with this creative investor pitch deck post market financing where the company has presence formats pdf bundle. Topics like revenue split by geographic regions can be discussed with this completely editable template. It is available for immediate download depending on the needs and requirements of the user.

CSR Activities Company Reputation Management Brief Description About Who We Are Ppt Infographic Template Good PDF
This slide provides information regarding the firms overview in terms of its offerings, revenue generated, office locations, number of employees, founded year, etc. Deliver and pitch your topic in the best possible manner with this csr activities company reputation management brief description about who we are ppt infographic template good pdf. Use them to share invaluable insights on revenue by geographical segment, revenue by product or service category, office locations, employees and impress your audience. This template can be altered and modified as per your expectations. So, grab it now.
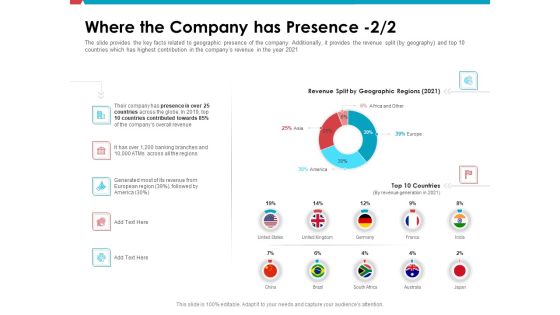
Investor Pitch Deck Public Offering Market Where The Company Has Presence Regions Structure PDF
The slide provides the key facts related to geographic presence of the company. Additionally, it provides the revenue split by geography and top 10 countries which has highest contribution in the companys revenue in the year 2021. Deliver an awe-inspiring pitch with this creative investor pitch deck public offering market where the company has presence regions structure pdf bundle. Topics like revenue split by geographic regions 2021, top 10 countries can be discussed with this completely editable template. It is available for immediate download depending on the needs and requirements of the user.
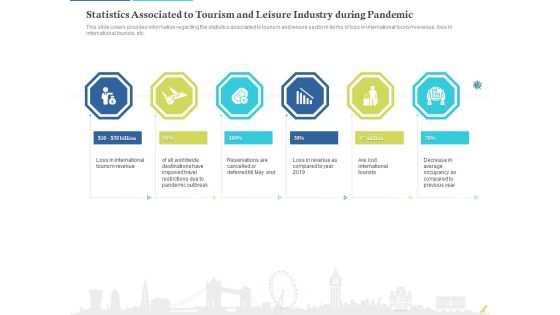
Rebuilding Travel Industry After COVID 19 Statistics Associated To Tourism And Leisure Industry During Pandemic Summary PDF
This slide covers provides information regarding the statistics associated to tourism and leisure sector in terms of loss in international tourism revenue, loss in international tourists, etc. Presenting rebuilding travel industry after COVID 19 statistics associated to tourism and leisure industry during pandemic summary pdf. to provide visual cues and insights. Share and navigate important information on six stages that need your due attention. This template can be used to pitch topics like loss in international tourism revenue, loss in revenue as compared to ye, are lost international tourists. In addtion, this PPT design contains high resolution images, graphics, etc, that are easily editable and available for immediate download.
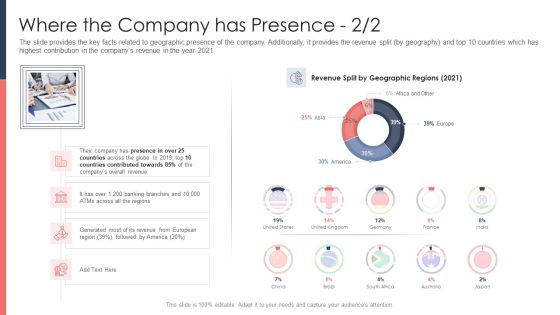
Pitch Deck For Fundraising From Post Market Financing Where The Company Has Presence Other Mockup PDF
The slide provides the key facts related to geographic presence of the company. Additionally, it provides the revenue split by geography and top 10 countries which has highest contribution in the companys revenue in the year 2021 Deliver and pitch your topic in the best possible manner with this pitch deck for fundraising from post market financing where the company has presence other mockup pdf. Use them to share invaluable insights on revenue split by geographic regions 2021, united states, united kingdom and impress your audience. This template can be altered and modified as per your expectations. So, grab it now.

Investor Pitch Deck Fundraising Via Mezzanine Equity Instrument Model For Successful Business Operations Background PDF
The slides covers the key points to explain the business model of the company. Key points include value proposition, market opportunities, revenue and cost model, competitive environment etc. Presenting investor pitch deck fundraising via mezzanine equity instrument model for successful business operations background pdf to provide visual cues and insights. Share and navigate important information on four stages that need your due attention. This template can be used to pitch topics like market opportunity, value proposition, revenue model, competitive environment, revenue generated. In addtion, this PPT design contains high resolution images, graphics, etc, that are easily editable and available for immediate download.

Funding Pitch To Raise Funds From PE Where The Company Has Presence Generated Topics PDF
The slide provides the key facts related to geographic presence of the company. Additionally, it provides the revenue split by geography and top 10 countries which has highest contribution in the companys revenue in the year 2021. Deliver and pitch your topic in the best possible manner with this funding pitch to raise funds from pe where the company has presence generated topics pdf. Use them to share invaluable insights on geographic, revenue and impress your audience. This template can be altered and modified as per your expectations. So, grab it now.

Key Performance Indicators To Tract Success Rate Of Strategy Summary PDF
The slide shows the key Performance Indicators KPIs, that might help the company to track the success rate of implemented strategies. Major KPIs include revenue, number of passengers, revenue per available seat, number of pilots, number of flights etc. Deliver and pitch your topic in the best possible manner with this key performance indicators to tract success rate of strategy summary pdf. Use them to share invaluable insights on revenue per available seat, target and impress your audience. This template can be altered and modified as per your expectations. So, grab it now.
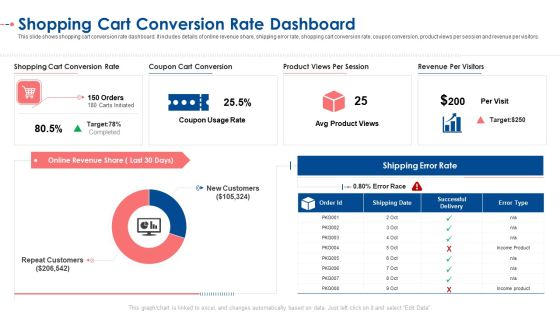
Shopping Cart Conversion Rate Dashboard Ppt Model Graphics PDF
This slide shows shopping cart conversion rate dashboard. It includes details of online revenue share, shipping error rate, shopping cart conversion rate, coupon conversion, product views per session and revenue per visitors. Deliver an awe-inspiring pitch with this creative shopping cart conversion rate dashboard ppt model graphics pdf. bundle. Topics like shopping cart conversion rate, coupon cart conversion, product views per session, revenue per visitors, avg product views can be discussed with this completely editable template. It is available for immediate download depending on the needs and requirements of the user.
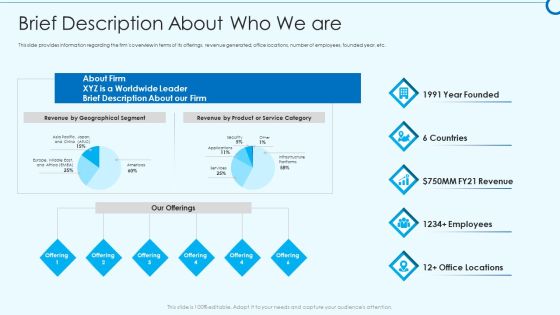
Developing Viable Working Surrounding Brief Description About Who We Are Summary PDF
This slide provides information regarding the firms overview in terms of its offerings, revenue generated, office locations, number of employees, founded year, etc. Deliver and pitch your topic in the best possible manner with this developing viable working surrounding brief description about who we are summary pdf. Use them to share invaluable insights on revenue by geographical segment, infrastructure platforms, revenue by product or service category and impress your audience. This template can be altered and modified as per your expectations. So, grab it now.
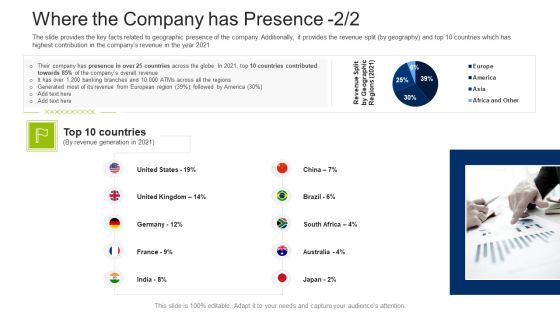
Investment Fundraising Pitch Deck From Stock Market Where The Company Has Presence Generated Microsoft PDF
The slide provides the key facts related to geographic presence of the company. Additionally, it provides the revenue split by geography and top 10 countries which has highest contribution in the companys revenue in the year 2021. Deliver and pitch your topic in the best possible manner with this investment fundraising pitch deck from stock market where the company has presence generated microsoft pdf. Use them to share invaluable insights on geographic, revenue and impress your audience. This template can be altered and modified as per your expectations. So, grab it now.

Sales Management Advisory Service Core Drivers Of Sales Performance Management Summary PDF
This slide provides the glimpse about the core drivers of sales performance management plan which focuses on revenue model, process, talent, technology and measurements. This is a sales management advisory service core drivers of sales performance management summary pdf template with various stages. Focus and dispense information on five stages using this creative set, that comes with editable features. It contains large content boxes to add your information on topics like revenue process, technology, measurement, revenue model, talent. You can also showcase facts, figures, and other relevant content using this PPT layout. Grab it now.

Business Profile For Sales Negotiations Core Drivers Of Sales Performance Management Ppt Layouts Inspiration PDF
This slide provides the glimpse about the core drivers of sales performance management plan which focuses on revenue model, process, talent, technology and measurements. Presenting business profile for sales negotiations core drivers of sales performance management ppt layouts inspiration pdf to provide visual cues and insights. Share and navigate important information on five stages that need your due attention. This template can be used to pitch topics like revenue model, revenue process, talent, technology, measurement. In addtion, this PPT design contains high resolution images, graphics, etc, that are easily editable and available for immediate download.

Where The Company Has Presence Geographic Elements PDF
The slide provides the key facts related to geographic presence of the company. Additionally, it provides the revenue split by geography and top 10 countries which has highest contribution in the companys revenue in the year 2021. Deliver and pitch your topic in the best possible manner with this where the company has presence geographic elements pdf. Use them to share invaluable insights on geographic, revenue and impress your audience. This template can be altered and modified as per your expectations. So, grab it now.
Where The Company Has Presence Countries Ppt Icon Themes PDF
The slide provides the key facts related to geographic presence of the company. Additionally, it provides the revenue split by geography and top 10 countries which has highest contribution in the companys revenue in the year 2019.Deliver and pitch your topic in the best possible manner with this where the company has presence countries ppt icon themes pdf Use them to share invaluable insights on revenue split by geographic regions and impress your audience. This template can be altered and modified as per your expectations. So, grab it now.

IT Service Incorporation And Administration Dashboard To Measure Business Performance Portrait PDF
Mentioned slide portrays a dashboard for measuring business performance. Performance metrics covered in the slide are average weekly sales revenue, average revenue per unit, customer lifetime value and customer acquisition cost. Deliver and pitch your topic in the best possible manner with this it service incorporation and administration dashboard to measure business performance portrait pdf. Use them to share invaluable insights on sales, revenue, target, acquisition cost and impress your audience. This template can be altered and modified as per your expectations. So, grab it now.
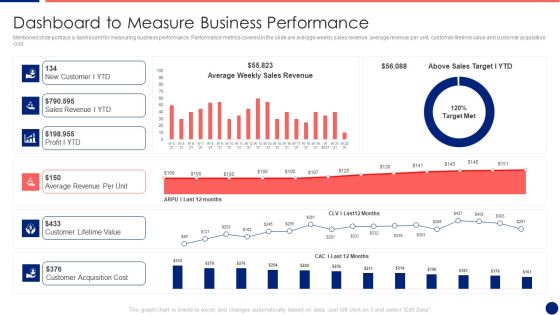
Information Technology Service Integration Post Acquisition Merger Dashboard To Measure Business Pictures PDF
Mentioned slide portrays a dashboard for measuring business performance. Performance metrics covered in the slide are average weekly sales revenue, average revenue per unit, customer lifetime value and customer acquisition cost. Deliver and pitch your topic in the best possible manner with this information technology service integration post acquisition merger dashboard to measure business pictures pdf. Use them to share invaluable insights on sales revenue, average, cost and impress your audience. This template can be altered and modified as per your expectations. So, grab it now.
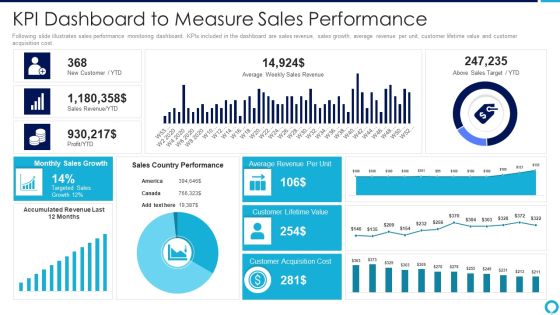
Partnership Management Strategies Kpi Dashboard To Measure Sales Performance Introduction PDF
Following slide illustrates sales performance monitoring dashboard. KPIs included in the dashboard are sales revenue, sales growth, average revenue per unit, customer lifetime value and customer acquisition cost.Deliver and pitch your topic in the best possible manner with this partnership management strategies kpi dashboard to measure sales performance introduction pdf Use them to share invaluable insights on average revenue, monthly sales growth, customer acquisition cost and impress your audience. This template can be altered and modified as per your expectations. So, grab it now.
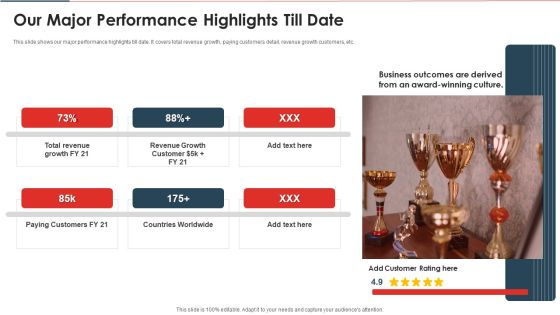
Website And Mobile Application Development Business Our Major Performance Highlights Till Date Designs PDF
This slide shows our major performance highlights till date. It covers total revenue growth, paying customers detail, revenue growth customers, etc. Presenting website and mobile application development business our major performance highlights till date designs pdf to provide visual cues and insights. Share and navigate important information on six stages that need your due attention. This template can be used to pitch topics like revenue, growth, customer. In addtion, this PPT design contains high resolution images, graphics, etc, that are easily editable and available for immediate download.
Designing And Deployment CRM Implementation Dashboard With Sales Pipeline Icons PDF
The following slide showcases the CRM dashboard which includes leads, deals, sales revenue, revenue by products, total leads by source, total leads by status and lead distribution. Deliver and pitch your topic in the best possible manner with this designing and deployment crm implementation dashboard with sales pipeline icons pdf. Use them to share invaluable insights on crm, lead distribution, sales revenue, total leads by source, deals, sales pipeline by stage and impress your audience. This template can be altered and modified as per your expectations. So, grab it now.
Retail Trading Platform Dashboard Tracking Essential Kpis For Ecommerce Performance Diagrams PDF
This slide provides information regarding essential KPIs for ecommerce performance dashboard tracking average bounce rate, new vs. old customers, channel revenue vs. channel acquisitions costs, channel revenue vs. sales, average conversion rate, etc. Deliver an awe inspiring pitch with this creative retail trading platform dashboard tracking essential kpis for ecommerce performance diagrams pdf bundle. Topics like average bounce rate, average conversion rate, bounce rate, channel revenue sales can be discussed with this completely editable template. It is available for immediate download depending on the needs and requirements of the user.

Dashboard To Track Referral Marketing Recommendation Program Results Structure PDF
The following slide showcases KPI dashboard which can be used by marketers to track and analyze referral program results. The template provides information about revenue generated, paying customers, promotors, clicks, cancelled customers etc. Showcasing this set of slides titled Dashboard To Track Referral Marketing Recommendation Program Results Structure PDF. The topics addressed in these templates are Revenue Generated, Recurring Revenue, Paying Customers. All the content presented in this PPT design is completely editable. Download it and make adjustments in color, background, font etc. as per your unique business setting.

New Product Sales Strategy And Marketing KPI Dashboard To Monitor Sales Performance Information PDF
This slide shows sales performance monitoring dashboard. Metrics included in the dashboard are sales revenue, sales growth, average revenue per unit, customer lifetime value and customer acquisition cost. Deliver an awe inspiring pitch with this creative New Product Sales Strategy And Marketing KPI Dashboard To Monitor Sales Performance Information PDF bundle. Topics like Sales Revenue, Monthly Sales Growth, Sales Country Performance can be discussed with this completely editable template. It is available for immediate download depending on the needs and requirements of the user.

Monthly Retail Sales Report Forecast For Company Introduction PDF
The following slide highlights the monthly retail sales forecast for company illustrating key headings which includes key headings customers, estimated footfall, footfall entering store, total customer, sales, total number of sales, revenue and average sale revenue. Pitch your topic with ease and precision using this Monthly Retail Sales Report Forecast For Company Introduction PDF. This layout presents information on Customers, Sales, Revenue. It is also available for immediate download and adjustment. So, changes can be made in the color, design, graphics or any other component to create a unique layout.
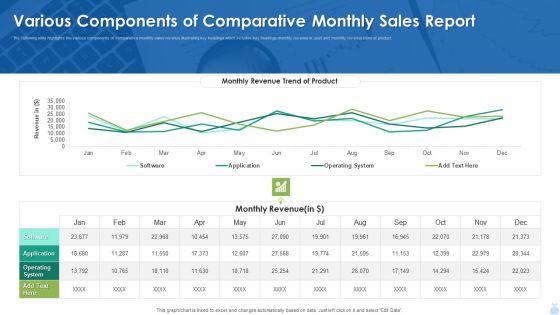
Various Components Of Comparative Monthly Sales Report Inspiration PDF
The following slide highlights the various components of comparative monthly sales revenue illustrating key headings which includes key headings monthly revenue in used and monthly revenue trend of product. Showcasing this set of slides titled Various Components Of Comparative Monthly Sales Report Inspiration PDF. The topics addressed in these templates are Various Components Of Comparative Monthly Sales Report Inspiration PDF. All the content presented in this PPT design is completely editable. Download it and make adjustments in color, background, font etc. as per your unique business setting.
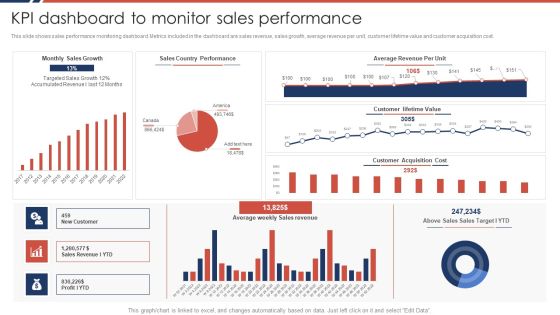
Effective Sales Plan For New Product Introduction In Market KPI Dashboard To Monitor Sales Performance Portrait PDF
This slide shows sales performance monitoring dashboard. Metrics included in the dashboard are sales revenue, sales growth, average revenue per unit, customer lifetime value and customer acquisition cost.Deliver an awe inspiring pitch with this creative Effective Sales Plan For New Product Introduction In Market KPI Dashboard To Monitor Sales Performance Portrait PDF bundle. Topics like Average Revenue, Country Performance, Customer Lifetime can be discussed with this completely editable template. It is available for immediate download depending on the needs and requirements of the user.

Automating Supply Chain Dashboard For Tracking Impact Of Transport Automation Themes PDF
This slide covers the dashboard for tracking vehicle efficiency after transport automation. It include KPIs such as truck turnaround time, average revenue per hour, truckload capacity, transit time, on-time pickup, and average revenue per mile. Deliver an awe inspiring pitch with this creative Automating Supply Chain Dashboard For Tracking Impact Of Transport Automation Themes PDF bundle. Topics like Average Revenue, Per Mile, Truck Turnaround can be discussed with this completely editable template. It is available for immediate download depending on the needs and requirements of the user.
Marketing And Operations Dashboard For Performance Management Icons PDF
This slide covers sales and operation dashboard for performance management. It involves details such as number of new buyers, sales revenue, average revenue per unit etc. Pitch your topic with ease and precision using this Marketing And Operations Dashboard For Performance Management Icons PDF. This layout presents information on Average Revenue Per Unit, Customer Acquisition Cost, Customer Lifetime Value. It is also available for immediate download and adjustment. So, changes can be made in the color, design, graphics or any other component to create a unique layout.
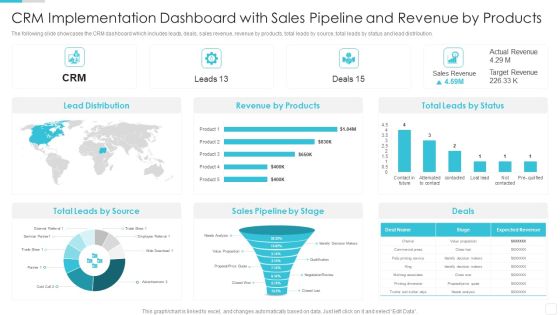
Sales CRM Cloud Solutions Deployment CRM Implementation Dashboard With Sales Template PDF
The following slide showcases the CRM dashboard which includes leads, deals, sales revenue, revenue by products, total leads by source, total leads by status and lead distribution.Deliver and pitch your topic in the best possible manner with this Sales CRM Cloud Solutions Deployment CRM Implementation Dashboard With Sales Template PDF. Use them to share invaluable insights on Lead Distribution, Revenue By Products, Leads By Source and impress your audience. This template can be altered and modified as per your expectations. So, grab it now.
Stock Requirement Plan With Delivery Performance Ppt PowerPoint Presentation Icon Deck PDF
The following slide highlights the material requirement planning with delivery performance illustrating top clients by revenue details, top clients by revenue, delivery performance and shipments. Pitch your topic with ease and precision using this Stock Requirement Plan With Delivery Performance Ppt PowerPoint Presentation Icon Deck PDF. This layout presents information on Delivery Performance, Shipments, Top Clients Revenue. It is also available for immediate download and adjustment. So, changes can be made in the color, design, graphics or any other component to create a unique layout.

Linkedin Company Outline Listed Organizations And Schools Rules PDF
The slide showcases company revenue for last six years along with forecasted revenue for Q4F Y22. It also depicts CAGR and key insights for revenue analysis.The slide highlights the growth in the number of organizations and hospitals listed with LinkedIn, which are used for marketing material and to connecting graduates. Deliver an awe inspiring pitch with this creative Linkedin Company Outline Listed Organizations And Schools Rules PDF bundle. Topics like Organizations Increased, Schools Doubled, Organizations can be discussed with this completely editable template. It is available for immediate download depending on the needs and requirements of the user.

Fashion Marketing And Advertisement Analysis Dashboard Ppt PowerPoint Presentation Gallery Topics PDF
This slide defines the dashboard for fashion marketing and Advertisement revenue analysis . It includes information related to the revenue, sales, brands and gender breakdown. Pitch your topic with ease and precision using this Fashion Marketing And Advertisement Analysis Dashboard Ppt PowerPoint Presentation Gallery Topics PDF. This layout presents information on Total Revenue, Total Brands, Total Sales. It is also available for immediate download and adjustment. So, changes can be made in the color, design, graphics or any other component to create a unique layout.

Business Performance Review Dashboard With Customer Acquisition Cost Diagrams PDF
The following slide highlights KPI dashboard which can be used for quarterly business review QBR. It provides detailed information about actual revenue vs target, number of new customers, average revenue per customer, customer acquisition cost CAC etc. Pitch your topic with ease and precision using this Business Performance Review Dashboard With Customer Acquisition Cost Diagrams PDF. This layout presents information on Revenue, Customer Acquisition Cost, Current Quarter. It is also available for immediate download and adjustment. So, changes can be made in the color, design, graphics or any other component to create a unique layout.
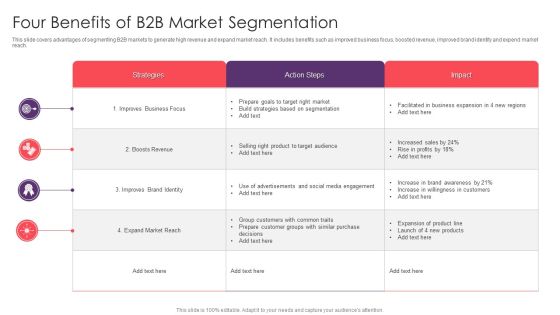
Four Benefits Of B2B Market Segmentation Introduction PDF
This slide covers advantages of segmenting B2B markets to generate high revenue and expand market reach. It includes benefits such as improved business focus, boosted revenue, improved brand identity and expend market reach. Showcasing this set of slides titled Four Benefits Of B2B Market Segmentation Introduction PDF. The topics addressed in these templates are Strategies, Boosts Revenue, Expand Market Reach. All the content presented in this PPT design is completely editable. Download it and make adjustments in color, background, font etc. as per your unique business setting.
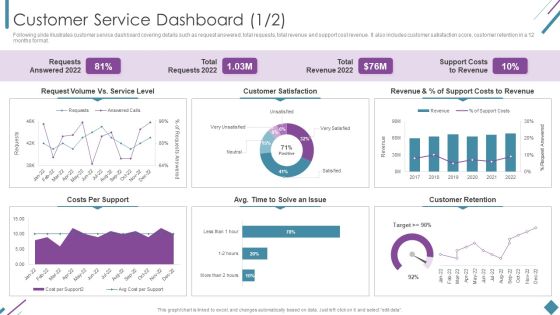
Metrics To Measure Business Performance Customer Service Dashboard Sample PDF
Following slide illustrates customer service dashboard covering details such as request answered, total requests, total revenue and support cost revenue. It also includes customer satisfaction score, customer retention in a 12 months format. Deliver and pitch your topic in the best possible manner with this Metrics To Measure Business Performance Customer Service Dashboard Sample PDF. Use them to share invaluable insights on Requests Answered 2022, Total Requests 2022, Total Revenue 2022 and impress your audience. This template can be altered and modified as per your expectations. So, grab it now.
Strategy Playbook For Ecommerce Business Dashboard Tracking Essential Kpis For Ecommerce Performance Rules PDF
This slide provides information regarding essential KPIs for ecommerce performance dashboard tracking average bounce rate, new vs. old customers, channel revenue vs. channel acquisitions costs, channel revenue vs. sales, average conversion rate, etc. Deliver an awe inspiring pitch with this creative Strategy Playbook For Ecommerce Business Dashboard Tracking Essential Kpis For Ecommerce Performance Rules PDF bundle. Topics like Returning Customers, Acquisition Cost, Channel Revenue can be discussed with this completely editable template. It is available for immediate download depending on the needs and requirements of the user.
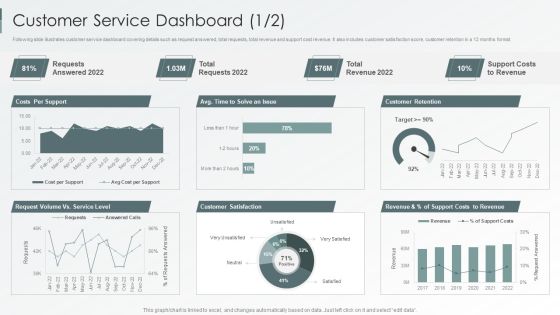
Enterprise Sustainability Performance Metrics Customer Service Dashboard Professional PDF
Following slide illustrates customer service dashboard covering details such as request answered, total requests, total revenue and support cost revenue. It also includes customer satisfaction score, customer retention in a 12 months format.Deliver and pitch your topic in the best possible manner with this Enterprise Sustainability Performance Metrics Customer Service Dashboard Professional PDF. Use them to share invaluable insights on Customer Satisfaction, Customer Retention, Support Revenue and impress your audience. This template can be altered and modified as per your expectations. So, grab it now.

Dashboard Tracking Essential Kpis For Ecommerce Performance Slides PDF
This slide provides information regarding essential KPIs for ecommerce performance dashboard tracking average bounce rate, new vs. old customers, channel revenue vs. channel acquisitions costs, channel revenue vs. sales, average conversion rate, etc. Deliver an awe inspiring pitch with this creative Dashboard Tracking Essential Kpis For Ecommerce Performance Slides PDF bundle. Topics like Average Bounce Rate, Channel Acquisition Costs, Channel Revenue can be discussed with this completely editable template. It is available for immediate download depending on the needs and requirements of the user.

Prospective Buyer Retention Dashboard With Key Performance Indicators Themes PDF
This slide shows the dashboard representing the key performance metrics for retention of potential customers of the organization. It shows no. of active users, churn rate, cost of customer acquisition, their life time value, monthly recurring revenue etc.Pitch your topic with ease and precision using this Prospective Buyer Retention Dashboard With Key Performance Indicators Themes PDF. This layout presents information on Recurring Revenue, Revenue Growth, Customer Acquisition. It is also available for immediate download and adjustment. So, changes can be made in the color, design, graphics or any other component to create a unique layout.

Organic Business Growth Strategies Dashboard For Measuring Success Of Our Marketing Efforts Diagrams PDF
Purpose of the following slide is to display a dashboard to help analyze the marketing efforts through essential metrics such as the revenue generated, average revenue generated per unit etc. Deliver an awe inspiring pitch with this creative Organic Business Growth Strategies Dashboard For Measuring Success Of Our Marketing Efforts Diagrams PDF bundle. Topics like Average Revenue, Customer Lifetime Value, Customer Acquisition Cost can be discussed with this completely editable template. It is available for immediate download depending on the needs and requirements of the user.

Customer Service Dashboard Company Performance Evaluation Using KPI Themes PDF
Following slide illustrates customer service dashboard covering details such as request answered, total requests, total revenue and support cost revenue. It also includes customer satisfaction score, customer retention in a 12 months format. Deliver and pitch your topic in the best possible manner with this Customer Service Dashboard Company Performance Evaluation Using KPI Themes PDF. Use them to share invaluable insights on Requests Answered, Total Revenue, Customer Retention and impress your audience. This template can be altered and modified as per your expectations. So, grab it now.
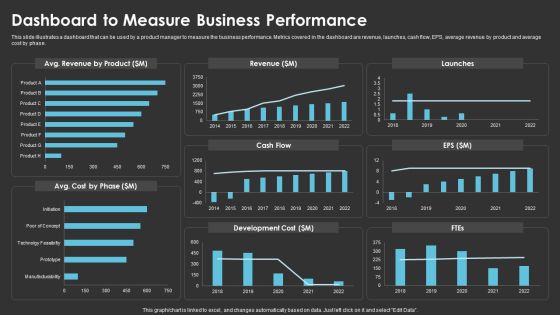
Method To Introduce New Product Offerings In The Industry Dashboard To Measure Business Performance Pictures PDF
This slide illustrates a dashboard that can be used by a product manager to measure the business performance. Metrics covered in the dashboard are revenue, launches, cash flow, EPS, average revenue by product and average cost by phase. Deliver and pitch your topic in the best possible manner with this Method To Introduce New Product Offerings In The Industry Dashboard To Measure Business Performance Pictures PDF. Use them to share invaluable insights on Revenue, Cash Flow, Development Cost and impress your audience. This template can be altered and modified as per your expectations. So, grab it now.
Consumer Journey Mapping Techniques Referral Program Performance Tracking Dashboard Formats PDF
This slide covers the KPI dashboard for analyzing referral campaign results. It includes metrics such as total revenue generated, monthly recurring revenue, new customers, clicks, cancelled customers, paying customers, etc. Showcasing this set of slides titled Consumer Journey Mapping Techniques Referral Program Performance Tracking Dashboard Formats PDF. The topics addressed in these templates are Revenue, New Customers, Paying Customers. All the content presented in this PPT design is completely editable. Download it and make adjustments in color, background, font etc. as per your unique business setting.

Company Sales Employee Performance Measurement Dashboard Information PDF
This slide exhibits sales performance dashboard to analyze revenue and track business progress. It includes various indicators such as leads created, opportunities won, sales ratio and top revenue generating products. Showcasing this set of slides titled Company Sales Employee Performance Measurement Dashboard Information PDF. The topics addressed in these templates are Quick Ratio Target, Opportunities Won, Revenue Generating Products. All the content presented in this PPT design is completely editable. Download it and make adjustments in color, background, font etc. as per your unique business setting.

Supermarket Online Service Delivery And Management Dashboard Formats PDF
This slide shows the online grocery delivery dashboard of various products based on certain metrics and KPIs to achieve grocery retail revenue goals. It includes total orders, total customers total categories, and revenue. Showcasing this set of slides titled Supermarket Online Service Delivery And Management Dashboard Formats PDF. The topics addressed in these templates are Total Revenue, Total Customers, Dashboard. All the content presented in this PPT design is completely editable. Download it and make adjustments in color, background, font etc. as per your unique business setting.
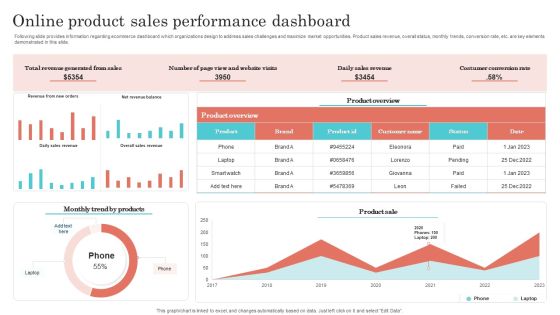
Online Product Sales Performance Dashboard Designs PDF
Following slide provides information regarding ecommerce dashboard which organizations design to address sales challenges and maximize market opportunities. Product sales revenue, overall status, monthly trends, conversion rate, etc. are key elements demonstrated in this slide. Showcasing this set of slides titled Online Product Sales Performance Dashboard Designs PDF. The topics addressed in these templates are Revenue Generated From Sales, Daily Sales Revenue, Costumer Conversion Rate. All the content presented in this PPT design is completely editable. Download it and make adjustments in color, background, font etc. as per your unique business setting.
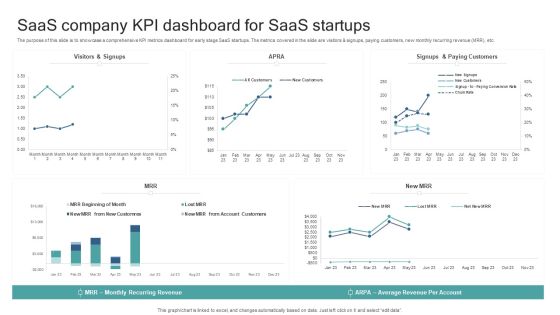
Saas Company KPI Dashboard For Saas Startups Background PDF
The purpose of this slide is to showcase a comprehensive KPI metrics dashboard for early stage SaaS startups. The metrics covered in the slide are visitors and signups, paying customers, new monthly recurring revenue MRR, etc. Showcasing this set of slides titled Saas Company KPI Dashboard For Saas Startups Background PDF. The topics addressed in these templates are Average Revenue Per Account, Monthly Recurring Revenue. All the content presented in this PPT design is completely editable. Download it and make adjustments in color, background, font etc. as per your unique business setting.

Saas Company Management Dashboard With Key Kpl Template PDF
The purpose of this slide is to showcase various metrics of SaaS company in the form of dashboard. The metrics could be, Paying customers, monthly recurring revenue MRR, customer acquisition cost CAC, etc. Showcasing this set of slides titled Saas Company Management Dashboard With Key Kpl Template PDF. The topics addressed in these templates are Monthly Recurring Revenue, Customer Acquisition Cost, Customer Lifetime Value, Average Revenue Per Unit. All the content presented in this PPT design is completely editable. Download it and make adjustments in color, background, font etc. as per your unique business setting.
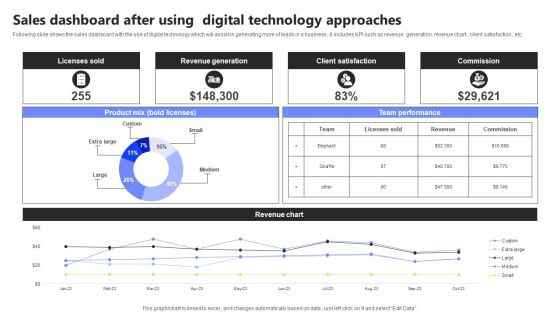
Sales Dashboard After Using Digital Technology Approaches Infographics PDF
Following slide shows the sales dashboard with the use of digital technology which will assist in generating more of leads in a business . It includes KPI such as revenue generation, revenue chart , client satisfaction , etc. Showcasing this set of slides titled Sales Dashboard After Using Digital Technology Approaches Infographics PDF. The topics addressed in these templates are Licenses Sold, Revenue Generation, Client Satisfaction. All the content presented in this PPT design is completely editable. Download it and make adjustments in color, background, font etc. as per your unique business setting.

Sales Sales By Geographic Region Report With Doughnut Chart Themes PDF
This slide illustrates graphical representation of sales contribution of countries. It includes revenue of FY19 in percentage and numbers and revenue of FY20 in percentage and numbers. Showcasing this set of slides titled Sales Sales By Geographic Region Report With Doughnut Chart Themes PDF. The topics addressed in these templates are Revenue, Doughnut Chart, Geographic Region Report. All the content presented in this PPT design is completely editable. Download it and make adjustments in color, background, font etc. as per your unique business setting.
Market Study Company Outline Diversified And Growing Business Icons PDF
This slide highlights the Nielsen diversified and growing business which includes solutions revenue share, customer base and revenue by geography, contracted revenue and years of experience. Slidegeeks has constructed Market Study Company Outline Diversified And Growing Business Icons PDF after conducting extensive research and examination. These presentation templates are constantly being generated and modified based on user preferences and critiques from editors. Here, you will find the most attractive templates for a range of purposes while taking into account ratings and remarks from users regarding the content. This is an excellent jumping off point to explore our content and will give new users an insight into our top notch PowerPoint Templates.

Data And Customer Analysis Company Outline Diversified And Growing Business Elements PDF
This slide highlights the Nielsen diversified and growing business which includes solutions revenue share, customer base and revenue by geography, contracted revenue and years of experience. Find a pre designed and impeccable Data And Customer Analysis Company Outline Diversified And Growing Business Elements PDF. The templates can ace your presentation without additional effort. You can download these easy to edit presentation templates to make your presentation stand out from others. So, what are you waiting for Download the template from Slidegeeks today and give a unique touch to your presentation.

Hospitality Business Service Executive Report Demonstration PDF
This slide provide description of hospitability business that provide world class experience to travelers. It includes elements such as revenue streams, customer segment , channel traffic value propositions, products, annual revenue etc. Showcasing this set of slides titled Hospitality Business Service Executive Report Demonstration PDF. The topics addressed in these templates are Customer Segment, Revenue Streams, Value Propositions. All the content presented in this PPT design is completely editable. Download it and make adjustments in color, background, font etc. as per your unique business setting.
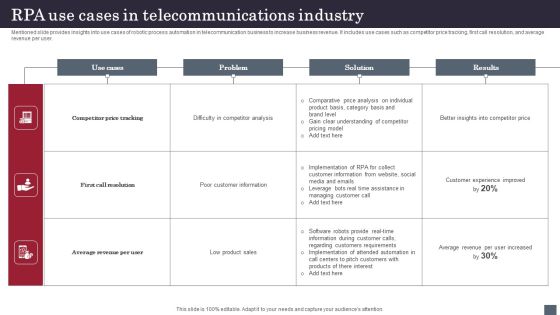
RPA Use Cases In Telecommunications Industry Infographics PDF
Mentioned slide provides insights into use cases of robotic process automation in telecommunication business to increase business revenue. It includes use cases such as competitor price tracking, first call resolution, and average revenue per user. Showcasing this set of slides titled RPA Use Cases In Telecommunications Industry Infographics PDF. The topics addressed in these templates are Competitor Price Tracking, First Call Resolution, Average Revenue Per User . All the content presented in this PPT design is completely editable. Download it and make adjustments in color, background, font etc. as per your unique business setting.

Sales Kpi Performance Summary Ppt PowerPoint Presentation Infographic Template Elements
This is a sales kpi performance summary ppt powerpoint presentation infographic template elements. This is a seven stage process. The stages in this process are revenue comparison, quantity comparison, product sales mix, regional sales mix, budget.

Sales Kpi Performance Summary Ppt PowerPoint Presentation Show Inspiration
This is a sales kpi performance summary ppt powerpoint presentation show inspiration. This is a two stage process. The stages in this process are revenue comparison, quantity comparison, product sales mix, regional sales mix, budget.
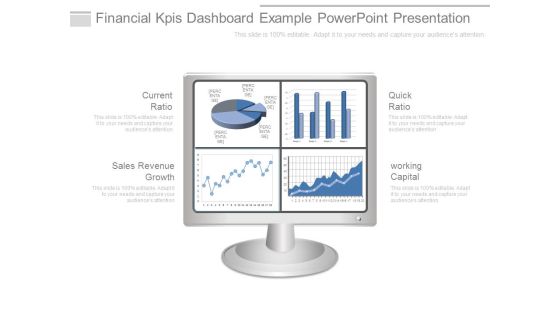
Financial Kpis Dashboard Example Powerpoint Presentation
This is a financial kpis dashboard example powerpoint presentation. This is a four stage process. The stages in this process are current ratio, sales revenue growth, quick ratio, working capital.
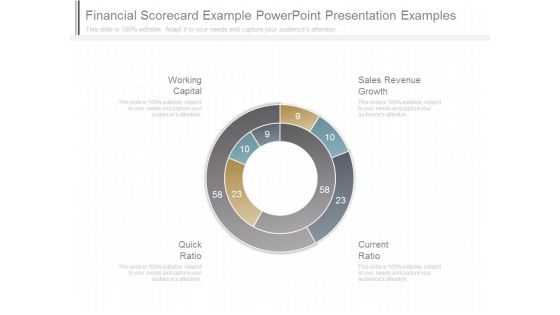
Financial Scorecard Example Powerpoint Presentation Examples
This is a financial scorecard example powerpoint presentation examples. This is a four stage process. The stages in this process are working capital, quick ratio, current ratio, sales revenue growth.

Example Of Economic Issues Ppt Powerpoint Shapes
This is a example of economic issues ppt powerpoint shapes. This is a five stage process. The stages in this process are electricity shortfall, dependence on loans, excess of import than export, weak revenue system, foreign exchange rate.

Business Economic Value Diagram Ppt Slides Examples
This is a business economic value diagram ppt slides examples. This is a four stage process. The stages in this process are revenue model, value chain structure, value proposition, market segments.

Companies Financial Prospectus Ppt Slides Themes
This is a companies financial prospectus ppt slides themes. This is a six stage process. The stages in this process are financial accounting, supplier management, revenue management, resource management, cash management, speed management.
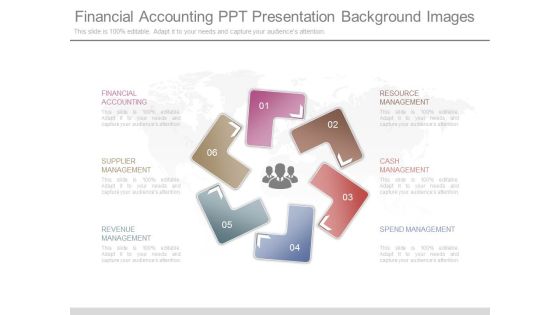
Financial Accounting Ppt Presentation Background Images
This is a financial accounting ppt presentation background images. This is a six stage process. The stages in this process are financial accounting, supplier management, revenue management, resource management, cash management, spend management.

Financial Measures Ppt PowerPoint Presentation Model Infographics
This is a financial measures ppt powerpoint presentation model infographics. This is a seven stage process. The stages in this process are cost of raw material, revenue from goods sold, inventory holding cost, transportation cost, cost of expired perishable goods.
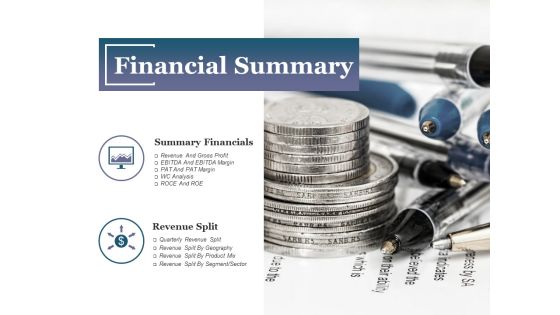
Financial Summary Ppt PowerPoint Presentation Infographics Design Inspiration
This is a financial summary ppt powerpoint presentation infographics design inspiration. This is a two stage process. The stages in this process are summary financials, revenue split, financial summary, business, marketing.

Business And Financial Overview Ppt PowerPoint Presentation Pictures Visuals
This is a business and financial overview ppt powerpoint presentation pictures visuals. This is a two stage process. The stages in this process are current key offerings, revenue by geography, current technology used, business financial overview.
Website Performance Review Template 2 Ppt PowerPoint Presentation Icon Design Ideas
This is a website performance review template 2 ppt powerpoint presentation icon design ideas. This is a four stage process. The stages in this process are column two, revenue trends, traffic sources.
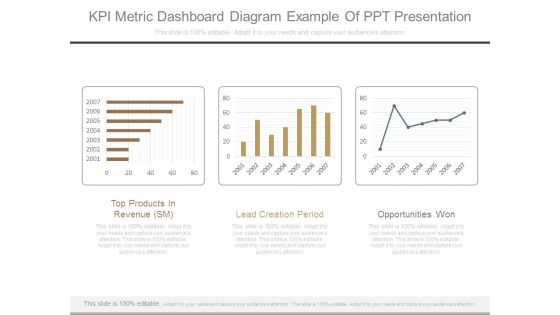
Kpi Metric Dashboard Diagram Example Of Ppt Presentation
This is a kpi metric dashboard diagram example of ppt presentation. This is a three stage process. The stages in this process are top products in revenue sm, lead creation period, opportunities won.
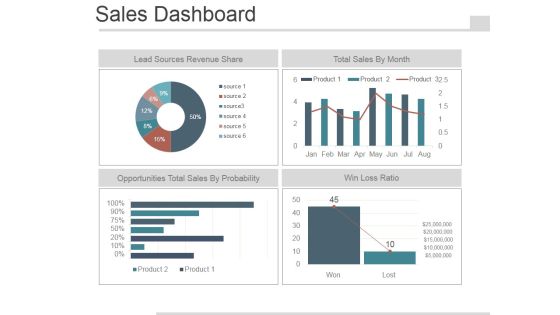
Sales Dashboard Slide Template 2 Ppt PowerPoint Presentation Images
This is a sales dashboard slide template 2 ppt powerpoint presentation images. This is a four stage process. The stages in this process are lead sources revenue share, total sales by month, opportunities total sales by probability, win loss ratio.
