Revenue
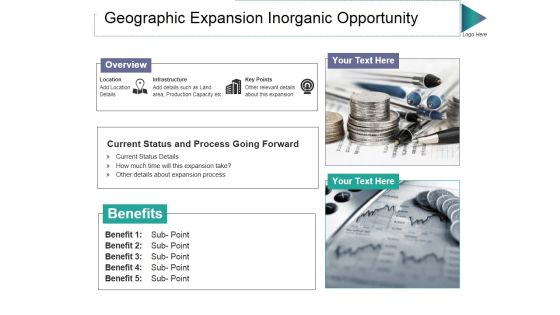
Geographic Expansion Inorganic Opportunity Ppt PowerPoint Presentation Pictures Maker
This is a geographic expansion inorganic opportunity ppt powerpoint presentation pictures maker. This is a two stage process. The stages in this process are overview, infrastructure, key points, location, benefits.
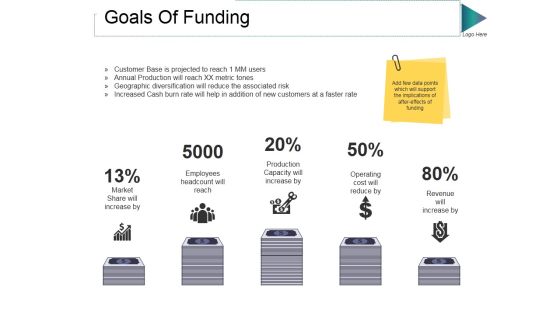
Goals Of Funding Ppt PowerPoint Presentation Summary Background Designs
This is a goals of funding ppt powerpoint presentation summary background designs. This is a five stage process. The stages in this process are finance, business, percentage, marketing, currency.

Key Highlights Ppt PowerPoint Presentation Gallery Background Images
This is a key highlights ppt powerpoint presentation gallery background images. This is a eight stage process. The stages in this process are average roce, certified welders, countries, leader in automobile, years.

Radar Chart Ppt PowerPoint Presentation Infographics Portfolio
This is a radar chart ppt powerpoint presentation infographics portfolio. This is a two stage process. The stages in this process are product, finance, shapes, business, marketing.

Comparison Ppt PowerPoint Presentation Infographics Examples
This is a comparison ppt powerpoint presentation infographics examples. This is a two stage process. The stages in this process are user, comparison, dollar, symbol, business.
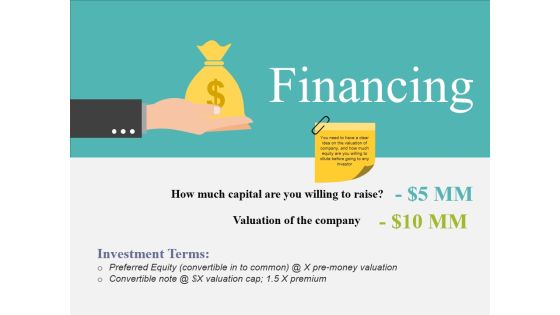
Financing Ppt PowerPoint Presentation Summary Good
This is a financing ppt powerpoint presentation summary good. This is a two stage process. The stages in this process are dollar, business, finance, marketing, symbol.
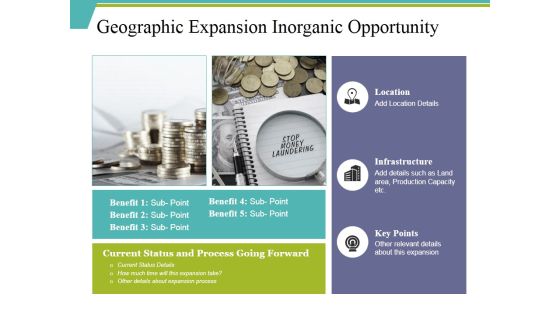
Geographic Expansion Inorganic Opportunity Ppt PowerPoint Presentation Ideas Example Introduction
This is a geographic expansion inorganic opportunity ppt powerpoint presentation ideas example introduction. This is a three stage process. The stages in this process are location, infrastructure, key points, benefit, sub point.

Radar Chart Ppt PowerPoint Presentation Gallery Templates
This is a radar chart ppt powerpoint presentation gallery templates. This is a two stage process. The stages in this process are radar chart, product, shape, business.
Stock Chart Ppt PowerPoint Presentation Icon Format
This is a stock chart ppt powerpoint presentation icon format. This is a two stage process. The stages in this process are product, close, high, volume, low.

Competitors Average Price Product Ppt PowerPoint Presentation Icon Layout
This is a competitors average price product ppt powerpoint presentation icon layout. This is a five stage process. The stages in this process are company, bar graph, finance, business, marketing.

Stock Chart Ppt PowerPoint Presentation Slides Graphics Pictures
This is a stock chart ppt powerpoint presentation slides graphics pictures. This is a two stage process. The stages in this process are product, high, volume, low, open.

Radar Chart Ppt PowerPoint Presentation Inspiration Infographic Template
This is a radar chart ppt powerpoint presentation inspiration infographic template. This is a two stage process. The stages in this process are radar chart, product, business, finance, marketing.
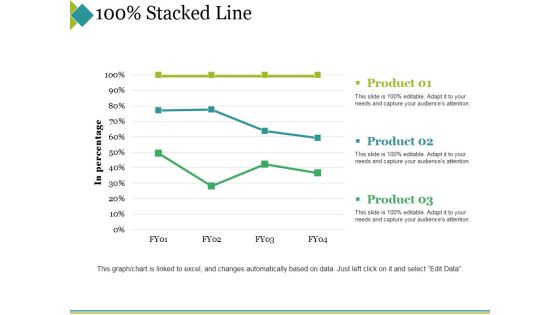
Stacked Line Ppt PowerPoint Presentation Professional Background Designs
This is a stacked line ppt powerpoint presentation professional background designs. This is a three stage process. The stages in this process are product, in percentage, stacked line, finance, business.

Radar Chart Ppt PowerPoint Presentation Infographics Visual Aids
This is a radar chart ppt powerpoint presentation infographics visual aids. This is a two stage process. The stages in this process are radar chart, product, finance, business, marketing.

Comparison Ppt PowerPoint Presentation Slides Structure
This is a comparison ppt powerpoint presentation slides structure. This is a three stage process. The stages in this process are pc users in, laptop users in, mobile users in, technology, years.
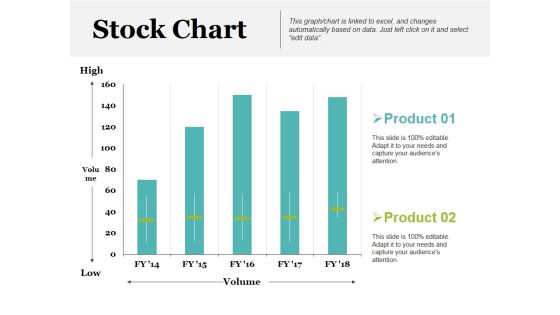
Stock Chart Ppt PowerPoint Presentation Inspiration Example Introduction
This is a stock chart ppt powerpoint presentation inspiration example introduction. This is a two stage process. The stages in this process are product, high, volume, low, stock chart.
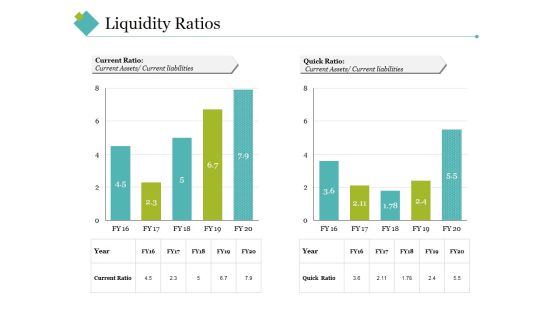
Liquidity Ratios Template 2 Ppt PowerPoint Presentation Gallery Vector
This is a liquidity ratios template 2 ppt powerpoint presentation gallery vector. This is a two stage process. The stages in this process are quick ratio, current ratio, current liabilities, current assets.

Radar Chart Ppt PowerPoint Presentation Ideas Portrait
This is a radar chart ppt powerpoint presentation ideas portrait. This is a two stage process. The stages in this process are product, radar chart, finance, business, marketing.
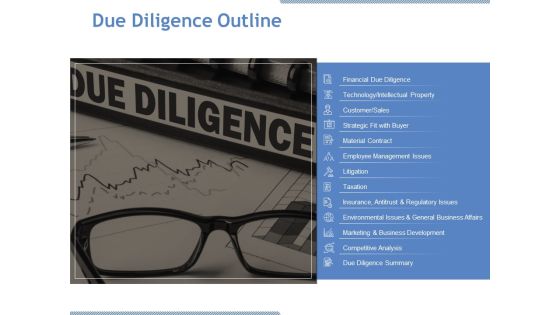
Due Diligence Outline Ppt PowerPoint Presentation Inspiration Gallery
This is a due diligence outline ppt powerpoint presentation inspiration gallery. This is a one stage process. The stages in this process are customer, material contract, litigation, taxation, competitive analysis.

Radar Chart Ppt PowerPoint Presentation Pictures Themes
This is a radar chart ppt powerpoint presentation pictures themes. This is a two stage process. The stages in this process are product, radar chart, finance, business.

Modes Of Finance Ppt PowerPoint Presentation Gallery Designs
This is a modes of finance ppt powerpoint presentation gallery designs. This is a four stage process. The stages in this process are business, finance, marketing, icons, strategy.

Stacked Line Ppt PowerPoint Presentation Pictures Example Topics
This is a stacked line ppt powerpoint presentation pictures example topics. This is a three stage process. The stages in this process are product, in percentage, stacked line, business, marketing.
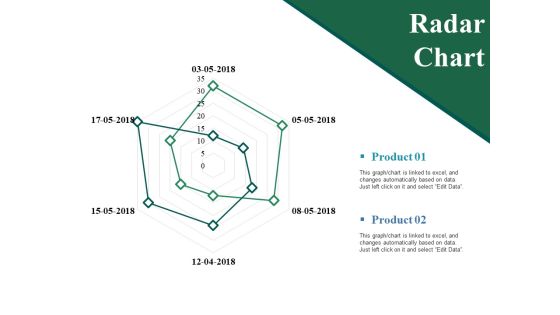
Radar Chart Ppt PowerPoint Presentation Show Guidelines
This is a radar chart ppt powerpoint presentation show guidelines. This is a two stage process. The stages in this process are product, radar chart, business, finance, marketing.
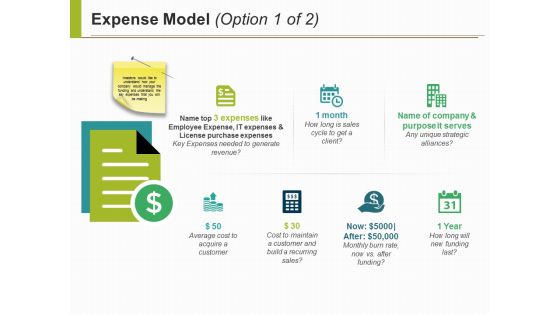
Expense Model Ppt PowerPoint Presentation Slides Ideas
This is a expense model ppt powerpoint presentation slides ideas. This is a seven stage process. The stages in this process are icons, marketing, strategy, finance, planning.

Cash Flow Statement Graphical Representation Ppt PowerPoint Presentation Ideas Graphic Tips
This is a cash flow statement graphical representation ppt powerpoint presentation ideas graphic tips. This is a four stage process. The stages in this process are operations, financing activities, investing activities, net increase in cash.
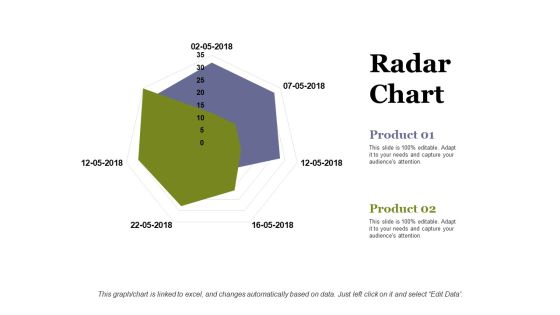
Radar Chart Ppt PowerPoint Presentation Infographic Template Information
This is a radar chart ppt powerpoint presentation infographic template information. This is a two stage process. The stages in this process are radar chart, product, business, marketing, shape.

Stacked Line Ppt PowerPoint Presentation Infographics Vector
This is a stacked line ppt powerpoint presentation infographics vector. This is a three stage process. The stages in this process are product, stacked line, business, marketing, in percentage.

Comparison Ppt PowerPoint Presentation Professional Example File
This is a comparison ppt powerpoint presentation professional example file. This is a two stage process. The stages in this process are male, female, comparison.

Radar Chart Ppt PowerPoint Presentation Portfolio Graphics Template
This is a radar chart ppt powerpoint presentation portfolio graphics template. This is a two stage process. The stages in this process are product, finance, shape, radar chart, business.

Stock Chart Ppt PowerPoint Presentation Ideas Infographics
This is a stock chart ppt powerpoint presentation ideas infographics. This is a two stage process. The stages in this process are high, volume, low, product, stock chart.

Area Chart Ppt PowerPoint Presentation Professional Grid
This is a area chart ppt powerpoint presentation professional grid. This is a two stage process. The stages in this process are product, sales in percentage, business.

Radar Chart Ppt PowerPoint Presentation Styles Themes
This is a radar chart ppt powerpoint presentation styles themes. This is a two stage process. The stages in this process are product, finance, shape, radar chart, business.

Control Chart Template 1 Ppt PowerPoint Presentation Ideas Images
This is a control chart template 1 ppt powerpoint presentation ideas images. This is a two stage process. The stages in this process are average range or quality, upper control limit, lower control limit, time, process average.

Control Chart Template 2 Ppt PowerPoint Presentation Portfolio Summary
This is a control chart template 2 ppt powerpoint presentation portfolio summary. This is a one stage process. The stages in this process are upper control limit, process segment, process change, unstable trend, lower control limit.

Bar Chart Ppt PowerPoint Presentation Portfolio Inspiration
This is a bar chart ppt powerpoint presentation portfolio inspiration. This is a two stage process. The stages in this process are product, in percentage, in years.

Marketing Reach By Channels Ppt PowerPoint Presentation Styles Professional
This is a marketing reach by channels ppt powerpoint presentation styles professional. This is a six stage process. The stages in this process are top performing, non scalable, emails, print ads, inline media.

Stock Chart Ppt PowerPoint Presentation Layouts Outfit
This is a stock chart ppt powerpoint presentation layouts outfit. This is a two stage process. The stages in this process are close, high, volume, low, open.
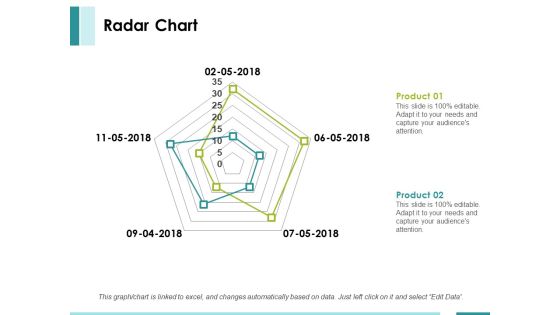
Radar Chart Ppt PowerPoint Presentation Summary Layout
This is a radar chart ppt powerpoint presentation summary layout. This is a two stage process. The stages in this process are product, finance, shape, radar chart, business.

Radar Chart Ppt PowerPoint Presentation File Rules
This is a radar chart ppt powerpoint presentation file rules. This is a two stage process. The stages in this process are product, radar chart, finance.

Template 2 Ppt PowerPoint Presentation Model Themes
This is a template 2 ppt powerpoint presentation model themes. This is a six stage process. The stages in this process are business, finance, marketing, icons, strategy.

Template 4 Ppt PowerPoint Presentation Infographic Template Images
This is a template 4 ppt powerpoint presentation infographic template images. This is a four stage process. The stages in this process are business, finance, marketing, icons, strategy.

Radar Chart Ppt PowerPoint Presentation Professional Infographic Template
This is a radar chart ppt powerpoint presentation professional infographic template. This is a two stage process. The stages in this process are product, finance, shape, radar chart, business.

Business Growth Kpis Ppt PowerPoint Presentation File Good
This is a business growth kpis ppt powerpoint presentation file good. This is a five stage process. The stages in this process are cost reduction strategies.

Business Growth Ratio Analysis Ppt PowerPoint Presentation Gallery Design Templates
This is a business growth ratio analysis ppt powerpoint presentation gallery design templates. This is a three stage process. The stages in this process are cost reduction strategies.

Business Performance Rating Scale Ppt PowerPoint Presentation Portfolio Designs Download
This is a business performance rating scale ppt powerpoint presentation portfolio designs download. This is a two stage process. The stages in this process are cost reduction strategies.

Business Performance Status Ppt PowerPoint Presentation Model Professional
This is a business performance status ppt powerpoint presentation model professional. This is a four stage process. The stages in this process are cost reduction strategies.
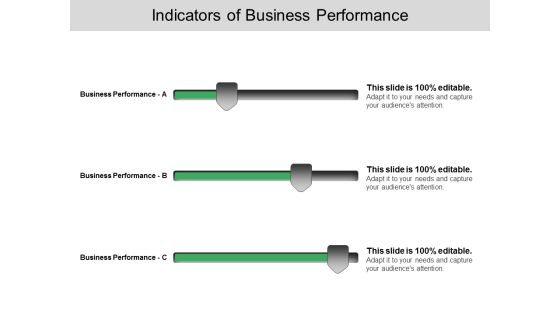
Indicators Of Busines Performance Ppt PowerPoint Presentation Infographics Influencers
This is a indicators of busines performance ppt powerpoint presentation infographics influencers. This is a three stage process. The stages in this process are cost reduction strategies.
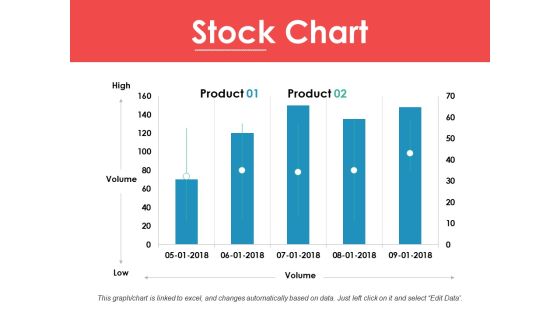
Stock Chart Ppt PowerPoint Presentation Ideas Infographic Template
This is a stock chart ppt powerpoint presentation ideas infographic template. This is a two stage process. The stages in this process are high, volume, low, product, stock chart.

Clustered Bar Ppt PowerPoint Presentation Summary Ideas
This is a clustered bar ppt powerpoint presentation summary ideas. This is a eight stage process. The stages in this process are clustered bar, finance, marketing, business, strategy.

Stock Chart Ppt PowerPoint Presentation Guide
This is a stock chart ppt powerpoint presentation guide. This is a two stage process. The stages in this process are product, close, high, volume, low.
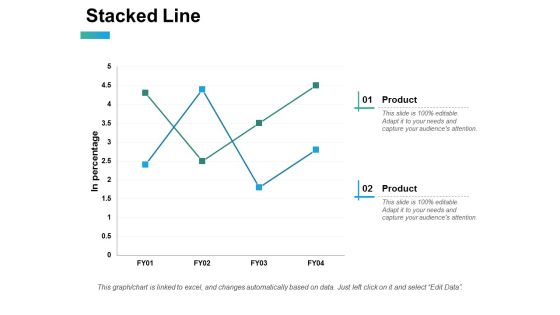
Stacked Line Ppt PowerPoint Presentation Professional Layouts
This is a stacked line ppt powerpoint presentation professional layouts. This is a two stage process. The stages in this process are finance, business, marketing, planning, investment.
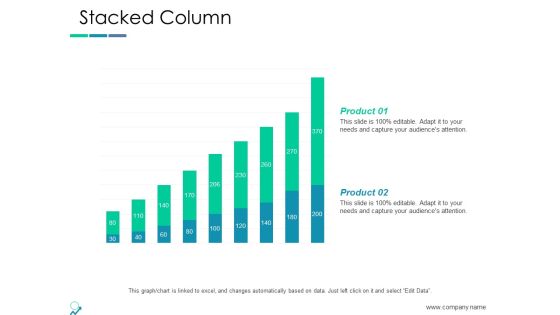
Stacked Column Ppt PowerPoint Presentation Infographics File Formats
This is a stacked column ppt powerpoint presentation infographics file for. This is a two stage process. The stages in this process are stacked column, management, marketing, business, investment.
Volume Open High Low Close Chart Ppt PowerPoint Presentation Icon Design Inspiration
This is a volume open high low close chart ppt powerpoint presentation icon design inspiration. This is a three stage process. The stages in this process are close, high, low, volume, open.
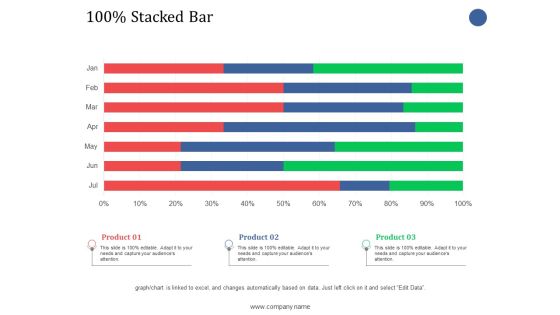
Stacked Bar Ppt PowerPoint Presentation Infographic Template Graphics
This is a stacked bar ppt powerpoint presentation infographic template graphics. This is a three stage process. The stages in this process are stacked bar, finance, product, business.

Open High Low Close Chart Ppt PowerPoint Presentation Professional Inspiration
This is a open high low close chart ppt powerpoint presentation professional inspiration. This is a five stage process. The stages in this process are high, low, close, business, finance.

Area Chart Ppt PowerPoint Presentation Summary Model
This is a area chart ppt powerpoint presentation summary model. This is a two stage process. The stages in this process are analysis, finance, marketing, management, investment.

Donut Pie Chart Ppt PowerPoint Presentation Show Graphics Download
This is a donut pie chart ppt powerpoint presentation show graphics download. This is a three stage process. The stages in this process are percentage, finance, donut, business, marketing.
Happy Woman With Dollars In Hand Ppt PowerPoint Presentation Icon Visuals
This is a happy woman with dollars in hand ppt powerpoint presentation icon visuals. This is a one stage process. The stages in this process are mutual funds, funds to buy, investment slide.

Key Performance Indicator Analytics Dashboard Ppt PowerPoint Presentation Model Example Topics
This is a key performance indicator analytics dashboard ppt powerpoint presentation model example topics. This is a five stage process. The stages in this process are kpi proposal, kpi plan, kpi scheme.
KPI Metrics Vector Icon Ppt PowerPoint Presentation Layouts Slide
This is a kpi metrics vector icon ppt powerpoint presentation layouts slide. This is a three stage process. The stages in this process are kpi proposal, kpi plan, kpi scheme.

Stacked Bar Ppt PowerPoint Presentation Visual Aids Pictures
This is a stacked bar ppt powerpoint presentation visual aids pictures. This is a two stage process. The stages in this process are product, percentage, finance, business, marketing.

3D Bar Chart For Percentage Values Comparison Ppt PowerPoint Presentation Professional Visual Aids
This is a 3d bar chart for percentage values comparison ppt powerpoint presentation professional visual aids. This is a five stage process. The stages in this process are art, colouring, paint brush.

3D Charts For Comparing Amounts And Volume Ppt PowerPoint Presentation Show Deck
This is a 3d charts for comparing amounts and volume ppt powerpoint presentation show deck. This is a five stage process. The stages in this process are art, colouring, paint brush.

Finance Talent Mapping Ppt PowerPoint Presentation Portfolio Template
This is a finance talent mapping ppt powerpoint presentation portfolio template. This is a three stage process. The stages in this process are business, management, strategy, finance, icons.

Column Chart Employee Value Proposition Ppt PowerPoint Presentation Slides Graphics Design
This is a column chart employee value proposition ppt powerpoint presentation slides graphics design. This is a two stage process. The stages in this process are business, management, strategy, analysis, marketing.
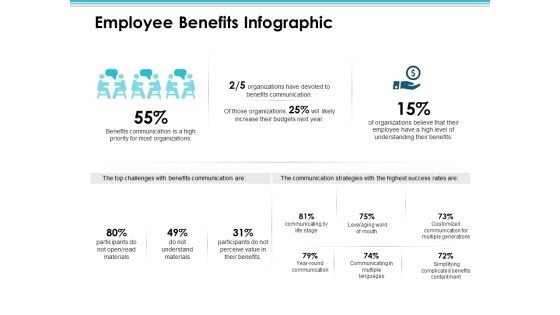
Employee Benefits Infographic Employee Value Proposition Ppt PowerPoint Presentation Styles Diagrams
This is a employee benefits infographic employee value proposition ppt powerpoint presentation styles diagrams. This is a three stage process. The stages in this process are business, management, strategy, analysis, marketing.

Data Analysis Vector Icons Ppt Powerpoint Presentation Layouts Gridlines
This is a data analysis vector icons ppt powerpoint presentation layouts gridlines. This is a two stage process. The stages in this process are data presentation, content presentation, information presentation.

Data Comparison And Analysis Chart Ppt Powerpoint Presentation File Background Images
This is a data comparison and analysis chart ppt powerpoint presentation file background images. This is a four stage process. The stages in this process are data presentation, content presentation, information presentation.

Data Interpretation Percentage Analysis Ppt Powerpoint Presentation Summary Icon
This is a data interpretation percentage analysis ppt powerpoint presentation summary icon. This is a six stage process. The stages in this process are data presentation, content presentation, information presentation.
Five Business Options Representation With Icons Ppt Powerpoint Presentation Portfolio Aids
This is a five business options representation with icons ppt powerpoint presentation portfolio aids. This is a five stage process. The stages in this process are data presentation, content presentation, information presentation.

Product Comparison Data Bar Graph Ppt Powerpoint Presentation Slides Show
This is a product comparison data bar graph ppt powerpoint presentation slides show. This is a four stage process. The stages in this process are data presentation, content presentation, information presentation.

Cost Reduction With Downward Arrow And Dollar Sign Ppt Powerpoint Presentation Infographics Templates
This is a cost reduction with downward arrow and dollar sign ppt powerpoint presentation infographics templates. This is a three stage process. The stages in this process are data analysis, data science, information science.

Facility Maintenance Ppt Powerpoint Presentation Infographics Design Inspiration
This is a facility maintenance ppt powerpoint presentation infographics design inspiration. This is a two stage process. The stages in this process are fm, facilities management, support management.
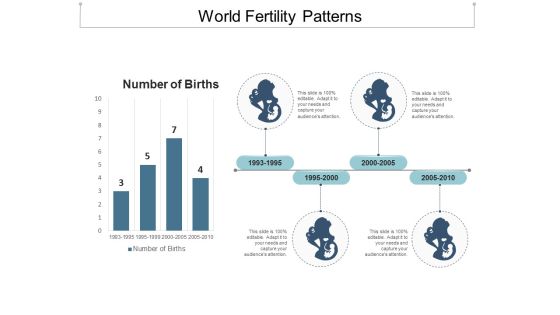
World Fertility Patterns Ppt Powerpoint Presentation Gallery Smartart
This is a world fertility patterns ppt powerpoint presentation gallery smartart. This is a four stage process. The stages in this process are fertility, productiveness, fecundity.

Learning And Experience Graph With Three Milestones Ppt PowerPoint Presentation Model Introduction
This is a learning and experience graph with three milestones ppt powerpoint presentation model introduction. This is a three stage process. The stages in this process are experience curve, learning curve.
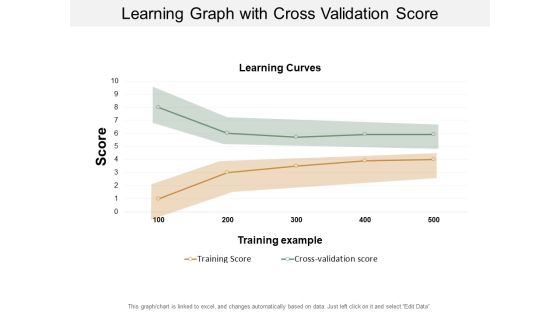
Learning Graph With Cross Validation Score Ppt PowerPoint Presentation Visual Aids Inspiration
This is a learning graph with cross validation score ppt powerpoint presentation visual aids inspiration. This is a two stage process. The stages in this process are experience curve, learning curve.
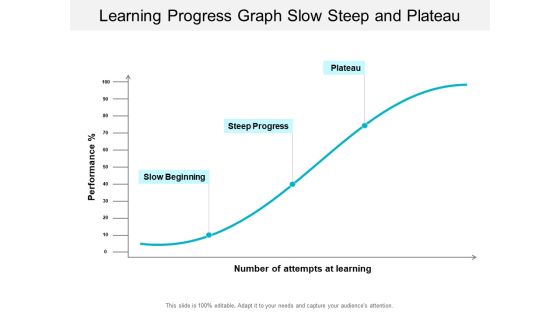
Learning Progress Graph Slow Steep And Plateau Ppt PowerPoint Presentation Professional Gallery
This is a learning progress graph slow steep and plateau ppt powerpoint presentation professional gallery. This is a three stage process. The stages in this process are experience curve, learning curve.
Data Research And Analysis For Mobile Users Ppt PowerPoint Presentation Icon Inspiration
This is a data research and analysis for mobile users ppt powerpoint presentation icon inspiration. This is a four stage process. The stages in this process are mobile analytics, mobile tracking, mobile web analytics.

Dashboard Marketing Planning Ppt PowerPoint Presentation Slides Slideshow
This is a dashboard marketing planning ppt powerpoint presentation slides slideshow. This is a three stage process. The stages in this process are dashboard, finance, analysis, business, investment.

Business Review And Performance Assessment Dashboards Ppt PowerPoint Presentation Infographics Show
This is a business review and performance assessment dashboards ppt powerpoint presentation infographics show. This is a four stage process. The stages in this process are year in review, yearly highlights, countdowns.

Car Dashboard And Speedometer Graphics Ppt PowerPoint Presentation File Graphics Template
This is a car dashboard and speedometer graphics ppt powerpoint presentation file graphics template. This is a four stage process. The stages in this process are fuel gauge, gas gauge, fuel containers.
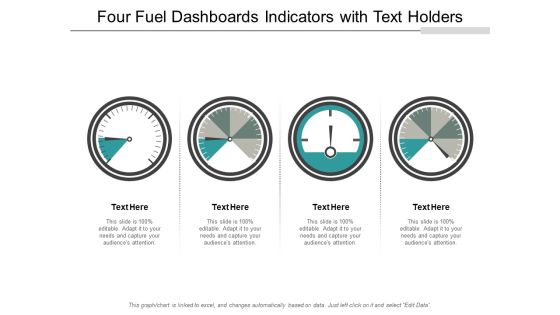
Four Fuel Dashboards Indicators With Text Holders Ppt PowerPoint Presentation File Graphics Design
This is a four fuel dashboards indicators with text holders ppt powerpoint presentation file graphics design. This is a four stage process. The stages in this process are fuel gauge, gas gauge, fuel containers.
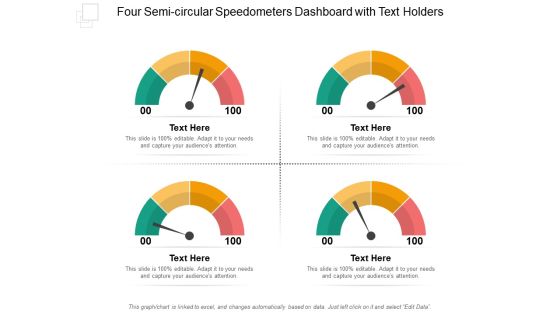
Four Semi Circular Speedometers Dashboard With Text Holders Ppt PowerPoint Presentation File Layouts
This is a four semi circular speedometers dashboard with text holders ppt powerpoint presentation file layouts. This is a four stage process. The stages in this process are fuel gauge, gas gauge, fuel containers.
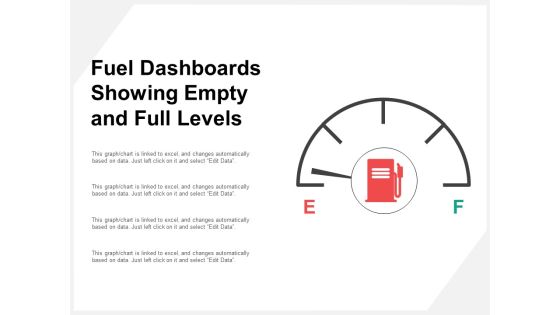
Fuel Dashboards Showing Empty And Full Levels Ppt PowerPoint Presentation Professional Slide Portrait
This is a fuel dashboards showing empty and full levels ppt powerpoint presentation professional slide portrait. This is a four stage process. The stages in this process are fuel gauge, gas gauge, fuel containers.

Fuel Levels Indicators And Dashboards Ppt PowerPoint Presentation Outline Skills
This is a fuel levels indicators and dashboards ppt powerpoint presentation outline skills. This is a three stage process. The stages in this process are fuel gauge, gas gauge, fuel containers.
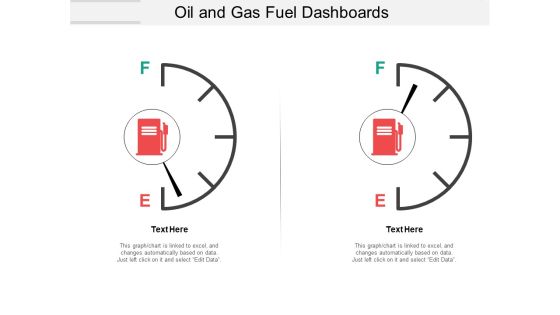
Oil And Gas Fuel Dashboards Ppt PowerPoint Presentation File Introduction
This is a oil and gas fuel dashboards ppt powerpoint presentation file introduction. This is a two stage process. The stages in this process are fuel gauge, gas gauge, fuel containers.
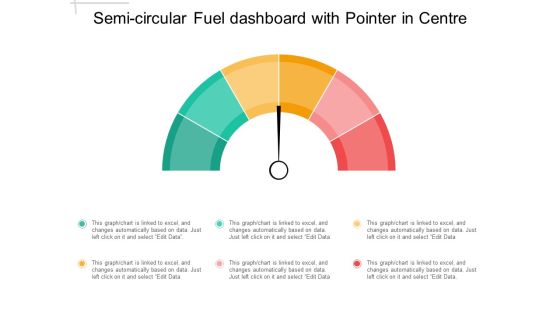
Semi Circular Fuel Dashboard With Pointer In Centre Ppt PowerPoint Presentation Outline Visuals
This is a semi circular fuel dashboard with pointer in centre ppt powerpoint presentation outline visuals. This is a three stage process. The stages in this process are fuel gauge, gas gauge, fuel containers.

Three Dashboard Speed Indicators With Text Holders Ppt PowerPoint Presentation Summary Layout
This is a three dashboard speed indicators with text holders ppt powerpoint presentation summary layout. This is a three stage process. The stages in this process are fuel gauge, gas gauge, fuel containers.
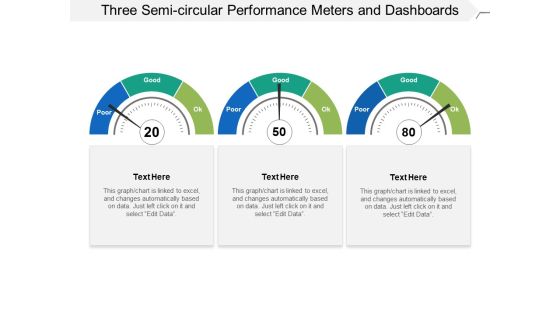
Three Semi Circular Performance Meters And Dashboards Ppt PowerPoint Presentation Slides Influencers
This is a three semi circular performance meters and dashboards ppt powerpoint presentation slides influencers. This is a three stage process. The stages in this process are fuel gauge, gas gauge, fuel containers.

Debit Card Payment Processing Steps With Icons Ppt PowerPoint Presentation Portfolio Background
This is a debit card payment processing steps with icons ppt powerpoint presentation portfolio background. This is a six stage process. The stages in this process are payment processing, instalment processing, premium processing.
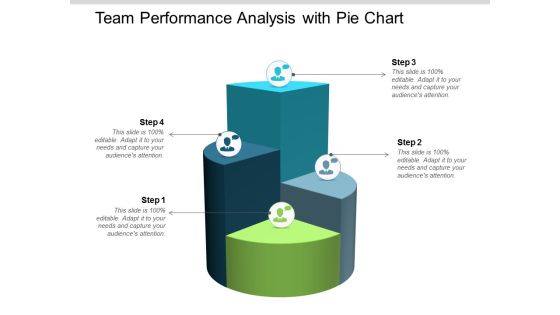
Team Performance Analysis With Pie Chart Ppt Powerpoint Presentation Infographic Template Slideshow
This is a team performance analysis with pie chart ppt powerpoint presentation infographic template slideshow. This is a four stage process. The stages in this process are team performance, member performance, group performance.

Contract Performance Management Administration And Monitoring Ppt PowerPoint Presentation Inspiration Deck
This is a contract performance management administration and monitoring ppt powerpoint presentation inspiration deck. This is a five stage process. The stages in this process are contract management, contract negotiation, deal making.
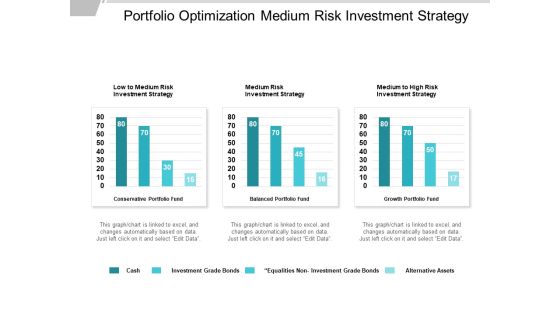
Portfolio Optimization Medium Risk Investment Strategy Ppt PowerPoint Presentation Model Good
This is a portfolio optimization medium risk investment strategy ppt powerpoint presentation model good. This is a four stage process. The stages in this process are portfolio strategies, portfolio plans, business.

Stock Chart Finance Analysis Ppt Powerpoint Presentation Ideas Portrait
This is a stock chart finance analysis ppt powerpoint presentation ideas portrait. This is a three stage process. The stages in this process are finance, marketing, management, investment, strategy.
Human Hand With Percent Sign Ppt PowerPoint Presentation Icon Clipart Images
This is a human hand with percent sign ppt powerpoint presentation icon clipart images. This is a three stage process. The stages in this process are percentage icon, dividend icon, portion icon.
Percentage Icon In Circle With Text Holders Ppt PowerPoint Presentation Layouts Inspiration
This is a percentage icon in circle with text holders ppt powerpoint presentation layouts inspiration. This is a three stage process. The stages in this process are percentage icon, dividend icon, portion icon.

Percentage Symbol With Text Holders Ppt PowerPoint Presentation Example 2015
This is a percentage symbol with text holders ppt powerpoint presentation example 2015. This is a three stage process. The stages in this process are percentage icon, dividend icon, portion icon.
Percentage Value Comparison Pie Chart Icon Ppt PowerPoint Presentation Model Clipart Images
This is a percentage value comparison pie chart icon ppt powerpoint presentation model clipart images. This is a three stage process. The stages in this process are percentage icon, dividend icon, portion icon.
White Percentage Sign In Green Circle Ppt PowerPoint Presentation Outline Templates
This is a white percentage sign in green circle ppt powerpoint presentation outline templates. This is a three stage process. The stages in this process are percentage icon, dividend icon, portion icon.

Pie Chart Finance Ppt PowerPoint Presentation Infographics Mockup
This is a pie chart finance ppt powerpoint presentation infographics mockup . This is a four stage process. The stages in this process are finance, marketing, management, investment, analysis.
Six Steps In Linear Flow With Icons Sales Strategies And Finacial Projections Ppt Powerpoint Presentation Inspiration Guide
This is a six steps in linear flow with icons sales strategies and finacial projections ppt powerpoint presentation inspiration guide. This is a six stage process. The stages in this process are 7 point infographic, 7 steps infographic, 7 stages infographic.
three steps in linear flow with icons sales strategies and finacial projections ppt powerpoint presentation layouts visual aids
This is a three steps in linear flow with icons sales strategies and finacial projections ppt powerpoint presentation layouts visual aids. This is a three stage process. The stages in this process are 7 point infographic, 7 steps infographic, 7 stages infographic.

Sales Management Reduce Sales Cycle Length Ppt Powerpoint Presentation Ideas Deck
This is a sales management reduce sales cycle length ppt powerpoint presentation ideas deck. This is a three stage process. The stages in this process are enablement plan, enablement strategy, enablement idea.

Pos System Accept Card Payment Ppt PowerPoint Presentation Model Graphics Design
This is a pos system accept card payment ppt powerpoint presentation model graphics design. This is a four stage process. The stages in this process are point of purchase, point of sale system, pos.
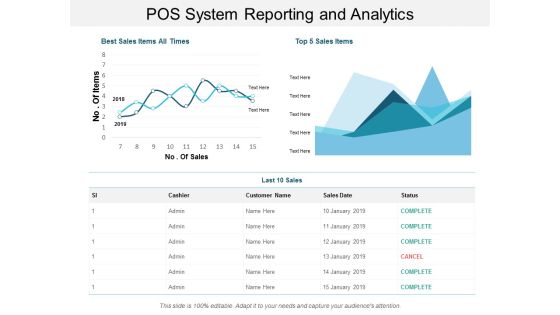
Pos System Reporting And Analytics Ppt PowerPoint Presentation Summary Gallery
This is a pos system reporting and analytics ppt powerpoint presentation summary gallery. This is a two stage process. The stages in this process are point of purchase, point of sale system, pos.
Spinning Wheel With Dollar Sign Vector Icon Ppt PowerPoint Presentation Portfolio Deck Cpb
This is a spinning wheel with dollar sign vector icon ppt powerpoint presentation portfolio deck cpb. This is a four stage process. The stages in this process are wheel of fortune, american game, wheel watchers.

Bar Graph Icon For Research Analysis Ppt PowerPoint Presentation Summary Portfolio
Presenting this set of slides with name bar graph icon for research analysis ppt powerpoint presentation summary portfolio. This is a three stage process. The stages in this process are data visualization icon, research analysis, business focus. This is a completely editable PowerPoint presentation and is available for immediate download. Download now and impress your audience.

Data Representation Vector Icon Ppt PowerPoint Presentation Infographic Template Samples
Presenting this set of slides with name data representation vector icon ppt powerpoint presentation infographic template samples. This is a one stage process. The stages in this process are data visualization icon, research analysis, business focus. This is a completely editable PowerPoint presentation and is available for immediate download. Download now and impress your audience.
Students Sitting In Classroom Vector Icon Ppt PowerPoint Presentation Styles Outfit
Presenting this set of slides with name students sitting in classroom vector icon ppt powerpoint presentation styles outfit. This is a one process. The stages in this process are Classroom, Management, Strategy, Planning, Business. This is a completely editable PowerPoint presentation and is available for immediate download. Download now and impress your audience.
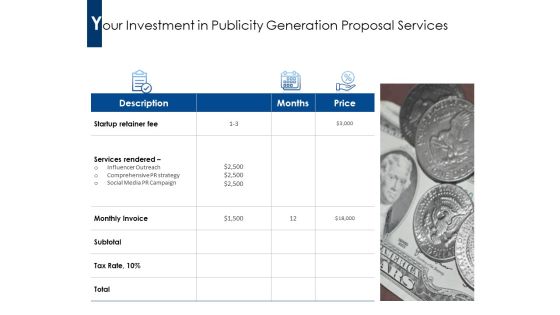
Your Investment In Publicity Generation Proposal Services Ppt PowerPoint Presentation Professional Outline
Presenting this set of slides with name your investment in publicity generation proposal services ppt powerpoint presentation professional outline. This is a one stage process. The stages in this process are startup retainer fee, services rendered, monthly invoice, price . This is a completely editable PowerPoint presentation and is available for immediate download. Download now and impress your audience.

Comparitive Analysis Of Factors To Be Considered For Vendor Selection Ppt PowerPoint Presentation Portfolio Grid PDF
Presenting this set of slides with name comparitive analysis of factors to be considered for vendor selection ppt powerpoint presentation portfolio grid pdf. The topics discussed in these slides are product quality assurance, technical expertise, scalability, support response timen. This is a completely editable PowerPoint presentation and is available for immediate download. Download now and impress your audience.
Dollar Coins Falling On Man Vector Icon Ppt PowerPoint Presentation Files PDF
Presenting this set of slides with name dollar coins falling on man vector icon ppt powerpoint presentation files pdf. This is a three stage process. The stages in this process are dollar coins falling on man vector icon. This is a completely editable PowerPoint presentation and is available for immediate download. Download now and impress your audience.

Volume Reductions For New Patients Due To Coronavirus Ppt Diagram Images PDF
This slide covers the impact of COVID on volume reductions for new patients based on scale of less interaction and more interaction. Deliver and pitch your topic in the best possible manner with this volume reductions for new patients due to coronavirus ppt diagram images pdf. Use them to share invaluable insights on key insights, patient interaction, existing patients and impress your audience. This template can be altered and modified as per your expectations. So, grab it now.

Competitive Edge Performance Representation For Variance Analysis Techniques And Models Ideas PDF
This slide covers the graphical representation for gap analyzation process. It also covers the important factors such as, sales metrics, time frame, potential and performance. Showcasing this set of slides titled competitive edge performance representation for variance analysis techniques and models ideas pdf. The topics addressed in these templates are competitive edge performance representation for variance analysis techniques and models. All the content presented in this PPT design is completely editable. Download it and make adjustments in color, background, font etc. as per your unique business setting.
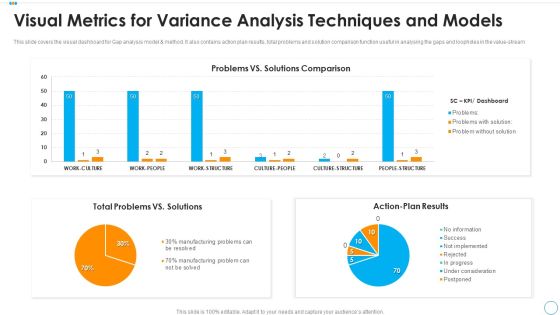
Visual Metrics For Variance Analysis Techniques And Models Mockup PDF
This slide covers the visual dashboard for Gap analysis model and method. It also contains action plan results, total problems and solution comparison function useful in analysing the gaps and loopholes in the value stream. Showcasing this set of slides titled visual metrics for variance analysis techniques and models mockup pdf. The topics addressed in these templates are total problems vs solutions, action plan results, problems vs solutions comparison. All the content presented in this PPT design is completely editable. Download it and make adjustments in color, background, font etc. as per your unique business setting.

Commercial Property Development Impact Assessment Of Risk Mitigation Initiatives Slides PDF
This slide illustrates graphs and charts for assessing the impact of risk mitigation initiatives taken to improve project quality and reduce overall cost during project lifecycle. Deliver an awe inspiring pitch with this creative commercial property development impact assessment of risk mitigation initiatives slides pdf bundle. Topics like impact project quality, impact cost, operations process, quality raised can be discussed with this completely editable template. It is available for immediate download depending on the needs and requirements of the user.

How Bidding Teams Determine User Persona For Better Client Understanding Sample PDF
This slide provides information regarding user persona for better customer understanding in terms of user goals, bio description, motivation, preferred channel, etc. Deliver an awe inspiring pitch with this creative how bidding teams determine user persona for better client understanding sample pdf bundle. Topics like goals, preferred channels, brands and influencers can be discussed with this completely editable template. It is available for immediate download depending on the needs and requirements of the user.

Online Marketing Tactics To Enhance Sales Key Challenges Faced By B2C Marketeers Inspiration PDF
This slide focuses on key challenges faced by b2c marketeers such as producing high-quality content, meeting customer expectations, getting organic traffic, adapting voice ordering system, etc. Deliver an awe inspiring pitch with this creative Online Marketing Tactics To Enhance Sales Key Challenges Faced By B2C Marketeers Inspiration PDF bundle. Topics like Adapt Voice, Ordering System, Get Organic Traffic, Meet Customer Expectations can be discussed with this completely editable template. It is available for immediate download depending on the needs and requirements of the user.

Online Marketing Tactics To Enhance Sales Key Recommendations For Optimizing Content Structure PDF
This slide covers the recommendations for content optimization such as posting images, hashtags and usernames, target specific user group, use CTAs, optimize image size for each network, etc. Deliver and pitch your topic in the best possible manner with this Online Marketing Tactics To Enhance Sales Key Recommendations For Optimizing Content Structure PDF. Use them to share invaluable insights on Post Images, Hashtags And Usernames, Target Specific and impress your audience. This template can be altered and modified as per your expectations. So, grab it now.
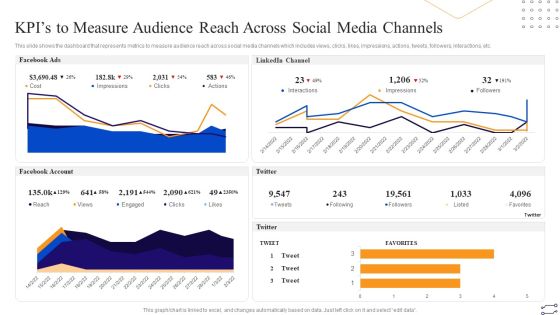
Online Marketing Tactics To Enhance Sales Kpis To Measure Audience Reach Across Social Media Professional PDF
This slide shows the dashboard that represents metrics to measure audience reach across social media channels which includes views, clicks, likes, impressions, actions, tweets, followers, interactions, etc. Deliver an awe inspiring pitch with this creative Online Marketing Tactics To Enhance Sales Kpis To Measure Audience Reach Across Social Media Professional PDF bundle. Topics like LinkedIn Channel, Facebook Account, Twitter, Facebook Ads can be discussed with this completely editable template. It is available for immediate download depending on the needs and requirements of the user.


 Continue with Email
 Sign up for an account
 Home
Home