AI PPT Maker
Templates
PPT Bundles
Design Services
Business PPTs
Business Plan
Management
Strategy
Introduction PPT
Roadmap
Self Introduction
Timelines
Process
Marketing
Agenda
Technology
Medical
Startup Business Plan
Cyber Security
Dashboards
SWOT
Proposals
Education
Pitch Deck
Digital Marketing
KPIs
Project Management
Product Management
Artificial Intelligence
Target Market
Communication
Supply Chain
Google Slides
Research Services
 One Pagers
All Categories
-
Home
- Customer Favorites
- Revenue
Revenue
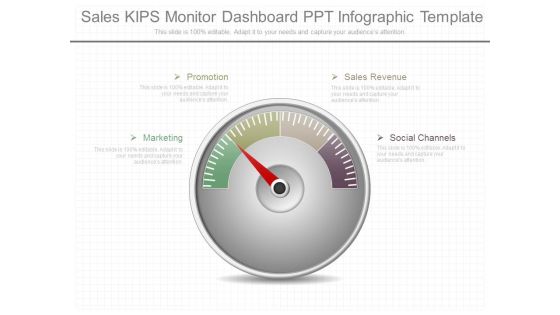
Sales Kips Monitor Dashboard Ppt Infographic Template
This is a sales kips monitor dashboard ppt infographic template. This is a four stage process. The stages in this process are promotion, marketing, sales revenue, social channels.
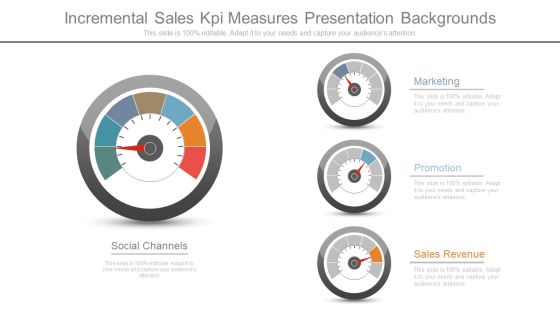
Incremental Sales Kpi Measures Presentation Backgrounds
This is a incremental sales kpi measures presentation backgrounds. This is a four stage process. The stages in this process are marketing, promotion, sales revenue, social channels.
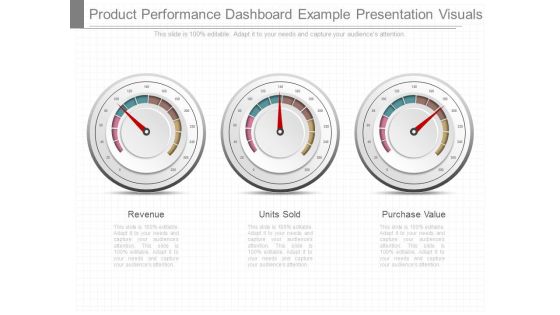
Product Performance Dashboard Example Presentation Visuals
This is a product performance dashboard example presentation visuals. This is a three stage process. The stages in this process are revenue, units sold, purchase value.
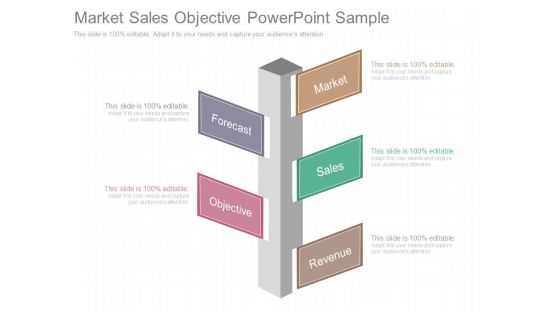
Market Sales Objective Powerpoint Sample
This is a market sales objective powerpoint sample. This is a five stage process. The stages in this process are market, forecast, sales, objective, revenue.

Optimising Services Template Powerpoint Guide
This is a optimising services template powerpoint guide. This is a five stage process. The stages in this process are maximising revenue, transformation, advisory, application, minimising costs.

Service Value Stream Management Template Powerpoint Slide Inspiration
This is a service value stream management template powerpoint slide inspiration. This is a four stage process. The stages in this process are value, waste, control, revenue.

Acquirement Marketing Layout Powerpoint Slide Backgrounds
This is a acquirement marketing layout powerpoint slide backgrounds. This is a six stage process. The stages in this process are acquisition, activation, retention, revenue, buying, knowledge.
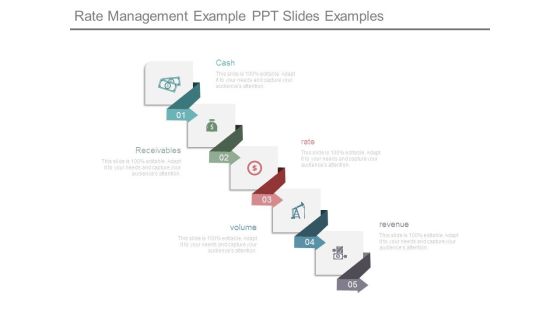
Rate Management Example Ppt Slides Examples
This is a rate management example ppt slides examples. This is a five stage process. The stages in this process are cash, receivables, rate, volume, revenue.

Affiliate Marketing Example Powerpoint Slide Designs
This is a affiliate marketing example powerpoint slide designs. This is a five stage process. The stages in this process are getting traffic, revenue, market research, brand, affiliate.
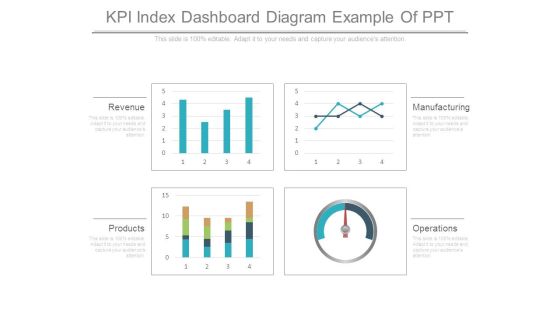
Kpi Index Dashboard Diagram Example Of Ppt
This is a kpi index dashboard diagram example of ppt. This is a four stage process. The stages in this process are revenue, products, operations, manufacturing.
Kpi Tracking Software Services Ppt Powerpoint Graphics
This is a kpi tracking software services ppt powerpoint graphics. This is a three stage process. The stages in this process are operations, revenue, manufacturing.

Sales Kpis Monitor Dashboard Ppt Infographic Template
This is a sales kpis monitor dashboard ppt infographic template. This is a one stage process. The stages in this process are promotion, marketing, sales revenue, social channels.
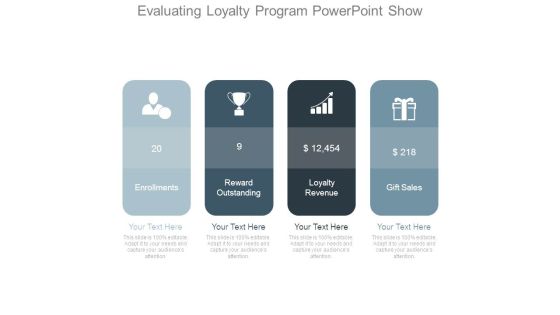
Evaluating Loyalty Program Powerpoint Show
This is a evaluating loyalty program powerpoint show. This is a four stage process. The stages in this process are enrollments, reward outstanding, loyalty revenue, gift sales.
Loyalty Program Metrics Ppt Icon
This is a loyalty program metrics ppt icon. This is a four stage process. The stages in this process are enrollments, reward outstanding, loyalty revenue, gift sales.

Loyalty Program Performance Metrics Ppt Background
This is a loyalty program performance metrics ppt background. This is a four stage process. The stages in this process are enrollments, reward outstanding, revenue, gift sales.

Crm Dashboard Kpis Ppt PowerPoint Presentation Pictures
This is a crm dashboard kpis ppt powerpoint presentation pictures. This is a five stage process. The stages in this process are revenue, acquisition, active subscribers.

Funnel Ppt PowerPoint Presentation Infographics
This is a funnel ppt powerpoint presentation infographics. This is a five stage process. The stages in this process are acquisition, activation, retention, revenue, referral.

Crowdfunding Escalator Ppt PowerPoint Presentation Inspiration Design Ideas
This is a crowdfunding escalator ppt powerpoint presentation inspiration design ideas. This is a five stage process. The stages in this process are maturity, expansion, validation, revenue, idea.

Campaign Report Ppt PowerPoint Presentation Show Tips
This is a campaign report ppt powerpoint presentation show tips. This is a five stage process. The stages in this process are spam, open, delivered, transactions, revenue.

Forecast And Projection Ppt PowerPoint Presentation Inspiration Ideas
This is a forecast and projection ppt powerpoint presentation inspiration ideas. This is a three stage process. The stages in this process are revenue, expenses, purchases.
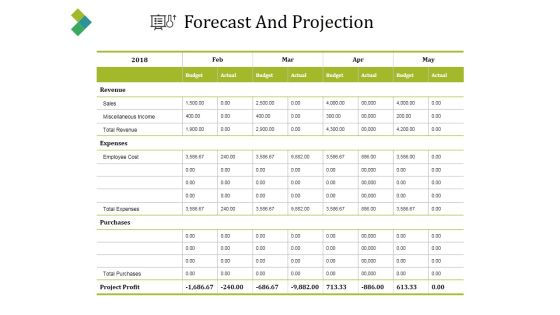
Forecast And Projection Ppt PowerPoint Presentation Portfolio Show
This is a forecast and projection ppt powerpoint presentation portfolio show. This is a four stage process. The stages in this process are revenue, sales, budget, actual, expenses.

Business Model Framework Ppt PowerPoint Presentation Infographics Deck
This is a business model framework ppt powerpoint presentation infographics deck. This is a eight stage process. The stages in this process are services, revenue, customers, competencies, costs.

Company Payout Dashboard For Subscription Based Startup Designs PDF
The slide carries different metrics to evaluate and record payments of subscription-based business start-up. Various KPIs included are net revenue, MRR, customers, current day revenue, failed and successful payments, live feed- subscription and payments. Pitch your topic with ease and precision using this Company Payout Dashboard For Subscription Based Startup Designs PDF. This layout presents information on Net Revenue, MRR, Customers, Current Day Revenue. It is also available for immediate download and adjustment. So, changes can be made in the color, design, graphics or any other component to create a unique layout.

Assessing Stocks In Financial Market Income Statement Of Target Company Ppt PowerPoint Presentation Infographic Template Graphics Download PDF
Presenting this set of slides with name assessing stocks in financial market income statement of target company ppt powerpoint presentation infographic template graphics download pdf. The topics discussed in these slides are revenue, cost revenue, gross profit, operating expenses, research and development. This is a completely editable PowerPoint presentation and is available for immediate download. Download now and impress your audience.
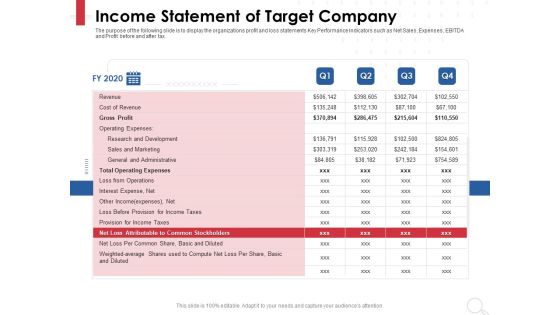
Equity Analysis Project Income Statement Of Target Company Ppt PowerPoint Presentation Model Influencers PDF
Presenting this set of slides with name equity analysis project income statement of target company ppt powerpoint presentation model influencers pdf. The topics discussed in these slides are revenue, cost revenue, gross profit, operating expenses, research and development. This is a completely editable PowerPoint presentation and is available for immediate download. Download now and impress your audience.

Forecast And Projection Ppt PowerPoint Presentation Styles Graphics Design
Presenting this set of slides with name forecast and projection ppt powerpoint presentation styles graphics design. The topics discussed in these slides are revenue, sales, miscellaneous income, total revenue, expenses, employee cost, total expenses, purchases, total purchases, project profit. This is a completely editable PowerPoint presentation and is available for immediate download. Download now and impress your audience.

Venture Capitalist Control Board Different Branch Locations Performance Assessment Dashboard Graphics PDF
Presenting this set of slides with name venture capitalist control board different branch locations performance assessment dashboard graphics pdf. The topics discussed in these slides are room free revenue, ancillary revenue, key performance indicators, room gross margin, location description, vacancy rate. This is a completely editable PowerPoint presentation and is available for immediate download. Download now and impress your audience.
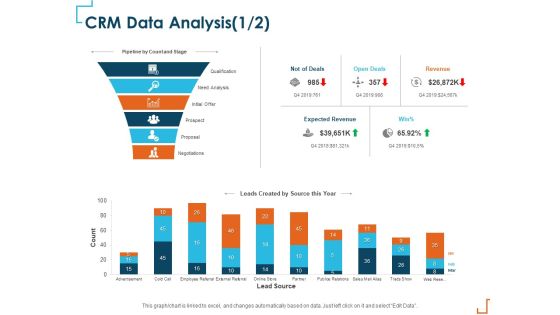
Introducing CRM Framework Within Organization CRM Data Analysis Leads Ppt PowerPoint Presentation Show Background Image PDF
Presenting this set of slides with name introducing crm framework within organization crm data analysis leads ppt powerpoint presentation show background image pdf. The topics discussed in these slides are qualification, need analysis, initial offer, prospect, open deals, revenue, expected revenue. This is a completely editable PowerPoint presentation and is available for immediate download. Download now and impress your audience.

Administrative Regulation Business Management Dashboards Customer Ppt PowerPoint Presentation Images PDF
Deliver an awe-inspiring pitch with this creative administrative regulation business management dashboards customer ppt powerpoint presentation images pdf bundle. Topics like actual revenue, target revenue, target achievement, new customers, customer acquisition cost can be discussed with this completely editable template. It is available for immediate download depending on the needs and requirements of the user.

Customer Relationship Management Action Plan CRM Data Analysis Icon Background PDF
Deliver an awe inspiring pitch with this creative customer relationship management action plan crm data analysis icon background pdf bundle. Topics like expected revenue, revenue, open deals can be discussed with this completely editable template. It is available for immediate download depending on the needs and requirements of the user.

Annual Sales Performance Review Dashboard For Year Ended 2023 24 Formats PDF
Showcasing this set of slides titled Annual Sales Performance Review Dashboard For Year Ended 2023 24 Formats PDF. The topics addressed in these templates are Product Wise Revenue, Channel Wise Revenue, Gross Sales. All the content presented in this PPT design is completely editable. Download it and make adjustments in color, background, font etc. as per your unique business setting.

Assuring Management In Product Innovation To Enhance Processes Measuring Business Unit Performance Dashboard Inspiration PDF
This slide covers dashboard that shows business unit performance such as new customers, average weekly sales revenue, sales revenues, profits, customer lifetime value, etc.Deliver an awe inspiring pitch with this creative assuring management in product innovation to enhance processes measuring business unit performance dashboard inspiration pdf bundle. Topics like average weekly sales revenue, customer lifetime value, customer acquisition cost can be discussed with this completely editable template. It is available for immediate download depending on the needs and requirements of the user.

Funding Pitch On Growth Across Operating Segments Ppt Layout PDF
This slide illustrates growth of operating profit and gross revenue. It includes gross revenue, EBITA, operating profit margin, profit after tax, EPS, INTERIM dividend etc. Persuade your audience using this Funding Pitch On Growth Across Operating Segments Ppt Layout PDF. This PPT design covers one stages, thus making it a great tool to use. It also caters to a variety of topics including Gross Revenue, EBITDA, Profit After Tax. Download this PPT design now to present a convincing pitch that not only emphasizes the topic but also showcases your presentation skills.
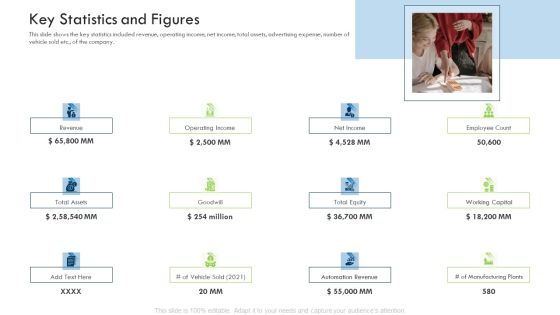
Investor Deck Procure Funds Bridging Loan Key Statistics And Figures Mockup PDF
This slide shows the key statistics included revenue, operating income, net income, total assets, advertising expense, number of vehicle sold etc., of the company. This is a investor deck procure funds bridging loan key statistics and figures mockup pdf template with various stages. Focus and dispense information on twelve stages using this creative set, that comes with editable features. It contains large content boxes to add your information on topics like total assets, revenue, operating income, automation revenue, total equity. You can also showcase facts, figures, and other relevant content using this PPT layout. Grab it now.
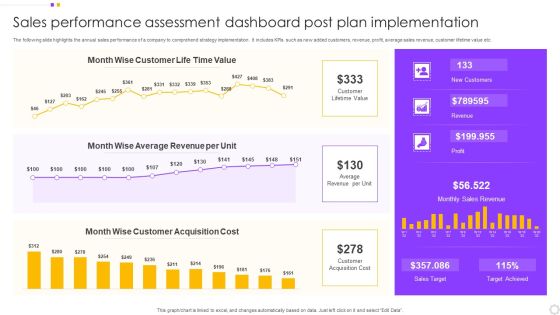
Sales Performance Assessment Dashboard Post Plan Implementation Introduction PDF
The following slide highlights the annual sales performance of a company to comprehend strategy implementation. It includes KPIs such as new added customers, revenue, profit, average sales revenue, customer lifetime value etc. Pitch your topic with ease and precision using this Sales Performance Assessment Dashboard Post Plan Implementation Introduction PDF. This layout presents information on Customer, Value, Average Revenue. It is also available for immediate download and adjustment. So, changes can be made in the color, design, graphics or any other component to create a unique layout.

Sales Work Action Plan Analysis Dashboard Brochure PDF
This slide covers the dashboard for analyzing the sales plan implemented in an organization. The purpose of this template is to assess strategical and operational aspects of the company. It includes key performance indicators such as number of sales, revenue, profit, cost, etc. Showcasing this set of slides titled Sales Work Action Plan Analysis Dashboard Brochure PDF. The topics addressed in these templates are Sales Revenue, Cost Breakdown, Accumulated Revenue. All the content presented in this PPT design is completely editable. Download it and make adjustments in color, background, font etc. as per your unique business setting.

Unschool Platform Business Profile Key Statistics Portrait PDF
The slide highlights the key statistical data of Unschool company illustrating count of internship partners, industry experts, and active learners. It also showcases revenue, placement rate, course prices, course completion rate and Q O Q growth rate. Presenting Revenue, Placement Rate, Industry Experts to provide visual cues and insights. Share and navigate important information on nine stages that need your due attention. This template can be used to pitch topics like Revenue, Placement Rate, Industry Experts. In addtion, this PPT design contains high resolution images, graphics, etc, that are easily editable and available for immediate download.

Description Product Sales Performance Analysis Dashboard Ppt PowerPoint Presentation File Samples PDF
The following slide highlights the KPIs of product sales to assess sales performance over the past few years to formulate new strategy. It includes elements such as revenue, offline and online sales, monthly cost analysis etc. Pitch your topic with ease and precision using this Description Product Sales Performance Analysis Dashboard Ppt PowerPoint Presentation File Samples PDF. This layout presents information on Product Wise Revenue, Monthly Cost Analysis, Sales Revenue, Different Strategies. It is also available for immediate download and adjustment. So, changes can be made in the color, design, graphics or any other component to create a unique layout.

Financial Ppt PowerPoint Presentation Inspiration
This is a financial ppt powerpoint presentation inspiration. This is a six stage process. The stages in this process are total assets, total tax paid, loan, revenue, deposits, net income.
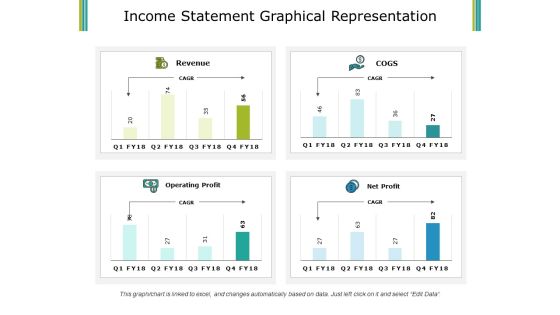
Income Statement Graphical Representation Ppt PowerPoint Presentation Summary Inspiration
This is a income statement graphical representation ppt powerpoint presentation summary inspiration. This is a four stage process. The stages in this process are revenue, cogs, operating profit, net profit.

Income Statement Graphical Representation Template Ppt PowerPoint Presentation Model Infographic Template
This is a income statement graphical representation template ppt powerpoint presentation model infographic template. This is a four stage process. The stages in this process are revenue, cogs, operating profit, net profit.
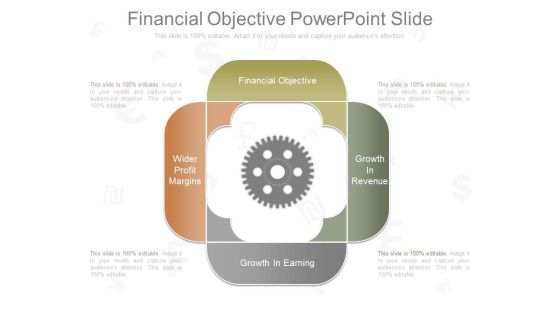
Financial Objective Powerpoint Slide
This is a financial objective powerpoint slide. This is a four stage process. The stages in this process are financial objective, growth in revenue, growth in earning, wider profit margins.

Financial Highlights Template 2 Ppt PowerPoint Presentation Inspiration
This is a financial highlights template 2 ppt powerpoint presentation inspiration. This is a six stage process. The stages in this process are sales revenue, ebitdax, net profit after tax, production, operating cash flow, underlying net profit, after tax.
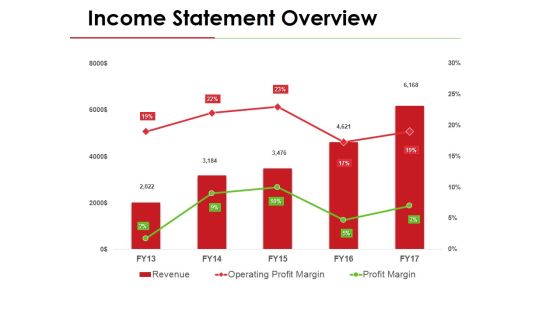
Income Statement Overview Ppt PowerPoint Presentation Gallery Template
This is a income statement overview ppt powerpoint presentation gallery template. This is a three stage process. The stages in this process are revenue, operating profit margin, profit margin.
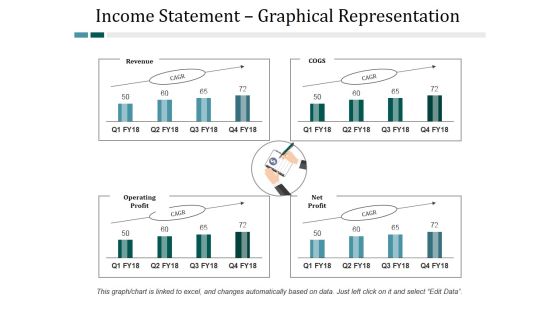
Income Statement Graphical Representation Ppt PowerPoint Presentation Layouts Designs Download
This is a income statement graphical representation ppt powerpoint presentation layouts designs download. This is a four stage process. The stages in this process are revenue, cogs, operating profit, net profit.
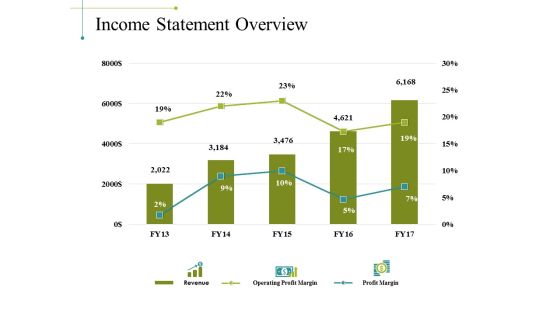
Income Statement Overview Ppt PowerPoint Presentation File Objects
This is a income statement overview ppt powerpoint presentation file objects. This is a three stage process. The stages in this process are business, market revenue, operating profit margin, profit margin.
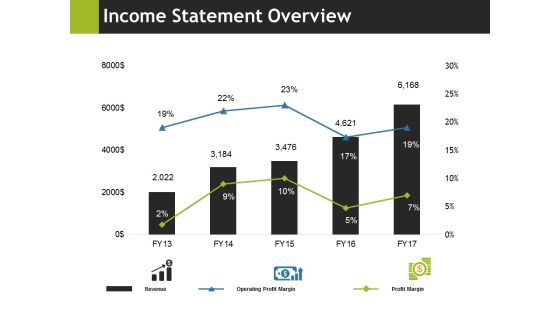
Income Statement Overview Ppt PowerPoint Presentation Professional Portfolio
This is a income statement overview ppt powerpoint presentation professional portfolio. This is a five stage process. The stages in this process are business, marketing, revenue, operating profit margin, profit margin.

Income Statement Graphical Representation Ppt PowerPoint Presentation Pictures Design Templates
This is a income statement graphical representation ppt powerpoint presentation pictures design templates. This is a four stage process. The stages in this process are revenue, operating profit, net profit, cogs, business.
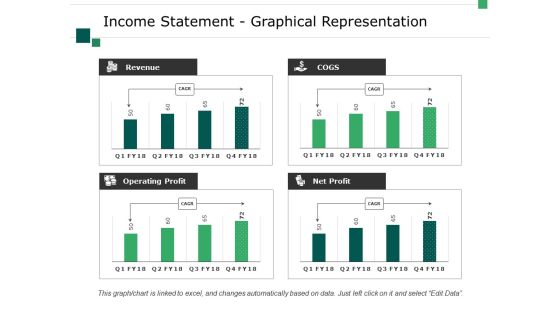
Income Statement Graphical Representation Ppt PowerPoint Presentation Visual Aids Layouts
This is a income statement graphical representation ppt powerpoint presentation visual aids layouts. This is a four stage process. The stages in this process are business, marketing, revenue, operating profit, net profit, cogs.

Financial Ppt PowerPoint Presentation File Format Ideas
This is a financial ppt powerpoint presentation file format ideas. This is a six stage process. The stages in this process are total assets, total tax paid, loan, revenue, deposits, net income.

Financial Ppt PowerPoint Presentation Inspiration Templates
This is a financial ppt powerpoint presentation inspiration templates. This is a six stage process. The stages in this process are total assets, revenue, total tax paid, deposits, loan, net income.

Business Tax Deductions Diagram Example Of Ppt
This is a business tax deductions diagram example of ppt. This is a four stage process. The stages in this process are revenue, business expenses, gross income, taxable income.
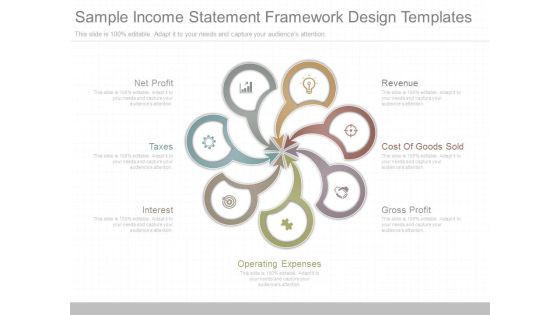
Sample Income Statement Framework Design Templates
This is a sample income statement framework design templates. This is a seven stage process. The stages in this process are net profit, taxes, interest, revenue, cost of goods sold, gross profit, operating expenses.
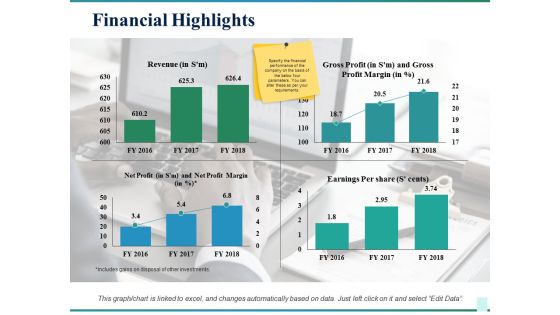
Financial Highlights Ppt PowerPoint Presentation Infographic Template Slide Download
This is a financial highlights ppt powerpoint presentation infographic template slide download. This is a four stage process. The stages in this process are business, revenue, gross profit, earnings per share, net profit, marketing.

Current Financial Highlights Ppt PowerPoint Presentation Professional Slide Download
This is a current financial highlights ppt powerpoint presentation professional slide download. This is a four stage process. The stages in this process are revenue, gross profit, net profit, earnings per share.
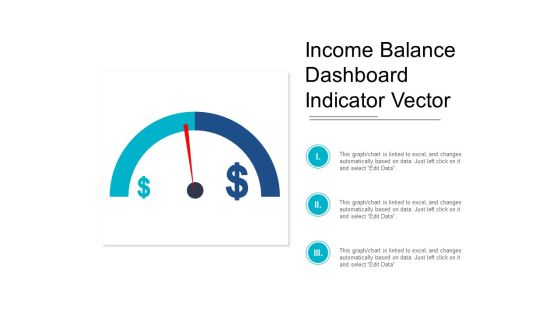
Income Balance Dashboard Indicator Vector Ppt PowerPoint Presentation Professional Diagrams
This is a income balance dashboard indicator vector ppt powerpoint presentation professional diagrams. This is a three stage process. The stages in this process are growth, increase sales, increase revenue.
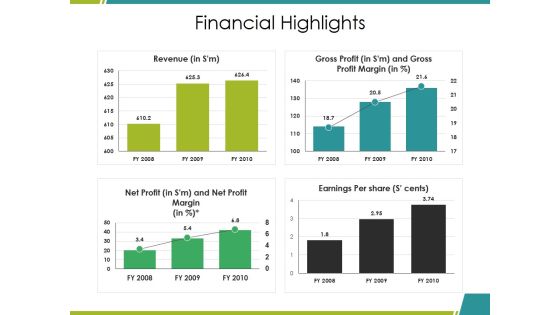
Financial Highlights Ppt PowerPoint Presentation Ideas Graphics Download
This is a financial highlights ppt powerpoint presentation ideas graphics download. This is a four stage process. The stages in this process are revenue, gross profit, net profit, earnings per share, bar graph.
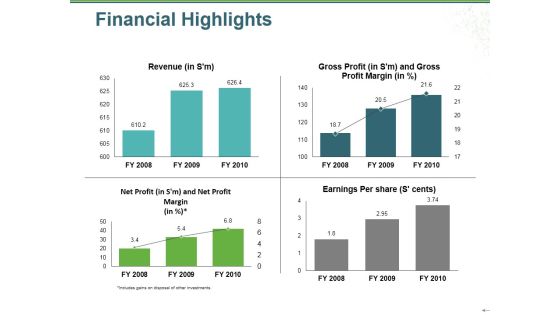
Financial Highlights Ppt PowerPoint Presentation Gallery Graphics Example
This is a financial highlights ppt powerpoint presentation gallery graphics example. This is a four stage process. The stages in this process are revenue, gross profit, net profit, earnings per share, bar graph.

Current Financial Highlights Ppt PowerPoint Presentation File Demonstration
This is a current financial highlights ppt powerpoint presentation show example. This is a four stage process. The stages in this process are revenue, net profit, earnings per share, gross profit.
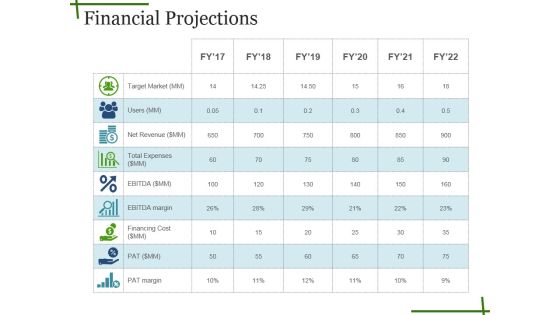
Financial Projections Ppt PowerPoint Presentation Show Format
This is a financial projections ppt powerpoint presentation show format. This is a six stage process. The stages in this process are total assets, total tax paid, loan, revenue, deposits.
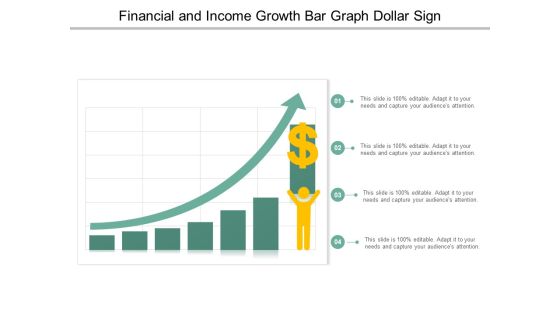
Financial And Income Growth Bar Graph Dollar Sign Ppt PowerPoint Presentation Professional Shapes
This is a financial and income growth bar graph dollar sign ppt powerpoint presentation professional shapes. This is a four stage process. The stages in this process are growth, increase sales, increase revenue.

Decrease Cost And Income Growth Dashboard Ppt PowerPoint Presentation Inspiration Guide
This is a decrease cost and income growth dashboard ppt powerpoint presentation inspiration guide. This is a three stage process. The stages in this process are growth, increase sales, increase revenue.

Financials Base Plan Ppt PowerPoint Presentation Examples
This is a financials base plan ppt powerpoint presentation examples. This is a three stage process. The stages in this process are revenue, cost of sales, gross profit, customer acquisition cost, other operating cost expense, operating profit, change in cash.
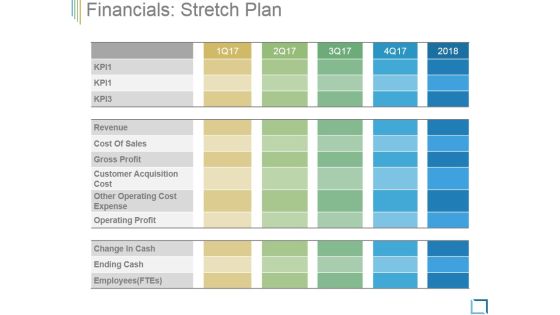
Financials Stretch Plan Ppt PowerPoint Presentation Influencers
This is a financials stretch plan ppt powerpoint presentation influencers. This is a three stage process. The stages in this process are revenue, cost of sales, gross profit, customer acquisition cost, other operating cost expense, operating profit, change in cash.
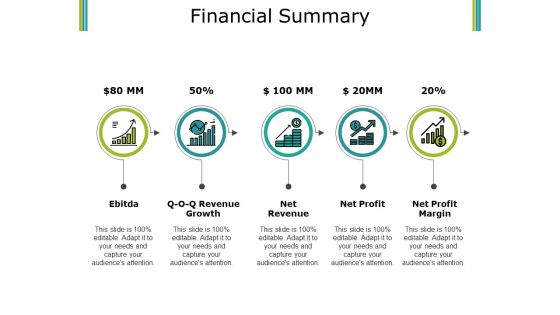
Financial Summary Ppt PowerPoint Presentation Inspiration Influencers
This is a financial summary ppt powerpoint presentation inspiration influencers. This is a five stage process. The stages in this process are ebitda, net revenue, net profit, net profit margin.

Financial Predictions Ppt PowerPoint Presentation File Clipart Images
This is a financial predictions ppt powerpoint presentation file clipart images. This is a three stage process. The stages in this process are revenue, expense, aggregate net income, monthly breakeven, aggregate breakeven.
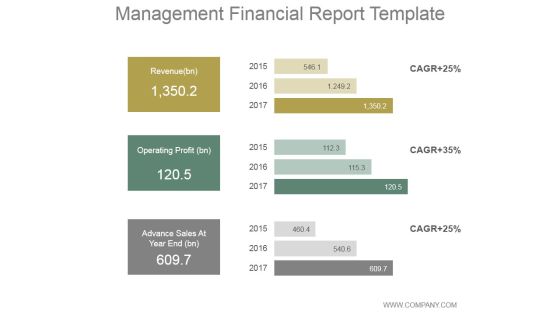
Management Financial Report Ppt PowerPoint Presentation Diagrams
This is a management financial report ppt powerpoint presentation diagrams. This is a three stage process. The stages in this process are revenue, operating profit, advance sales at year end.
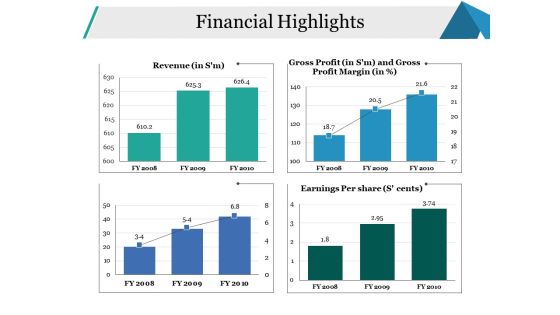
Financial Highlights Ppt PowerPoint Presentation File Background Designs
This is a financial highlights ppt powerpoint presentation file background designs. This is a four stage process. The stages in this process are revenue, earnings per share, financial, business, marketing.
Profit And Financial Growth Arrow With Dollar Signs Ppt PowerPoint Presentation Icon Topics
This is a profit and financial growth arrow with dollar signs ppt powerpoint presentation icon topics. This is a three stage process. The stages in this process are growth, increase sales, increase revenue.

Financials Base Plan Ppt PowerPoint Presentation Portfolio
This is a financials base plan ppt powerpoint presentation portfolio. This is a five stage process. The stages in this process are revenue, cost of sales, gross profit, customer acquisition cost, other operating cost expense.
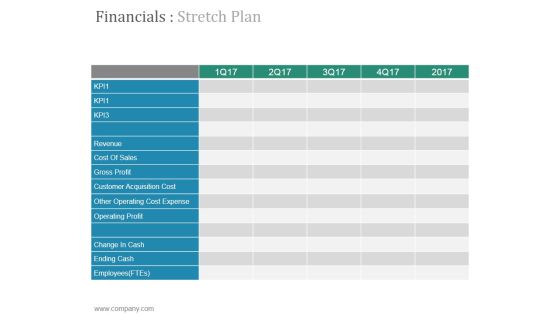
Financials Stretch Plan Ppt PowerPoint Presentation Designs
This is a financials stretch plan ppt powerpoint presentation designs. This is a five stage process. The stages in this process are revenue, cost of sales, gross profit, customer acquisition cost, other operating cost expense.
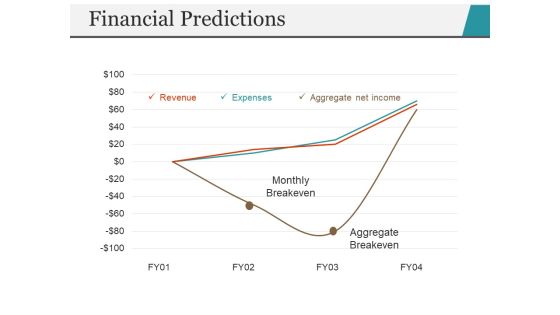
Financial Predictions Template 2 Ppt PowerPoint Presentation Inspiration
This is a financial predictions template 2 ppt powerpoint presentation inspiration. This is a four stage process. The stages in this process are revenue, expenses, aggregate net income, aggregate breakeven, monthly breakeven.

P And L Kpis Template 2 Ppt PowerPoint Presentation Styles Objects
This is a p and l kpis template 2 ppt powerpoint presentation styles objects. This is a four stage process. The stages in this process are revenue, cogs, operating profit, net profit.

P And L Kpis Template 1 Ppt PowerPoint Presentation Model Inspiration
This is a p and l kpis template 1 ppt powerpoint presentation model inspiration. This is a four stage process. The stages in this process are revenue, cogs, operating profit, net profit.
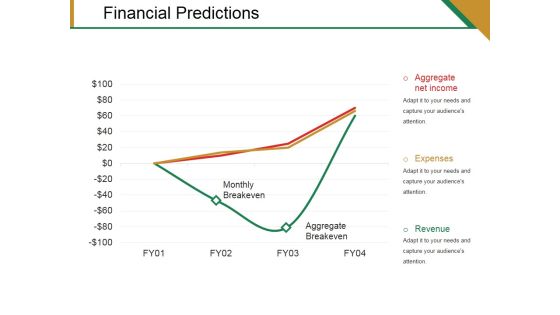
Financial Predictions Template 2 Ppt PowerPoint Presentation Templates
This is a financial predictions template 2 ppt powerpoint presentation templates. This is a three stage process. The stages in this process are monthly breakeven, aggregate breakeven, aggregate net income, expenses, revenue.
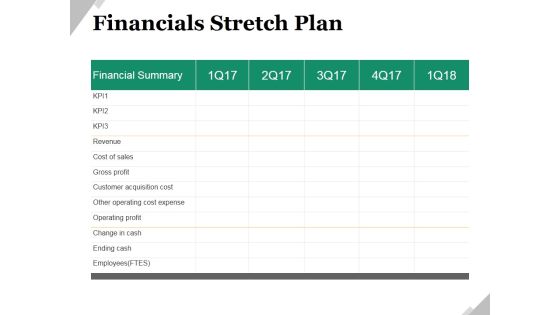
Financials Stretch Plan Ppt PowerPoint Presentation Ideas Shapes
This is a financials stretch plan ppt powerpoint presentation ideas shapes. This is a five stage process. The stages in this process are revenue, cost of sales, gross profit, customer acquisition cost, other operating cost expense, operating profit.

Financials Base Plan Ppt PowerPoint Presentation Styles Clipart Images
This is a financials base plan ppt powerpoint presentation styles clipart images. This is a five stage process. The stages in this process are revenue, cost of sales, gross profit, customer acquisition cost, other operating cost expense, operating profit.

Financials Stretch Plan Ppt PowerPoint Presentation Slides Background Images
This is a financials stretch plan ppt powerpoint presentation slides background images. This is a five stage process. The stages in this process are revenue, cost of sales, gross profit, customer acquisition cost, other operating cost expense, operating profit.
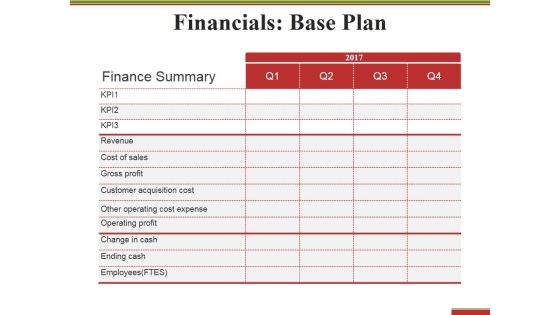
Financials Base Plan Ppt PowerPoint Presentation Styles Graphic Tips
This is a financials base plan ppt powerpoint presentation styles graphic tips. This is a four stage process. The stages in this process are finance summary, revenue, gross profit, operating profit, ending cash.

Financials Starch Plan Ppt PowerPoint Presentation Summary Professional
This is a financials starch plan ppt powerpoint presentation summary professional. This is a four stage process. The stages in this process are finance summary, revenue, gross profit, operating profit, ending cash.

Last 30 Days Results Ppt PowerPoint Presentation Summary Brochure
This is a last 30 days results ppt powerpoint presentation summary brochure. This is a four stage process. The stages in this process are revenue, new customers, gross profit, customer satisfaction.

Sales Performance Dashboard Top Opportunities Ppt PowerPoint Presentation Layouts Template
This is a sales performance dashboard top opportunities ppt powerpoint presentation layouts template. This is a eight stage process. The stages in this process are revenue, new customer, gross profit, customer satisfaction, brand profitability.

Content Marketing Performance Ppt PowerPoint Presentation Slides Model
This is a content marketing performance ppt powerpoint presentation slides model. This is a eight stage process. The stages in this process are conversion rate, quality of leads, number of leads, sales revenue, website traffic.
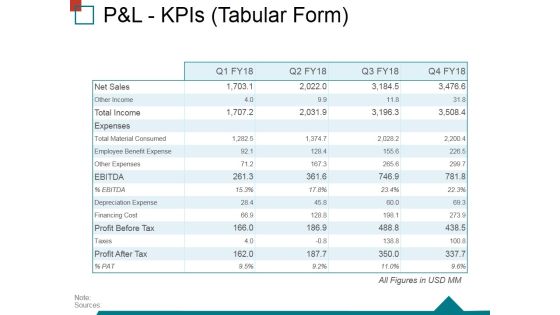
Pandl Kpis Tabular Form Ppt PowerPoint Presentation Ideas Structure
This is a pandl kpis tabular form ppt powerpoint presentation ideas structure. This is a four stage process. The stages in this process are operating profit, revenue, cogs, net profit.
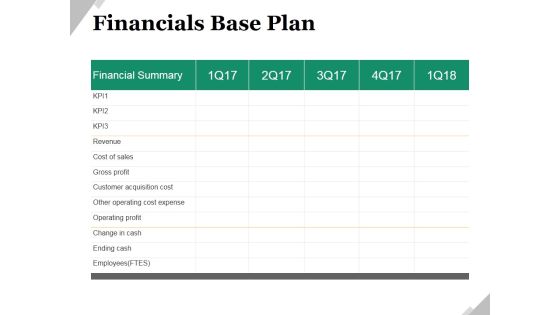
Financials Base Plan Ppt PowerPoint Presentation Model Shapes
This is a financials base plan ppt powerpoint presentation model shapes. This is a five stage process. The stages in this process are financial summary, business, marketing, revenue, cost of sales, gross profit.

Financials Base Plan Ppt Powerpoint Presentation Slides Design Inspiration
This is a financials base plan ppt powerpoint presentation slides design inspiration. This is a four stage process. The stages in this process are financial summary, revenue, cost of sales, gross profit.
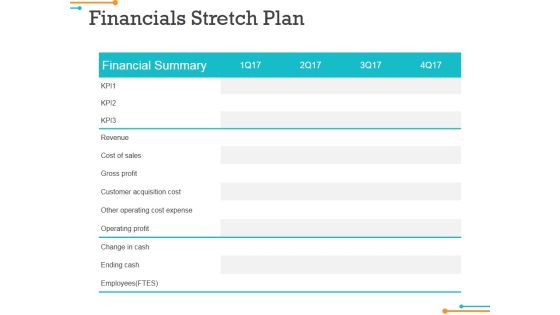
Financials Stretch Plan Ppt Powerpoint Presentation Infographics Background Image
This is a financials stretch plan ppt powerpoint presentation infographics background image. This is a four stage process. The stages in this process are financial summary, revenue, cost of sales, gross profit.

Financials Base Plan Ppt PowerPoint Presentation Portfolio Background Designs
This is a financials base plan ppt powerpoint presentation portfolio background designs. This is a four stage process. The stages in this process are revenue, cost of sales, gross profit, customer acquisition cost, other operating cost expense.
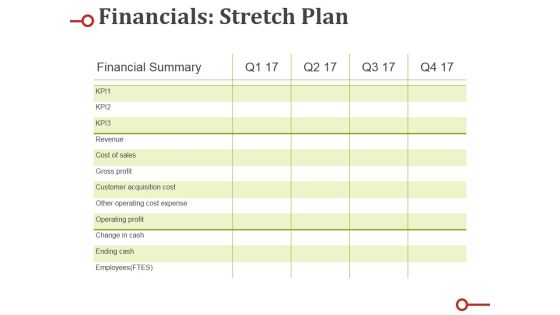
Financials Stretch Plan Ppt PowerPoint Presentation Show Designs Download
This is a financials stretch plan ppt powerpoint presentation show designs download. This is a four stage process. The stages in this process are revenue, cost of sales, gross profit, customer acquisition cost, other operating cost expense.

Current State Analysis Financial Comparison Ppt PowerPoint Presentation Inspiration Good
This is a current state analysis financial comparison ppt powerpoint presentation inspiration good. This is a five stage process. The stages in this process are revenue, profits, cash balance, competitor.

Financial Management For Marketing Ppt Design
This is a financial management for marketing ppt design. This is a six stage process. The stages in this process are finance policies, bookkeeping accounting, financial planning, preparation for an audit, financial performance, revenue.
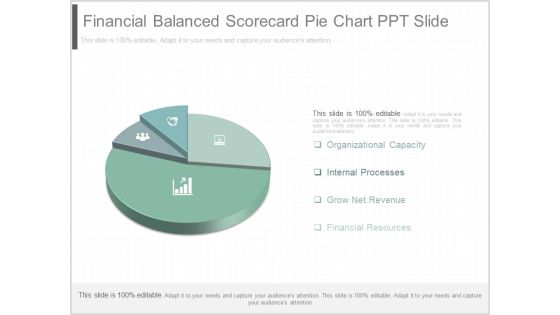
Financial Balanced Scorecard Pie Chart Ppt Slide
This is a financial balanced scorecard pie chart ppt slide. This is a four stage process. The stages in this process are organizational capacity, internal processes, grow net revenue, financial resources.

Financial Accounting Supplier Management Ppt Sample
This is a financial accounting supplier management ppt sample. This is a six stage process. The stages in this process are financial accounting, supplier management, revenue, management, resource management, cash management, pend management.

Income Statement Graphical Representation Ppt PowerPoint Presentation Infographics Layouts
This is a income statement graphical representation ppt powerpoint presentation infographics layouts. This is a four stage process. The stages in this process are revenue, cogs, operating profit, net profit.
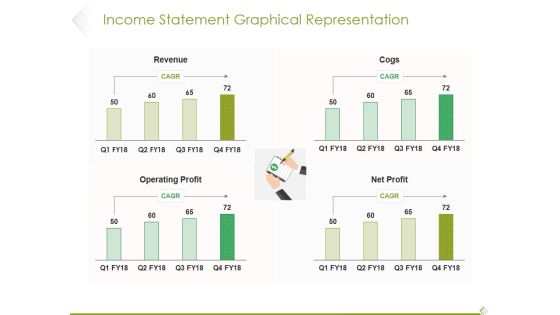
Income Statement Graphical Representation Ppt PowerPoint Presentation Infographic Template Influencers
This is a income statement graphical representation ppt powerpoint presentation infographic template influencers. This is a four stage process. The stages in this process are revenue, cogs, operating profit, profit.
Income Statement Overview Ppt PowerPoint Presentation Infographic Template Icon
This is a income statement overview ppt powerpoint presentation infographic template icon. This is a five stage process. The stages in this process are revenue, profit margin, operating profit margin.
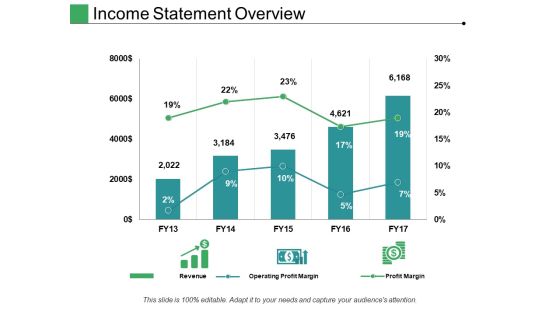
Income Statement Overview Ppt PowerPoint Presentation File Structure
This is a income statement overview ppt powerpoint presentation file structure. This is a five stage process. The stages in this process are revenue, operating profit margin, profit margin.

Financial Ppt PowerPoint Presentation Show Graphic Tips
This is a financial ppt powerpoint presentation show graphic tips. This is a six stage process. The stages in this process are target market, users, net revenue, total expenses.
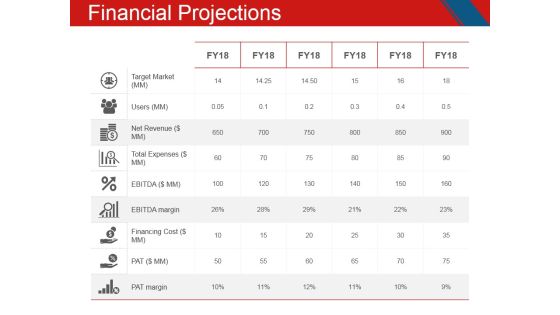
Financial Projections Ppt PowerPoint Presentation Inspiration Deck
This is a financial projections ppt powerpoint presentation inspiration deck. This is a six stage process. The stages in this process are target market, users, net revenue, total expenses, financing cost.

Financial Ppt PowerPoint Presentation Summary Graphics Tutorials
This is a financial ppt powerpoint presentation summary graphics tutorials. This is a six stage process. The stages in this process are target market, users, net revenue, total expenses, ebitda.
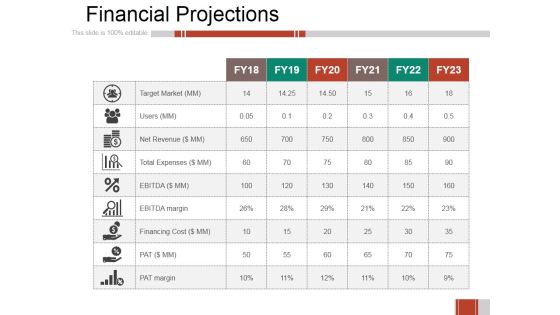
Financial Projections Ppt PowerPoint Presentation Styles Microsoft
This is a financial projections ppt powerpoint presentation styles microsoft. This is a six stage process. The stages in this process are target market, users, net revenue, total expenses, financing cost.

Financial Projections Ppt PowerPoint Presentation Model Diagrams
This is a financial projections ppt powerpoint presentation model diagrams. This is a six stage process. The stages in this process are target market, net revenue, ebitda margin, financing cost, pat margin.
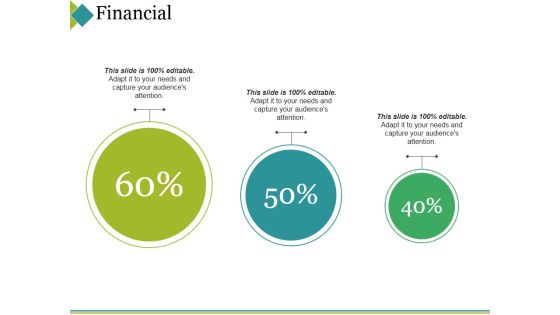
Financial Ppt PowerPoint Presentation Layouts Portrait
This is a financial ppt powerpoint presentation layouts portrait. This is a seven stage process. The stages in this process are target market, users, net revenue, financing cost, total expenses.

Financial Ppt PowerPoint Presentation Pictures Inspiration
This is a financial ppt powerpoint presentation pictures inspiration. This is a six stage process. The stages in this process are target market, users, net revenue, total expenses, pat margin.
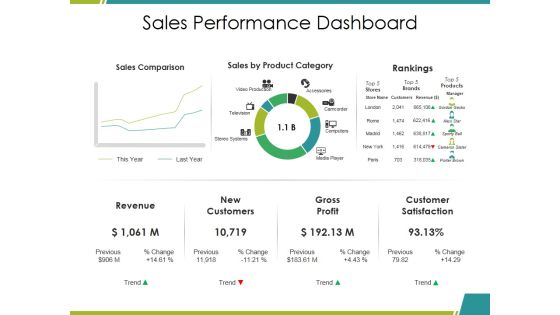
Sales Performance Dashboard Ppt PowerPoint Presentation Infographics Mockup
This is a sales performance dashboard ppt powerpoint presentation infographics mockup. This is a three stage process. The stages in this process are sales comparison, sales by product category, rankings, revenue, gross profit.

Sales Performance Dashboard Ppt PowerPoint Presentation Outline File Formats
This is a sales performance dashboard ppt powerpoint presentation outline file formats. This is a three stage process. The stages in this process are revenue, new customers, gross profit, customer satisfaction, rankings.

Last 90 Days Results Ppt PowerPoint Presentation Introduction
This is a last 90 days results ppt powerpoint presentation introduction. This is a six stage process. The stages in this process are revenue, new customers, gross profit, sales comparison.

Financials Summary Base Plan Vs Stretch Plan Ppt PowerPoint Presentation File Shapes
This is a financials summary base plan vs stretch plan ppt powerpoint presentation file shapes. This is a three stage process. The stages in this process are finance summary, revenue, gross profit, operating profit, ending cash.
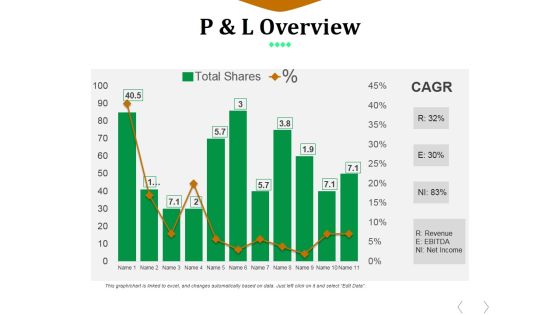
P And L Overview Ppt PowerPoint Presentation Styles Summary
This is a p and l overview ppt powerpoint presentation styles summary. This is a eleven stage process. The stages in this process are revenue, ebitda, net income, total shares.

Pandl Kpis Tabular Form Ppt PowerPoint Presentation Visual Aids
This is a pandl kpis tabular form ppt powerpoint presentation visual aids. This is a four stage process. The stages in this process are revenue, cogs, operating profit, net profit.

P And L Kpis Template 1 Ppt PowerPoint Presentation Design Ideas
This is a p and l kpis template 1 ppt powerpoint presentation design ideas. This is a four stage process. The stages in this process are revenue, cogs, operating profit, net profit.
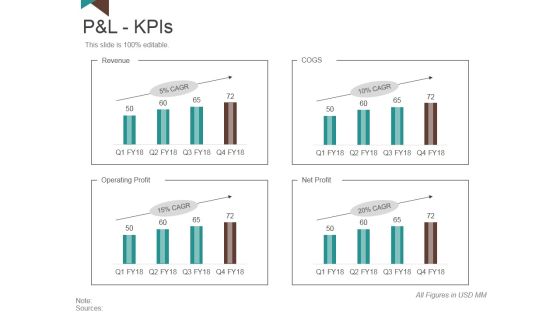
P And L Kpis Template 1 Ppt PowerPoint Presentation Slides Model
This is a p and l kpis template 1 ppt powerpoint presentation slides model. This is a four stage process. The stages in this process are revenue, operating profit, net profit, cogs.
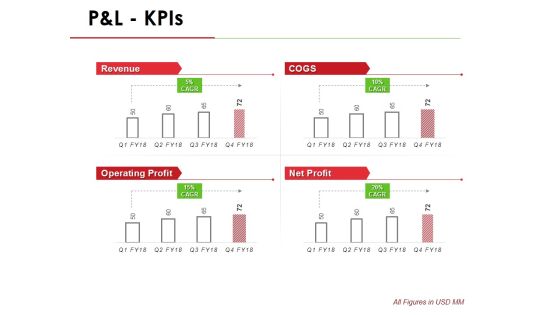
P And L Kpis Template 1 Ppt PowerPoint Presentation Infographic Template Outline
This is a p and l kpis template 1 ppt powerpoint presentation infographic template outline. This is a four stage process. The stages in this process are revenue, operating profit, cogs, net profit.
Pandl Kpis Tabular Form Ppt PowerPoint Presentation Gallery Icon
This is a pandl kpis tabular form ppt powerpoint presentation gallery icon. This is a four stage process. The stages in this process are revenue, cogs, operating profit, net profit.
P And L Kpis Template 2 Ppt PowerPoint Presentation Summary Icon
This is a p and l kpis template 2 ppt powerpoint presentation summary icon. This is a four stage process. The stages in this process are revenue, cogs, operating profit, net profit.

Pandl Kpis Tabular Form Ppt PowerPoint Presentation Pictures Visual Aids
This is a pandl kpis tabular form ppt powerpoint presentation pictures visual aids. This is a four stage process. The stages in this process are revenue, operating profit, cogs, net profit.
Pandl Kpis Template Ppt PowerPoint Presentation Model Icon
This is a pandl kpis template ppt powerpoint presentation model icon. This is a four stage process. The stages in this process are revenue, cogs, operating profit, net profit.
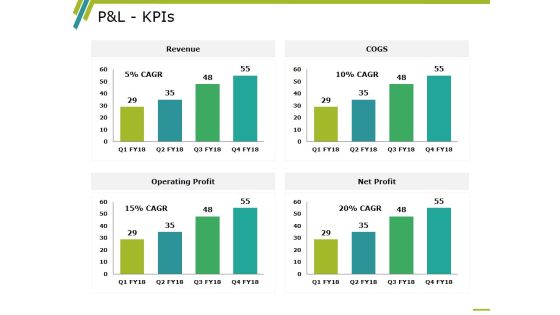
P And L Kpis Template 2 Ppt PowerPoint Presentation Professional Information
This is a p and l kpis template 2 ppt powerpoint presentation professional information. This is a four stage process. The stages in this process are revenue, operating profit, cogs, net profit, business.
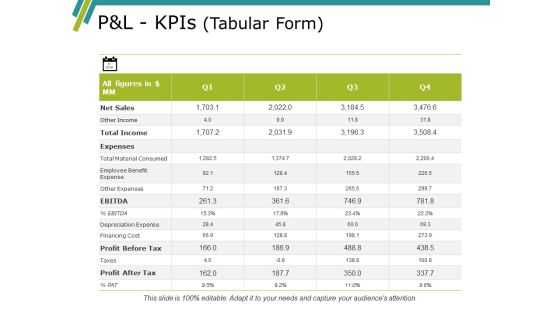
Pandl Kpis Template Ppt PowerPoint Presentation Gallery Summary
This is a pandl kpis template ppt powerpoint presentation gallery summary. This is a four stage process. The stages in this process are revenue, cogs, operating profit, net profit.
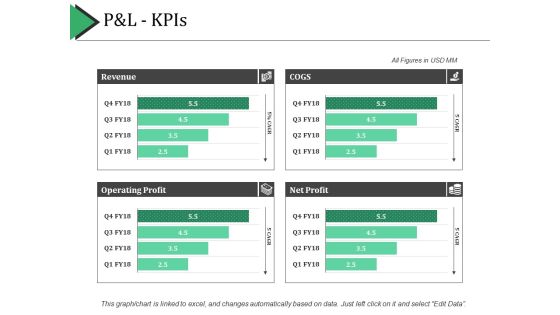
P And L Kpis Ppt PowerPoint Presentation Show Example Introduction
This is a p and l kpis ppt powerpoint presentation show example introduction. This is a four stage process. The stages in this process are revenue, cogs, net profit, operating profit.
