Revenue Model

Business Performance Dashboard Brand Techniques Structure Introduction PDF
Following slide covers business performance dashboard of the firm. It include KPIs such as average weekly sales revenue, above sales target, sales revenue and profit generated. Deliver an awe inspiring pitch with this creative business performance dashboard brand techniques structure introduction pdf bundle. Topics like average, revenue, sales, profit, cost can be discussed with this completely editable template. It is available for immediate download depending on the needs and requirements of the user.
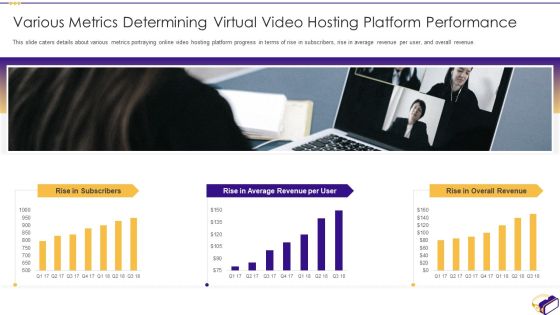
Virtual Video Hosting Applications Investor Fundraising Elevator Various Metrics Determining Professional PDF
This slide caters details about various metrics portraying online video hosting platform progress in terms of rise in subscribers, rise in average revenue per user, and overall revenue. Deliver and pitch your topic in the best possible manner with this virtual video hosting applications investor fundraising elevator various metrics determining professional pdf. Use them to share invaluable insights on average, revenue and impress your audience. This template can be altered and modified as per your expectations. So, grab it now.

Product Sales And Number Of Customers Projections Structure PDF
This slide provides the product sales projection with total number of customers, revenue per customer, projected sales etc. Deliver and pitch your topic in the best possible manner with this product sales and number of customers projections structure pdf. Use them to share invaluable insights on revenue per customers, total current sales, projected products sales, product, revenue per customer, total projected sales and impress your audience. This template can be altered and modified as per your expectations. So, grab it now.

Company Comparison Of Product Financial Performance Summary PDF
This slide shows the company revenue generation comparison of companys product across global market. USA region is the major revenue generation contributor. Showcasing this set of slides titled Company Comparison Of Product Financial Performance Summary PDF. The topics addressed in these templates are Revenue Generated, Region Increased, Substantially. All the content presented in this PPT design is completely editable. Download it and make adjustments in color, background, font etc. as per your unique business setting.

Brief Description About Who We Are Ppt Gallery Influencers PDF
This slide provides information regarding the firms overview in terms of its offerings, revenue generated, office locations, number of employees, founded year, etc. Deliver an awe inspiring pitch with this creative brief description about who we are ppt gallery influencers pdf bundle. Topics like revenue by geographical segment, revenue by product or service category, our offerings can be discussed with this completely editable template. It is available for immediate download depending on the needs and requirements of the user.
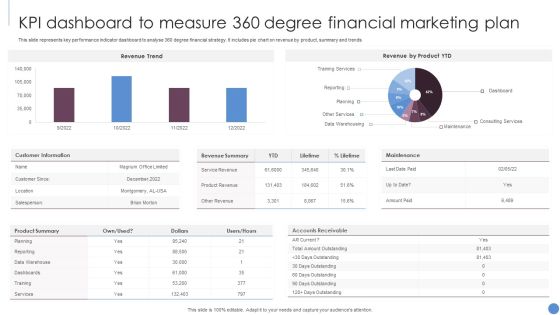
KPI Dashboard To Measure 360 Degree Financial Marketing Plan Slides PDF
This slide represents key performance indicator dashboard to analyse 360 degree financial strategy. It includes pie chart on revenue by product, summary and trends. Showcasing this set of slides titled KPI Dashboard To Measure 360 Degree Financial Marketing Plan Slides PDF. The topics addressed in these templates are Revenue Trend, Revenue Product YTD, Customer Information. All the content presented in this PPT design is completely editable. Download it and make adjustments in color, background, font etc. as per your unique business setting.

Company Income Bridge For Multiple Countries Ppt PowerPoint Presentation Gallery Vector PDF
This slide showcase company revenue bridge for multiple countries. It includes advertising revenue sources for 7 different countries. Showcasing this set of slides titled Company Income Bridge For Multiple Countries Ppt PowerPoint Presentation Gallery Vector PDF. The topics addressed in these templates are Circulation, Ad Revenue. All the content presented in this PPT design is completely editable. Download it and make adjustments in color, background, font etc. as per your unique business setting.

Income Bridge Highlighting Three Year Trends Ppt PowerPoint Presentation File Background Image PDF
This slide showcase revenue bridge. It has major revenue sources like retail, beauty wholesale and licensing. Pitch your topic with ease and precision using this Income Bridge Highlighting Three Year Trends Ppt PowerPoint Presentation File Background Image PDF. This layout presents information on Revenue Growth, Ex Beauty Wholesale. It is also available for immediate download and adjustment. So, changes can be made in the color, design, graphics or any other component to create a unique layout.

Opportunity Analysis Dashboard Indicating Business Performance Information Rules PDF
This slide shows opportunity analysis dashboard indicating market performance which contains opportunity count by size, sales stage, region, revenue and average revenue. Pitch your topic with ease and precision using this Opportunity Analysis Dashboard Indicating Business Performance Information Rules PDF. This layout presents information on Opportunity Count, Revenue, Sales. It is also available for immediate download and adjustment. So, changes can be made in the color, design, graphics or any other component to create a unique layout.

Comparative Analysis To Create A Future Company Performance Management Strategy Slides PDF
The slide shows comparison analysis to develop future company performance management strategy. It also includes performance forecast for the up coming year.Pitch your topic with ease and precision using this Comparative Analysis To Create A Future Company Performance Management Strategy Slides PDF. This layout presents information on Sales Revenue, Recurring Revenue, Revenue Growth. It is also available for immediate download and adjustment. So, changes can be made in the color, design, graphics or any other component to create a unique layout.

Transport Sales Capability Vs Actual Sales Chart Introduction PDF
This slide illustrates expected revenue generation from transport services to evaluate growth. It includes revenue potential, actual sales and expected deviation etc. Showcasing this set of slides titled Transport Sales Capability Vs Actual Sales Chart Introduction PDF. The topics addressed in these templates are Transport Services, Revenue Potential, Actual Sales. All the content presented in this PPT design is completely editable. Download it and make adjustments in color, background, font etc. as per your unique business setting.

Customer Attrition And Retention Analysis Dashboard Background PDF
This slide illustrates facts and figures related to customer retention and churn prediction. It includes customer churn, revenue churn, net revenue, MRR growth etc. Showcasing this set of slides titled Customer Attrition And Retention Analysis Dashboard Background PDF. The topics addressed in these templates are Net Promoter Score, Loyal Customers, Premium Users, Customer Churn, Revenue Churn. All the content presented in this PPT design is completely editable. Download it and make adjustments in color, background, font etc. as per your unique business setting.

Business Analysis Ppt PowerPoint Presentation Professional Templates
This is a business analysis ppt powerpoint presentation professional templates. This is a four stage process. The stages in this process are high, low, market share, revenue growth.

Financial Dashboard For Non Profit Financial Plan Budget Management Elements PDF
The below slide exhibits a financial dashboard for non profit organizations that helps managers to analyze financial performance in an effective way. Key components are revenue ratio by entity, revenue ratio by type, etc.Pitch your topic with ease and precision using this Financial Dashboard For Non Profit Financial Plan Budget Management Elements PDF. This layout presents information on Revenue Actual, Revenue Actual. It is also available for immediate download and adjustment. So, changes can be made in the color, design, graphics or any other component to create a unique layout.

Improve Profitability Powerpoint Slide Designs
This is a improve profitability powerpoint slide designs. This is a three stage process. The stages in this process are improve profitability, increase revenue per carload, decrease losses.
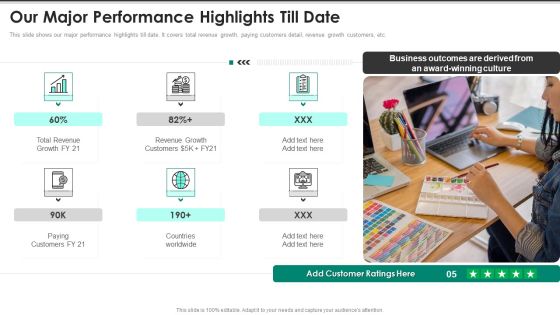
Website Interface And Application Development Firm Our Major Performance Highlights Inspiration PDF
This slide shows our major performance highlights till date. It covers total revenue growth, paying customers detail, revenue growth customers, etc. Presenting Website Interface And Application Development Firm Our Major Performance Highlights Inspiration PDF to provide visual cues and insights. Share and navigate important information on six stages that need your due attention. This template can be used to pitch topics like Total Revenue Growth, Revenue Growth Customers, Paying Customers Countries. In addtion, this PPT design contains high resolution images, graphics, etc, that are easily editable and available for immediate download.

E Commerce Project Campaign Planning And Management Dashboard Structure PDF
The following slide highlights the ecommerce project campaign planning and management dashboard illustrating key headings which includes revenue, onsite behaviour, mobile revenue and average order value, revenue by channel, top performing campaigns, high bounce mobile devices and mobile vs site revenue Showcasing this set of slides titled E Commerce Project Campaign Planning And Management Dashboard Structure PDF. The topics addressed in these templates are E Commerce Project Campaign Planning And Management Dashboard. All the content presented in this PPT design is completely editable. Download it and make adjustments in color, background, font etc. as per your unique business setting.

Online Gaming Fundraising Pitch Deck Various Metrics Determining Video Game Platform Performance Structure PDF
This slide caters details about various metrics portraying video game platform progress in terms of rise in subscribers, rise in average revenue per user, and overall revenue. Deliver an awe inspiring pitch with this creative online gaming fundraising pitch deck various metrics determining video game platform performance structure pdf bundle. Topics like rise in subscribers, rise in average revenue per user, rise in overall revenue can be discussed with this completely editable template. It is available for immediate download depending on the needs and requirements of the user.

Financial Performance Introduction Of Supply Chain Management Organization Infographics PDF
This slide showcases introduction to statistics that can help supply chain management organization to evaluate the financial performance. Its key components are revenue, net income and revenue sources.Pitch your topic with ease and precision using this Financial Performance Introduction Of Supply Chain Management Organization Infographics PDF This layout presents information on Revenue Sources, Revenue Increased, Income Increased It is also available for immediate download and adjustment. So, changes can be made in the color, design, graphics or any other component to create a unique layout.
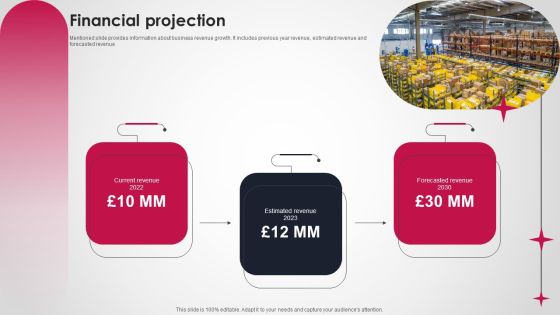
Logistics And Supply Chain Platform Funding Pitch Deck Financial Projection Portrait PDF
Mentioned slide provides information about business revenue growth. It includes previous year revenue, estimated revenue and forecasted revenue Create an editable Logistics And Supply Chain Platform Funding Pitch Deck Financial Projection Portrait PDF that communicates your idea and engages your audience. Whether youre presenting a business or an educational presentation, pre designed presentation templates help save time. Logistics And Supply Chain Platform Funding Pitch Deck Financial Projection Portrait PDF is highly customizable and very easy to edit, covering many different styles from creative to business presentations. Slidegeeks has creative team members who have crafted amazing templates. So, go and get them without any delay.
KPI Dashboard To Track Services Company Strategy Business Marketing Performance Guidelines PDF
Following slide demonstrates dashboard for monitoring services company sales strategy impact on maximizing business profits. It includes elements such as number of sales, revenue, profit, cost, monthly sales revenue, cost breakdown, up and cross sell, revenue collected and sales by communication channel. Showcasing this set of slides titled KPI Dashboard To Track Services Company Strategy Business Marketing Performance Guidelines PDF. The topics addressed in these templates are Revenue, Profit, Cost. All the content presented in this PPT design is completely editable. Download it and make adjustments in color, background, font etc. as per your unique business setting.

Restaurant Promotion Marketing Analysis Dashboard For Hospitality Company Microsoft PDF
This slide shows the dashboard to be used by the hospitality company for analyzing the restaurant marketing. It includes details related to revenue, cost of revenue, net income, food and beverage revenue by location and type etc.Showcasing this set of slides titled Restaurant Promotion Marketing Analysis Dashboard For Hospitality Company Microsoft PDF The topics addressed in these templates are Beverage Revenue, Food Beverage, Expenses Account All the content presented in this PPT design is completely editable. Download it and make adjustments in color, background, font etc. as per your unique business setting.
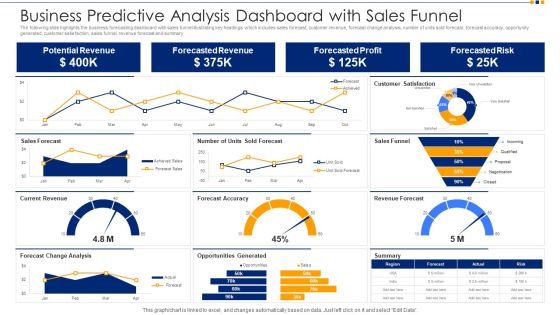
Business Predictive Analysis Dashboard With Sales Funnel Ppt Show Images PDF
The following slide highlights the business forecasting dashboard with sales funnel illustrating key headings which includes sales forecast, customer revenue, forecast change analysis, number of units sold forecast, forecast accuracy, opportunity generated, customer satisfaction, sales funnel, revenue forecast and summary. Pitch your topic with ease and precision using this business predictive analysis dashboard with sales funnel ppt show images pdf. This layout presents information on potential revenue, forecasted revenue, forecasted profit, forecasted risk. It is also available for immediate download and adjustment. So, changes can be made in the color, design, graphics or any other component to create a unique layout.

Business Newsletter Referral Marketing Program Performance KPI Dashboard Formats PDF
This slide represents KPI dashboard designed to track performance of the program conducted to attract new leads at lower cost with the help of existing customers to generate leads that best fit the organization. It includes key metrics such as total revenue generated, monthly recurring revenue, paying customers etc. Showcasing this set of slides titled Business Newsletter Referral Marketing Program Performance KPI Dashboard Formats PDF. The topics addressed in these templates are Dashboard, Paying Customers, Monthly Recurring Revenue, Total Revenue Generated. All the content presented in this PPT design is completely editable. Download it and make adjustments in color, background, font etc. as per your unique business setting.
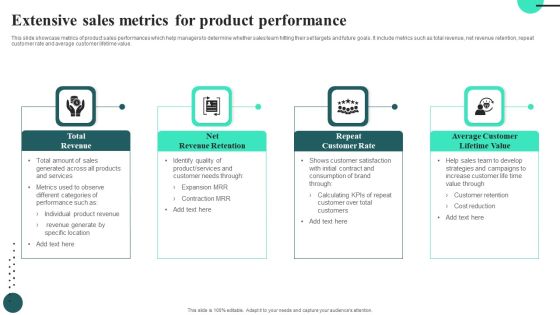
Extensive Sales Metrics For Product Performance Summary PDF
This slide showcase metrics of product sales performances which help managers to determine whether sales team hitting their set targets and future goals. It include metrics such as total revenue, net revenue retention, repeat customer rate and average customer lifetime value.Persuade your audience using this Extensive Sales Metrics For Product Performance Summary PDF. This PPT design covers four stages, thus making it a great tool to use. It also caters to a variety of topics including Total Revenue, Net Revenue Retention. Download this PPT design now to present a convincing pitch that not only emphasizes the topic but also showcases your presentation skills.
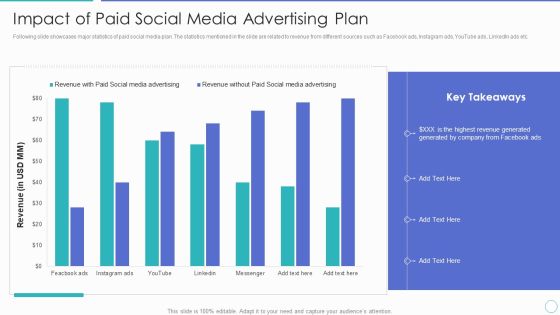
Impact Of Paid Social Media Advertising Plan Ppt PowerPoint Presentation Gallery Template PDF
Following slide showcases major statistics of paid social media plan. The statistics mentioned in the slide are related to revenue from different sources such as Facebook ads, Instagram ads, YouTube ads, LinkedIn ads etc. Pitch your topic with ease and precision using this impact of paid social media advertising plan ppt powerpoint presentation gallery template pdf. This layout presents information on highest revenue generated, revenue with paid social media advertising, revenue without paid social media advertising. It is also available for immediate download and adjustment. So, changes can be made in the color, design, graphics or any other component to create a unique layout.

Sales Data Requirements For Analytics For Business Growth Information PDF
This slide provides information about sales data requirement analysis for business growth which contains different KPIs such as total revenue, revenue by product, percentage of revenue from existing customers and new business. Pitch your topic with ease and precision using this sales data requirements for analytics for business growth information pdf. This layout presents information on customers, revenue, business. It is also available for immediate download and adjustment. So, changes can be made in the color, design, graphics or any other component to create a unique layout.

Automobile Company Actual And Forecasted Monthly Sales Dashboard Ppt Infographic Template Aids PDF
This slide shows the dashboard for forecasting the sales of an automobile company for the current month. It represents details related to revenue by pipeline, new deals, sales forecast, revenue goal attainment by owner for the current month and pipeline coverage by next month. Showcasing this set of slides titled Automobile Company Actual And Forecasted Monthly Sales Dashboard Ppt Infographic Template Aids PDF. The topics addressed in these templates are Forecast Month, Revenue Goal Attainment, Revenue Goal Attainment. All the content presented in this PPT design is completely editable. Download it and make adjustments in color, background, font etc. as per your unique business setting.
Executive Dashboards For Tracking Key Performance Icons PDF
This slide represents the dashboard for the CEO to track the companys performance. It includes key performance indicators such as no. of deals, open deals, revenue, expected revenue and win percentage. Showcasing this set of slides titled Executive Dashboards For Tracking Key Performance Icons PDF. The topics addressed in these templates are Pen Deals, Revenue, Expected Revenue. All the content presented in this PPT design is completely editable. Download it and make adjustments in color, background, font etc. as per your unique business setting.

Dashboard For Tracking Sales Target Metrics Introduction PDF
This slide presents KPI dashboard for tracking Sales Target Metrics achievement monthly and region wise helpful in adjusting activities as per ongoing performance. It includes average weekly sales revenue, average sales target, annual sales growth, regional sales performance and average revenue per unit that should be regularly tracked. Showcasing this set of slides titled Dashboard For Tracking Sales Target Metrics Introduction PDF. The topics addressed in these templates are Average Revenue, Per Unit, Average Weekly, Sales Revenue. All the content presented in this PPT design is completely editable. Download it and make adjustments in color, background, font etc. as per your unique business setting.
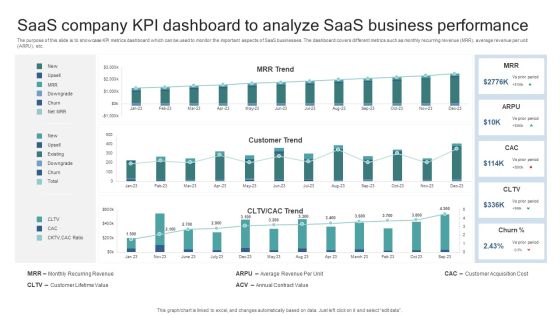
Saas Company KPI Dashboard To Analyze Saas Business Performance Elements PDF
The purpose of this slide is to showcase KPI metrics dashboard which can be used to monitor the important aspects of SaaS businesses. The dashboard covers different metrics such as monthly recurring revenue MRR, average revenue per unit ARPU, etc. Pitch your topic with ease and precision using this Saas Company KPI Dashboard To Analyze Saas Business Performance Elements PDF. This layout presents information on Monthly Recurring Revenue, Customer Lifetime Value, Average Revenue Per Unit, Annual Contract Value, Customer Acquisition Cost. It is also available for immediate download and adjustment. So, changes can be made in the color, design, graphics or any other component to create a unique layout.
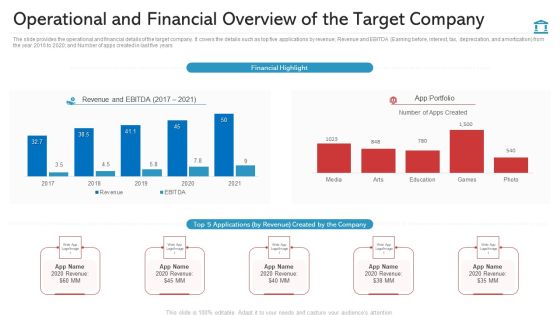
Operational And Financial Overview Of The Target Company Structure PDF
Deliver and pitch your topic in the best possible manner with thisoperational and financial overview of the target company structure pdf. Use them to share invaluable insights on financial highlight, revenue and ebitda 2017 to 2021, revenue and impress your audience. This template can be altered and modified as per your expectations. So, grab it now.

Dashboard Related To Application Programming Interface Status Slides PDF
This slide shows the API Application Program Interface dashboard which includes Results, Log activity user, Revenue etc. Deliver an awe-inspiring pitch with this creative dashboard related to application programming interface status slides pdf bundle. Topics like revenue, location, status, endpoint, time can be discussed with this completely editable template. It is available for immediate download depending on the needs and requirements of the user.

Corporate Governance Financial Summary Formats PDF
Presenting corporate governance financial summary formats pdf to provide visual cues and insights. Share and navigate important information on five stages that need your due attention. This template can be used to pitch topics like revenue growth, net revenue, net profit, net profit margin. In addtion, this PPT design contains high resolution images, graphics, etc, that are easily editable and available for immediate download.
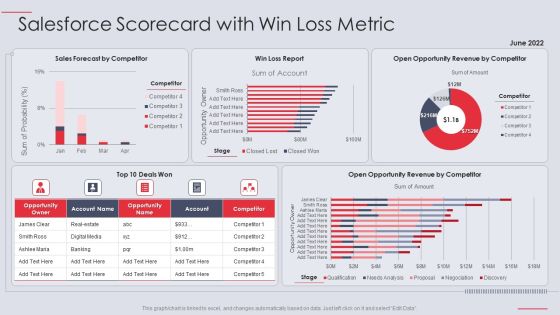
Salesforce Scorecard With Win Loss Metric Ppt PowerPoint Presentation Show Portfolio PDF
Deliver an awe inspiring pitch with this creative Salesforce Scorecard With Win Loss Metric Ppt PowerPoint Presentation Show Portfolio PDF bundle. Topics like Sales Forecast, Opportunity Revenue, Revenue Competitor can be discussed with this completely editable template. It is available for immediate download depending on the needs and requirements of the user.

Corporate Governance Post It Notes Designs PDF
Deliver an awe inspiring pitch with this creative corporate governance post it notes designs pdf bundle. Topics like forecasted revenue, cost of goods sold, annual revenue per product can be discussed with this completely editable template. It is available for immediate download depending on the needs and requirements of the user.
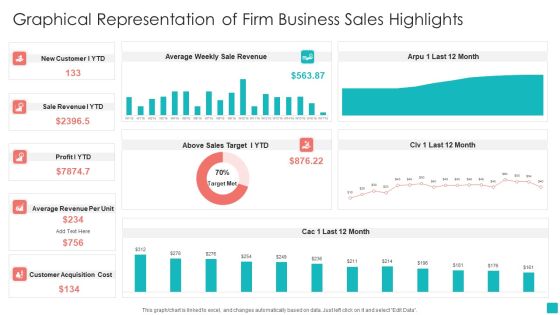
Graphical Representation Of Firm Business Sales Highlights Pictures PDF
Showcasing this set of slides titled Graphical Representation Of Firm Business Sales Highlights Pictures PDF. The topics addressed in these templates are Average Revenue Per Unit, Customer Acquisition Cost, Sale Revenue. All the content presented in this PPT design is completely editable. Download it and make adjustments in color, background, font etc. as per your unique business setting.

5 Step Integrated Sales Planning Structure Demonstration PDF
This slide provides relevant information about five step integrated sales planning model which can assist managers in strategic decision-making. It includes steps such as sales revenue planning, demand planning, supply planning, profit based demand balancing and management review. Persuade your audience using this 5 Step Integrated Sales Planning Structure Demonstration PDF. This PPT design covers Five stages, thus making it a great tool to use. It also caters to a variety of topics including Sales Revenue Planning, Management Review, Demand Planning. Download this PPT design now to present a convincing pitch that not only emphasizes the topic but also showcases your presentation skills.

Business Plan For Entry To Market Ppt PowerPoint Presentation Gallery Backgrounds PDF
The following slide outlines a comprehensive business model which can be used for new market entry. It provides detailed information about management overview, types of revenue streams, target market, customer challenges, solution offered, etc. Showcasing this set of slides titled business plan for entry to market ppt powerpoint presentation gallery backgrounds pdf. The topics addressed in these templates are management overview, revenue streams, our pricing, our value, marketing channels, growth opportunity. All the content presented in this PPT design is completely editable. Download it and make adjustments in color, background, font etc. as per your unique business setting.
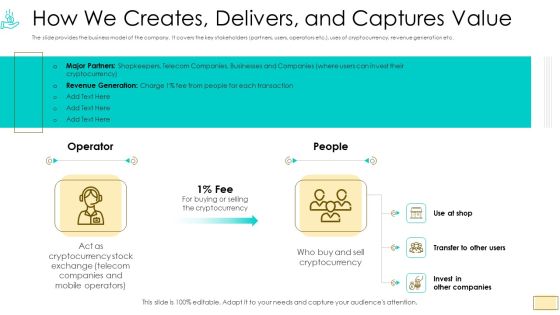
Investor Pitch Ppt For Crypto Funding How We Creates Delivers And Captures Value Microsoft PDF
The slide provides the business model of the company. It covers the key stakeholders partners, users, operators etc., uses of cryptocurrency, revenue generation etc. Presenting investor pitch ppt for crypto funding how we creates delivers and captures value microsoft pdf. to provide visual cues and insights. Share and navigate important information on three stages that need your due attention. This template can be used to pitch topics like companies and mobile operators, revenue generation, shopkeepers, telecom companies, businesses and companies. In addtion, this PPT design contains high resolution images, graphics, etc, that are easily editable and available for immediate download.

Investor Pitch Ppt Raise Finances Crypto Initial Public Offering How We Createsdeliversand Captures Value Demonstration PDF
The slide provides the business model of the company. It covers the key stakeholders partners, users, operators etc.,uses of cryptocurrency, revenue generation etc. Presenting investor pitch ppt raise finances crypto initial public offering how we createsdeliversand captures value demon. to provide visual cues and insights. Share and navigate important information on three stages that need your due attention. This template can be used to pitch topics like revenue generation, shopkeepers, telecom companies, businesses and companies. In addtion, this PPT design contains high resolution images, graphics, etc, that are easily editable and available for immediate download.

Actual Vs Budgeted Earning Breakup Dashboard Inspiration PDF
This style showcases revenue breakdown dashboard that can help organization to compare the actual vs budgeted amount and calculate the variance in target achievements. Its key components are product revenue, services revenue and total revenues. Showcasing this set of slides titled Actual Vs Budgeted Earning Breakup Dashboard Inspiration PDF. The topics addressed in these templates are Actual Vs Budgeted, Earning Breakup Dashboard. All the content presented in this PPT design is completely editable. Download it and make adjustments in color, background, font etc. as per your unique business setting.

10 Slides To An Awesome Pitch Ppt PowerPoint Presentation Layout
This is a 10 slides to an awesome pitch ppt powerpoint presentation layout. This is a ten stage process. The stages in this process are business model, money, market size, the solution, team, marketing plan, competition, elevator pitch, proprietary tech, the problem.
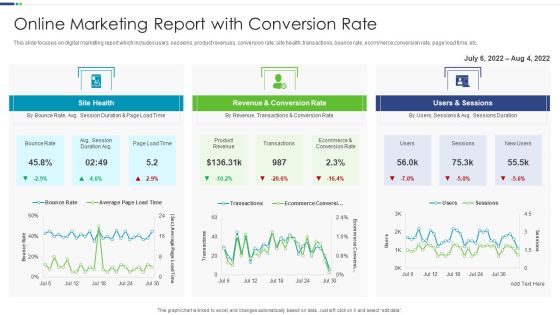
Online Marketing Report With Conversion Rate Brochure PDF
This slide focuses on digital marketing report which includes users, sessions, product revenues, conversion rate, site health, transactions, bounce rate, ecommerce conversion rate, page load time, etc. Showcasing this set of slides titled Online Marketing Report With Conversion Rate Brochure PDF The topics addressed in these templates are Revenue Conversion, Revenue Transactions, Sessions Duration All the content presented in this PPT design is completely editable. Download it and make adjustments in color, background, font etc. as per your unique business setting.

Industry Analysis Business PowerPoint Presentation
Analyze Ailments On Our Industry Analysis Business Powerpoint Presentation Powerpoint Templates. Bring Out The Thinking Doctor In You. Dock Your Thoughts With Our Business Powerpoint Templates. They Will Launch Them Into Orbit.
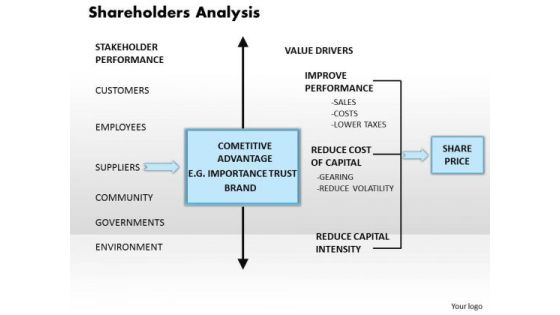
Shareholders Analysis Business PowerPoint Presentation
Our Shareholders Analysis Business Powerpoint Presentation Powerpoint Templates Team Are A Dogged Lot. They Keep At It Till They Get It Right. Dole It Out With Our arrows Powerpoint Templates. Your Thoughts Will Get The Right Proportions.

Area Chart Ppt PowerPoint Presentation Pictures Rules
This is a area chart ppt powerpoint presentation pictures rules. This is a two stage process. The stages in this process are area chart, business, marketing, strategy, success.

Bar Chart Ppt PowerPoint Presentation Infographics Designs Download
This is a bar chart ppt powerpoint presentation infographics designs download. This is a twelve stage process. The stages in this process are bar chart, business, marketing, strategy, success.
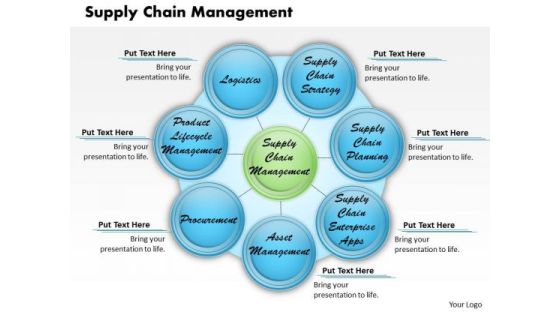
Supply Chain Management Business PowerPoint Presentation
Our Supply Chain Management Business Powerpoint Presentation Powerpoint Templates Abhor Doodling. They Never Let The Interest Flag. Our business Powerpoint Templates Make Good Beasts Of Burden. Place All Your Demands On Them.

The Generic Value Chain Business PowerPoint Presentation
Connect The Dots With Our The Generic Value Chain Business Powerpoint Presentation Powerpoint Templates. Watch The Whole Picture Clearly Emerge. Dot Your Thoughts With Our arrows Powerpoint Templates. Give Your Demeanor That Propel Look.

Crm Rep Dashboard Ppt PowerPoint Presentation Styles Objects
This is a crm rep dashboard ppt powerpoint presentation styles objects. This is a three stage process. The stages in this process are negotiation, proposal, develop, qualification, identity.
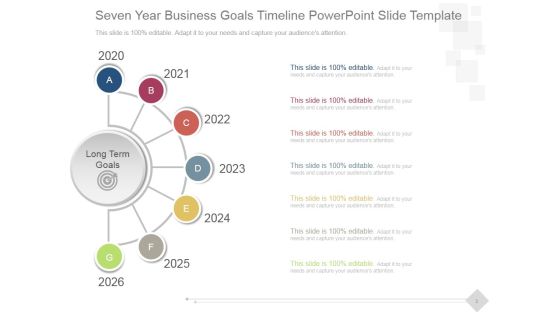
Seven Year Business Goals Timeline Ppt PowerPoint Presentation Template
This is a seven year business goals timeline ppt powerpoint presentation template. This is a seven stage process. The stages in this process are long term goals, time planning, business, marketing, success.

Continuous Improvement PowerPoint Presentation Template
Knock On The Door To Success With Our Continuous Improvement PowerPoint Presentation Template Powerpoint Templates. Be Assured Of Gaining Entry. Give Them A Dose Of Your Ability. It Will Go Down Well With Our Business Strategy Powerpoint Templates.

Data Processing Facts Management Arrows Diagram Ppt PowerPoint Presentation Templates
This is a data processing facts management arrows diagram ppt powerpoint presentation templates. This is a eight stage process. The stages in this process are marketing, arrows, management, facts, data processing.

Competitive Analysis Swot Analysis Ppt PowerPoint Presentation Graphics
This is a competitive analysis swot analysis ppt powerpoint presentation graphics. This is a four stage process. The stages in this process are strengths, threats, weaknesses, opportunities.
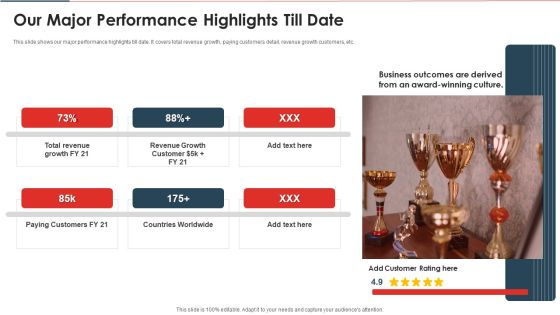
Website And Mobile Application Development Business Our Major Performance Highlights Till Date Designs PDF
This slide shows our major performance highlights till date. It covers total revenue growth, paying customers detail, revenue growth customers, etc. Presenting website and mobile application development business our major performance highlights till date designs pdf to provide visual cues and insights. Share and navigate important information on six stages that need your due attention. This template can be used to pitch topics like revenue, growth, customer. In addtion, this PPT design contains high resolution images, graphics, etc, that are easily editable and available for immediate download.

Budgetary Comparison Of Social Media Brand Recommendation Strategies Mockup PDF
Following slide demonstrates brand endorsement budgetary comparison matrix for determining platform with maximum revenue growth. It includes platform such as Instagram, twitter, LinkedIn, snapchat and Facebook. Showcasing this set of slides titled Budgetary Comparison Of Social Media Brand Recommendation Strategies Mockup PDF. The topics addressed in these templates are Platforms, Strategy, Implementation Cost, Expected Revenue, Actual Revenue, Variance. All the content presented in this PPT design is completely editable. Download it and make adjustments in color, background, font etc. as per your unique business setting.

Income Statement Showing Financial Forecast And Essential Metrics Structure PDF
This slide displays the income statement of an organization with the projections of next year revenue and net income. It shows that there will more revenue as compared to the previous years and hence it will generate more income. Presenting Income Statement Showing Financial Forecast And Essential Metrics Structure PDF to dispense important information. This template comprises two stages. It also presents valuable insights into the topics including Revenue, Operating Expenses, Operating Income. This is a completely customizable PowerPoint theme that can be put to use immediately. So, download it and address the topic impactfully.
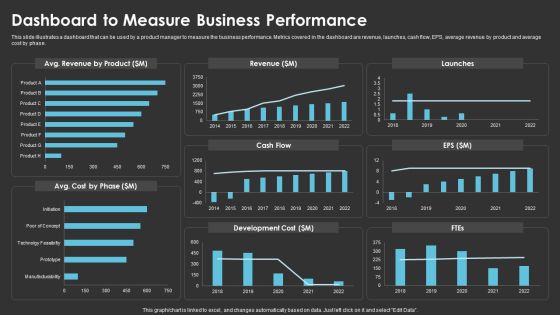
Method To Introduce New Product Offerings In The Industry Dashboard To Measure Business Performance Pictures PDF
This slide illustrates a dashboard that can be used by a product manager to measure the business performance. Metrics covered in the dashboard are revenue, launches, cash flow, EPS, average revenue by product and average cost by phase. Deliver and pitch your topic in the best possible manner with this Method To Introduce New Product Offerings In The Industry Dashboard To Measure Business Performance Pictures PDF. Use them to share invaluable insights on Revenue, Cash Flow, Development Cost and impress your audience. This template can be altered and modified as per your expectations. So, grab it now.

Financial Banking PPT Operational And Financial Overview Of The Target Company Pictures PDF
The slide provides the operational and financial details of the target company. It covers the details such as top five applications by revenue, Revenue and EBITDA Earning before, interest, tax, depreciation, and amortization from the year 2017 to 2021, and Number of apps created in last five years. Deliver and pitch your topic in the best possible manner with this financial banking ppt operational and financial overview of the target company pictures pdf. Use them to share invaluable insights on portfolio, revenue, operational and financial details and impress your audience. This template can be altered and modified as per your expectations. So, grab it now.

Competitors Global Market Share And Earnings Comparative Analysis Report Slides PDF
This slide covers comparison matrix of company and competitors market share and revenue. It also includes pie chart depicting the total global revenue market share. Showcasing this set of slides titled Competitors Global Market Share And Earnings Comparative Analysis Report Slides PDF. The topics addressed in these templates are Revenue, Global Market Share, Earnings Comparative Analysis Report. All the content presented in this PPT design is completely editable. Download it and make adjustments in color, background, font etc. as per your unique business setting.
Web Designing Icon Investor Funding Elevator Pitch Deck Financial Projection Clipart PDF
Following slide showcases anticipated business revenue growth for next 4 years. It includes revenue in USD and annual forecasted revenue. This modern and well arranged Web Designing Icon Investor Funding Elevator Pitch Deck Financial Projection Clipart PDF provides lots of creative possibilities. It is very simple to customize and edit with the Powerpoint Software. Just drag and drop your pictures into the shapes. All facets of this template can be edited with Powerpoint no extra software is necessary. Add your own material, put your images in the places assigned for them, adjust the colors, and then you can show your slides to the world, with an animated slide included.

Commercial Banking Template Collection Operational And Financial Overview Of The Target Company Inspiration PDF
The slide provides the operational and financial details of the target company. It covers the details such as top five applications by revenue Revenue and EBITDA Earning before, interest, tax, depreciation, and amortization from the year 2016 to 2020 and Number of apps created in last five years. Deliver an awe-inspiring pitch with this creative commercial banking template collection operational and financial overview of the target company inspiration pdf bundle. Topics like financial highlight, revenue and ebitda, app portfolio can be discussed with this completely editable template. It is available for immediate download depending on the needs and requirements of the user.
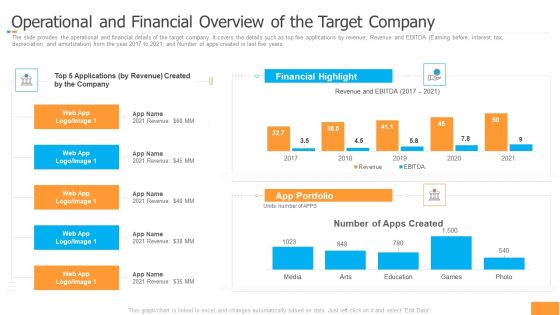
Funding Pitch Book Outline Operational And Financial Overview Of The Target Company Portrait PDF
The slide provides the operational and financial details of the target company. It covers the details such as top five applications by revenue Revenue and EBITDA Earning before, interest, tax, depreciation, and amortization from the year 2016 to 2020 and Number of apps created in last five years. Deliver an awe inspiring pitch with this creative funding pitch book outline operational and financial overview of the target company portrait pdf bundle. Topics like portfolio, financial, revenue can be discussed with this completely editable template. It is available for immediate download depending on the needs and requirements of the user.

AI Investor Financing Pitch Deck Traction Market Sizing AI Ppt Styles Portfolio PDF
This template covers the product market fit in market research. Market pull into additional verticals. This is a ai investor financing pitch deck traction market sizing ai ppt styles portfolio pdf template with various stages. Focus and dispense information on three stages using this creative set, that comes with editable features. It contains large content boxes to add your information on topics like revenue market research, revenue human resources, revenue media and entertainment. You can also showcase facts, figures, and other relevant content using this PPT layout. Grab it now.

Marketing Agency Company Outline Key Statistics Structure PDF
The following slide highlights the financial statistics for the year 2021. The stats show the change in global data and insights revenue, total revenue, EBITDA, SaaS platform revenue and operating net cash flow. The Marketing Agency Company Outline Key Statistics Structure PDF is a compilation of the most recent design trends as a series of slides. It is suitable for any subject or industry presentation, containing attractive visuals and photo spots for businesses to clearly express their messages. This template contains a variety of slides for the user to input data, such as structures to contrast two elements, bullet points, and slides for written information. Slidegeeks is prepared to create an impression.

Key Metrics In Software Sales Strategy Pictures PDF
This slide presents key metrics to be tracked in software sales plan, that helps organisations to keep track of growth and profits generated over time. It includes monthly recurring revenue, average revenue per user, customer lifetime value and lead velocity rate Presenting Key Metrics In Software Sales Strategy Pictures PDF to dispense important information. This template comprises four stages. It also presents valuable insights into the topics including Monthly Recurring Revenue, Customer Lifetime Value, Lead Velocity Rate. This is a completely customizable PowerPoint theme that can be put to use immediately. So, download it and address the topic impactfully.
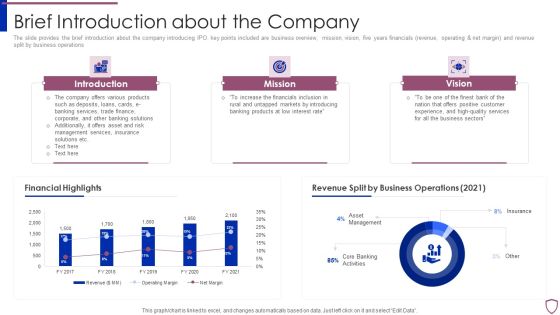
Financing Catalogue For Security Underwriting Agreement Brief Introduction About The Company Structure PDF
The slide provides the brief introduction about the company introducing IPO. key points included are business overview, mission, vision, five years financials revenue, operating and net margin and revenue split by business operations. Deliver an awe inspiring pitch with this creative financing catalogue for security underwriting agreement brief introduction about the company structure pdf bundle. Topics like introduction, mission, vision, financial highlights, revenue split by business operations can be discussed with this completely editable template. It is available for immediate download depending on the needs and requirements of the user.

Dashboard To Track Referral Marketing Recommendation Program Results Structure PDF
The following slide showcases KPI dashboard which can be used by marketers to track and analyze referral program results. The template provides information about revenue generated, paying customers, promotors, clicks, cancelled customers etc. Showcasing this set of slides titled Dashboard To Track Referral Marketing Recommendation Program Results Structure PDF. The topics addressed in these templates are Revenue Generated, Recurring Revenue, Paying Customers. All the content presented in this PPT design is completely editable. Download it and make adjustments in color, background, font etc. as per your unique business setting.

Beauty Care Product Sales Comparison With Units Sold Ppt Outline Graphics PDF
This slide shows matrix which can be used by organizations to compare sales performance of various products. It includes cost of revenue, units sold, revenue and profit. Showcasing this set of slides titled Beauty Care Product Sales Comparison With Units Sold Ppt Outline Graphics PDF. The topics addressed in these templates are Cosmetic Category, Cost Of Revenue, Units Sold. All the content presented in this PPT design is completely editable. Download it and make adjustments in color, background, font etc. as per your unique business setting.

Analyzing Financial Performance For FY 2020 Template 24 One Pager Documents
This one pager covers details regarding the analysis of financial performance for fiscal year 2020 in terms of revenue, operating income, R AND D expenses, revenue generated by business segment, revenue generated by product categories etc. Presenting you an exemplary Analyzing Financial Performance For FY 2020 Template 24 One Pager Documents. Our one-pager comprises all the must-have essentials of an inclusive document. You can edit it with ease, as its layout is completely editable. With such freedom, you can tweak its design and other elements to your requirements. Download this Analyzing Financial Performance For FY 2020 Template 24 One Pager Documents brilliant piece now.

Analyzing Financial Performance For FY 2022 Template 185 One Pager Documents
This one pager covers details regarding the analysis of financial performance for fiscal year 2022 in terms of revenue, net income, revenue generated by business segment, revenue generated by region etc. Presenting you an exemplary Analyzing Financial Performance For FY 2022 Template 185 One Pager Documents. Our one-pager comprises all the must-have essentials of an inclusive document. You can edit it with ease, as its layout is completely editable. With such freedom, you can tweak its design and other elements to your requirements. Download this Analyzing Financial Performance For FY 2022 Template 185 One Pager Documents brilliant piece now.

Analyzing Financial Performance For FY 2022 Template 229 One Pager Documents
This one pager covers details regarding the analysis of financial performance for fiscal year 2022 in terms of revenue, operating income, R AND D expenses, revenue generated by business segment, revenue generated by product categories etc. Presenting you an exemplary Analyzing Financial Performance For FY 2022 Template 229 One Pager Documents. Our one-pager comprises all the must-have essentials of an inclusive document. You can edit it with ease, as its layout is completely editable. With such freedom, you can tweak its design and other elements to your requirements. Download this Analyzing Financial Performance For FY 2022 Template 229 One Pager Documents brilliant piece now.

Analyzing Financial Performance For FY 2022 Template 247 One Pager Documents
This one pager covers details regarding the analysis of financial performance for fiscal year 2022 in terms of revenue, net profit, revenue generated by business segment, revenue generated by region etc. Presenting you an exemplary Analyzing Financial Performance For FY 2022 Template 247 One Pager Documents. Our one-pager comprises all the must-have essentials of an inclusive document. You can edit it with ease, as its layout is completely editable. With such freedom, you can tweak its design and other elements to your requirements. Download this Analyzing Financial Performance For FY 2022 Template 247 One Pager Documents brilliant piece now.
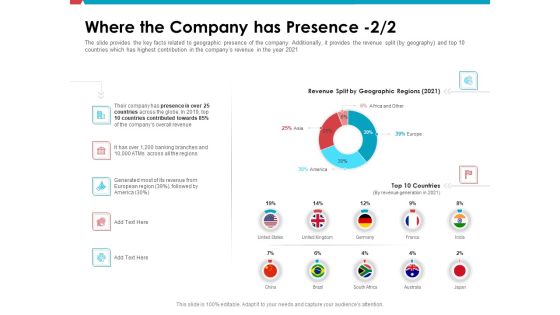
Investor Pitch Deck Public Offering Market Where The Company Has Presence Regions Structure PDF
The slide provides the key facts related to geographic presence of the company. Additionally, it provides the revenue split by geography and top 10 countries which has highest contribution in the companys revenue in the year 2021. Deliver an awe-inspiring pitch with this creative investor pitch deck public offering market where the company has presence regions structure pdf bundle. Topics like revenue split by geographic regions 2021, top 10 countries can be discussed with this completely editable template. It is available for immediate download depending on the needs and requirements of the user.
Monthly Sales Performance Tracking And Monitoring Dashboard Designs PDF
This slide showcases a dashboard presenting various metrics to measure and analyze sales performance for revenue growth. It includes key components such as number of sales, revenue, profit, cost, sales revenue, sales increment, cost analysis and cross sell. Make sure to capture your audiences attention in your business displays with our gratis customizable Monthly Sales Performance Tracking And Monitoring Dashboard Designs PDF. These are great for business strategies, office conferences, capital raising or task suggestions. If you desire to acquire more customers for your tech business and ensure they stay satisfied, create your own sales presentation with these plain slides.
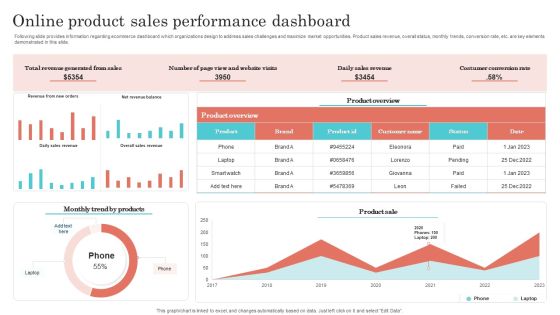
Online Product Sales Performance Dashboard Designs PDF
Following slide provides information regarding ecommerce dashboard which organizations design to address sales challenges and maximize market opportunities. Product sales revenue, overall status, monthly trends, conversion rate, etc. are key elements demonstrated in this slide. Showcasing this set of slides titled Online Product Sales Performance Dashboard Designs PDF. The topics addressed in these templates are Revenue Generated From Sales, Daily Sales Revenue, Costumer Conversion Rate. All the content presented in this PPT design is completely editable. Download it and make adjustments in color, background, font etc. as per your unique business setting.

Corporate Sales Capability And Financial Forecast Dashboard Download PDF
This slide illustrates facts and figures related to expected revenue generation in upcoming months in a corporation. It includes expected sales revenue for FY23, yearly sales revenue etc. Showcasing this set of slides titled Corporate Sales Capability And Financial Forecast Dashboard Download PDF. The topics addressed in these templates are Corporate Sales, Capability And Financial, Forecast Dashboard. All the content presented in this PPT design is completely editable. Download it and make adjustments in color, background, font etc. as per your unique business setting

Unit Market And Earnings Share From Brand Product Sales Clipart PDF
This slide covers market share and revenue earned from multi brands. It also includes number of sales along with percentage of revenue market share. Pitch your topic with ease and precision using this Unit Market And Earnings Share From Brand Product Sales Clipart PDF. This layout presents information on Unit Sales, Unit Market Share, Sales Revenue. It is also available for immediate download and adjustment. So, changes can be made in the color, design, graphics or any other component to create a unique layout.

Early Stage Funding Break Even Point Analysis Ppt Infographic Template Graphics Design PDF
The slide shows the break-even point of the company. It provides the company s revenue and cost at different unit of products. Presenting early stage funding break even point analysis ppt infographic template graphics design pdf. to provide visual cues and insights. Share and navigate important information on one stages that need your due attention. This template can be used to pitch topics like sales revenue, break even point bep, profit, variable costs, revenue. In addtion, this PPT design contains high resolution images, graphics, etc, that are easily editable and available for immediate download.

Business Executive Summary KPI Dashboard For Year 2023 Graphics PDF
The following slide highlights the overall business performance for the financial year 2021 to assess variations and trace accuracy. It includes KPIs such as total income, expenditures, revenue and expense breakdown, fund structure etc. Pitch your topic with ease and precision using this Business Executive Summary KPI Dashboard For Year 2023 Graphics PDF. This layout presents information on Revenue Breakdown, Revenue Category, Expense Breakdown. It is also available for immediate download and adjustment. So, changes can be made in the color, design, graphics or any other component to create a unique layout.
Designing And Deployment CRM Implementation Dashboard With Sales Pipeline Icons PDF
The following slide showcases the CRM dashboard which includes leads, deals, sales revenue, revenue by products, total leads by source, total leads by status and lead distribution. Deliver and pitch your topic in the best possible manner with this designing and deployment crm implementation dashboard with sales pipeline icons pdf. Use them to share invaluable insights on crm, lead distribution, sales revenue, total leads by source, deals, sales pipeline by stage and impress your audience. This template can be altered and modified as per your expectations. So, grab it now.

Clinical Services Company Profile Executive Summary Ideas PDF
The slide describes brief company details which depict company outline, key statistics and financial overview. The major facts covered are number of regulatory approvals, employee count, global market share, revenue CAGR, market capitalization and total revenue. Presenting Clinical Services Company Profile Executive Summary Ideas PDF to provide visual cues and insights. Share and navigate important information on one stages that need your due attention. This template can be used to pitch topics like Gross Profit, Revenue, Global Market. In addtion, this PPT design contains high resolution images, graphics, etc, that are easily editable and available for immediate download.

CSR Activities Company Reputation Management Brief Description About Who We Are Ppt Infographic Template Good PDF
This slide provides information regarding the firms overview in terms of its offerings, revenue generated, office locations, number of employees, founded year, etc. Deliver and pitch your topic in the best possible manner with this csr activities company reputation management brief description about who we are ppt infographic template good pdf. Use them to share invaluable insights on revenue by geographical segment, revenue by product or service category, office locations, employees and impress your audience. This template can be altered and modified as per your expectations. So, grab it now.
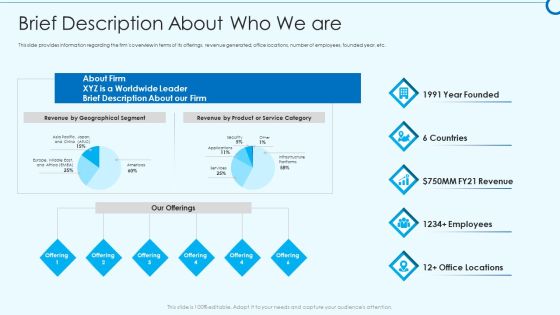
Developing Viable Working Surrounding Brief Description About Who We Are Summary PDF
This slide provides information regarding the firms overview in terms of its offerings, revenue generated, office locations, number of employees, founded year, etc. Deliver and pitch your topic in the best possible manner with this developing viable working surrounding brief description about who we are summary pdf. Use them to share invaluable insights on revenue by geographical segment, infrastructure platforms, revenue by product or service category and impress your audience. This template can be altered and modified as per your expectations. So, grab it now.

Fiverr Capital Fundraising Fiverr At A Glance Ppt Infographics Slideshow PDF
This slide provides information in brief about some of the statistics of Fiverr such as revenue, number of buyers and sellers, revenue growth rate, geographical presence, number of categories etc. Presenting Fiverr Capital Fundraising Fiverr At A Glance Ppt Infographics Slideshow PDF to provide visual cues and insights. Share and navigate important information on eight stages that need your due attention. This template can be used to pitch topics like Buyers Since Inception, Sellers Since Inception, Revenue Existing Cohort. In addtion, this PPT design contains high resolution images, graphics, etc, that are easily editable and available for immediate download.

Retail Weekly Sales Performance Report Dashboard To Measure Performance Ppt Gallery File Formats PDF
The following slide exhibits dashboard for small-scale retailers and product sales for chosen time period. It presents information related to revenue breakdown, total income, etc. Showcasing this set of slides titled Retail Weekly Sales Performance Report Dashboard To Measure Performance Ppt Gallery File Formats PDF. The topics addressed in these templates are Revenue Breakdown, Total Income, Total Revenue. All the content presented in this PPT design is completely editable. Download it and make adjustments in color, background, font etc. as per your unique business setting.
Weekly E Mail Performance Report Icon Ppt Inspiration Example File PDF
This slide displays the overall revenue that has been earned by an organization during a weekly performance report with the gross margin percent, total revenue , no. Of customers, etc. Showcasing this set of slides titled Weekly E Mail Performance Report Icon Ppt Inspiration Example File PDF. The topics addressed in these templates are Gross Margin, Total Revenue, Customers. All the content presented in this PPT design is completely editable. Download it and make adjustments in color, background, font etc. as per your unique business setting.
Monthly Services Business Marketing Strategy Implementation Timeline Professional PDF
Following slide demonstrates dashboard for monitoring services company sales strategy impact on maximizing business profits. It includes elements such as number of sales, revenue, profit, cost, monthly sales revenue, cost breakdown, up and cross sell, revenue collected and sales by communication channel. Showcasing this set of slides titled Monthly Services Business Marketing Strategy Implementation Timeline Professional PDF. The topics addressed in these templates are Strategy, Lead Generation, Customer Retention. All the content presented in this PPT design is completely editable. Download it and make adjustments in color, background, font etc. as per your unique business setting.
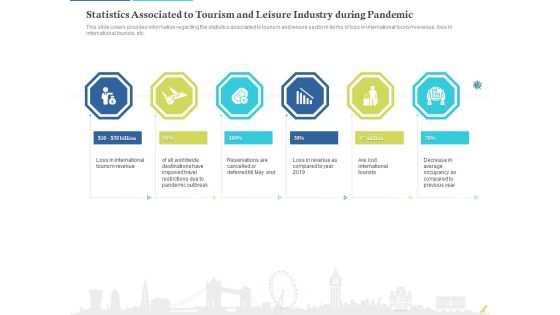
Rebuilding Travel Industry After COVID 19 Statistics Associated To Tourism And Leisure Industry During Pandemic Summary PDF
This slide covers provides information regarding the statistics associated to tourism and leisure sector in terms of loss in international tourism revenue, loss in international tourists, etc. Presenting rebuilding travel industry after COVID 19 statistics associated to tourism and leisure industry during pandemic summary pdf. to provide visual cues and insights. Share and navigate important information on six stages that need your due attention. This template can be used to pitch topics like loss in international tourism revenue, loss in revenue as compared to ye, are lost international tourists. In addtion, this PPT design contains high resolution images, graphics, etc, that are easily editable and available for immediate download.

Monthly Retail Sales Report Forecast For Company Introduction PDF
The following slide highlights the monthly retail sales forecast for company illustrating key headings which includes key headings customers, estimated footfall, footfall entering store, total customer, sales, total number of sales, revenue and average sale revenue. Pitch your topic with ease and precision using this Monthly Retail Sales Report Forecast For Company Introduction PDF. This layout presents information on Customers, Sales, Revenue. It is also available for immediate download and adjustment. So, changes can be made in the color, design, graphics or any other component to create a unique layout.
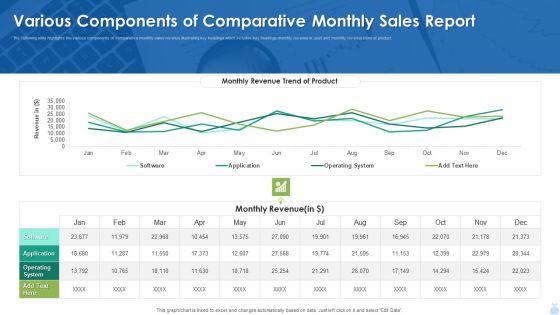
Various Components Of Comparative Monthly Sales Report Inspiration PDF
The following slide highlights the various components of comparative monthly sales revenue illustrating key headings which includes key headings monthly revenue in used and monthly revenue trend of product. Showcasing this set of slides titled Various Components Of Comparative Monthly Sales Report Inspiration PDF. The topics addressed in these templates are Various Components Of Comparative Monthly Sales Report Inspiration PDF. All the content presented in this PPT design is completely editable. Download it and make adjustments in color, background, font etc. as per your unique business setting.
Marketing And Operations Dashboard For Performance Management Icons PDF
This slide covers sales and operation dashboard for performance management. It involves details such as number of new buyers, sales revenue, average revenue per unit etc. Pitch your topic with ease and precision using this Marketing And Operations Dashboard For Performance Management Icons PDF. This layout presents information on Average Revenue Per Unit, Customer Acquisition Cost, Customer Lifetime Value. It is also available for immediate download and adjustment. So, changes can be made in the color, design, graphics or any other component to create a unique layout.
Stock Requirement Plan With Delivery Performance Ppt PowerPoint Presentation Icon Deck PDF
The following slide highlights the material requirement planning with delivery performance illustrating top clients by revenue details, top clients by revenue, delivery performance and shipments. Pitch your topic with ease and precision using this Stock Requirement Plan With Delivery Performance Ppt PowerPoint Presentation Icon Deck PDF. This layout presents information on Delivery Performance, Shipments, Top Clients Revenue. It is also available for immediate download and adjustment. So, changes can be made in the color, design, graphics or any other component to create a unique layout.

Fashion Marketing And Advertisement Analysis Dashboard Ppt PowerPoint Presentation Gallery Topics PDF
This slide defines the dashboard for fashion marketing and Advertisement revenue analysis . It includes information related to the revenue, sales, brands and gender breakdown. Pitch your topic with ease and precision using this Fashion Marketing And Advertisement Analysis Dashboard Ppt PowerPoint Presentation Gallery Topics PDF. This layout presents information on Total Revenue, Total Brands, Total Sales. It is also available for immediate download and adjustment. So, changes can be made in the color, design, graphics or any other component to create a unique layout.

Business Performance Review Dashboard With Customer Acquisition Cost Diagrams PDF
The following slide highlights KPI dashboard which can be used for quarterly business review QBR. It provides detailed information about actual revenue vs target, number of new customers, average revenue per customer, customer acquisition cost CAC etc. Pitch your topic with ease and precision using this Business Performance Review Dashboard With Customer Acquisition Cost Diagrams PDF. This layout presents information on Revenue, Customer Acquisition Cost, Current Quarter. It is also available for immediate download and adjustment. So, changes can be made in the color, design, graphics or any other component to create a unique layout.
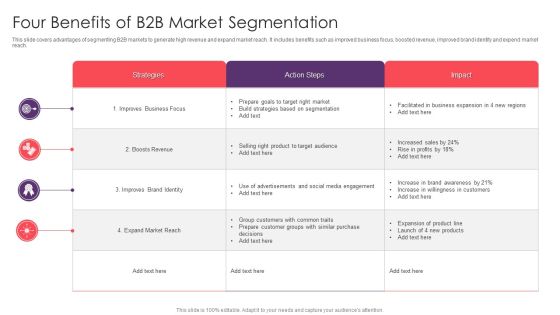
Four Benefits Of B2B Market Segmentation Introduction PDF
This slide covers advantages of segmenting B2B markets to generate high revenue and expand market reach. It includes benefits such as improved business focus, boosted revenue, improved brand identity and expend market reach. Showcasing this set of slides titled Four Benefits Of B2B Market Segmentation Introduction PDF. The topics addressed in these templates are Strategies, Boosts Revenue, Expand Market Reach. All the content presented in this PPT design is completely editable. Download it and make adjustments in color, background, font etc. as per your unique business setting.

Prospective Buyer Retention Dashboard With Key Performance Indicators Themes PDF
This slide shows the dashboard representing the key performance metrics for retention of potential customers of the organization. It shows no. of active users, churn rate, cost of customer acquisition, their life time value, monthly recurring revenue etc.Pitch your topic with ease and precision using this Prospective Buyer Retention Dashboard With Key Performance Indicators Themes PDF. This layout presents information on Recurring Revenue, Revenue Growth, Customer Acquisition. It is also available for immediate download and adjustment. So, changes can be made in the color, design, graphics or any other component to create a unique layout.
Consumer Journey Mapping Techniques Referral Program Performance Tracking Dashboard Formats PDF
This slide covers the KPI dashboard for analyzing referral campaign results. It includes metrics such as total revenue generated, monthly recurring revenue, new customers, clicks, cancelled customers, paying customers, etc. Showcasing this set of slides titled Consumer Journey Mapping Techniques Referral Program Performance Tracking Dashboard Formats PDF. The topics addressed in these templates are Revenue, New Customers, Paying Customers. All the content presented in this PPT design is completely editable. Download it and make adjustments in color, background, font etc. as per your unique business setting.

Company Sales Employee Performance Measurement Dashboard Information PDF
This slide exhibits sales performance dashboard to analyze revenue and track business progress. It includes various indicators such as leads created, opportunities won, sales ratio and top revenue generating products. Showcasing this set of slides titled Company Sales Employee Performance Measurement Dashboard Information PDF. The topics addressed in these templates are Quick Ratio Target, Opportunities Won, Revenue Generating Products. All the content presented in this PPT design is completely editable. Download it and make adjustments in color, background, font etc. as per your unique business setting.

Supermarket Online Service Delivery And Management Dashboard Formats PDF
This slide shows the online grocery delivery dashboard of various products based on certain metrics and KPIs to achieve grocery retail revenue goals. It includes total orders, total customers total categories, and revenue. Showcasing this set of slides titled Supermarket Online Service Delivery And Management Dashboard Formats PDF. The topics addressed in these templates are Total Revenue, Total Customers, Dashboard. All the content presented in this PPT design is completely editable. Download it and make adjustments in color, background, font etc. as per your unique business setting.
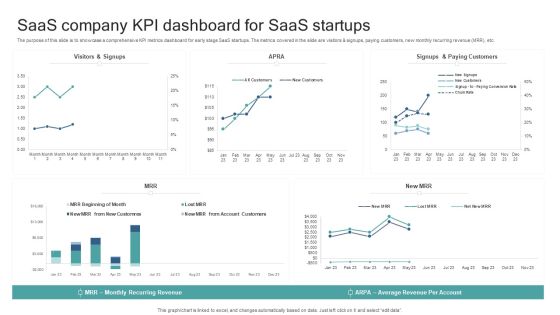
Saas Company KPI Dashboard For Saas Startups Background PDF
The purpose of this slide is to showcase a comprehensive KPI metrics dashboard for early stage SaaS startups. The metrics covered in the slide are visitors and signups, paying customers, new monthly recurring revenue MRR, etc. Showcasing this set of slides titled Saas Company KPI Dashboard For Saas Startups Background PDF. The topics addressed in these templates are Average Revenue Per Account, Monthly Recurring Revenue. All the content presented in this PPT design is completely editable. Download it and make adjustments in color, background, font etc. as per your unique business setting.

Saas Company Management Dashboard With Key Kpl Template PDF
The purpose of this slide is to showcase various metrics of SaaS company in the form of dashboard. The metrics could be, Paying customers, monthly recurring revenue MRR, customer acquisition cost CAC, etc. Showcasing this set of slides titled Saas Company Management Dashboard With Key Kpl Template PDF. The topics addressed in these templates are Monthly Recurring Revenue, Customer Acquisition Cost, Customer Lifetime Value, Average Revenue Per Unit. All the content presented in this PPT design is completely editable. Download it and make adjustments in color, background, font etc. as per your unique business setting.
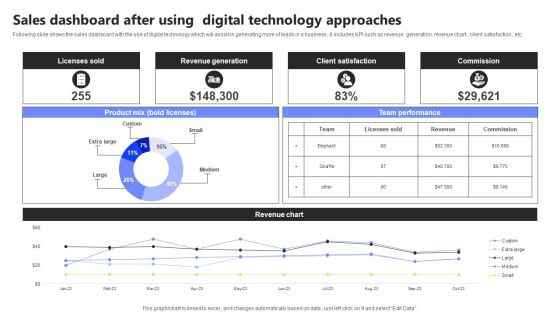
Sales Dashboard After Using Digital Technology Approaches Infographics PDF
Following slide shows the sales dashboard with the use of digital technology which will assist in generating more of leads in a business . It includes KPI such as revenue generation, revenue chart , client satisfaction , etc. Showcasing this set of slides titled Sales Dashboard After Using Digital Technology Approaches Infographics PDF. The topics addressed in these templates are Licenses Sold, Revenue Generation, Client Satisfaction. All the content presented in this PPT design is completely editable. Download it and make adjustments in color, background, font etc. as per your unique business setting.

Sales Sales By Geographic Region Report With Doughnut Chart Themes PDF
This slide illustrates graphical representation of sales contribution of countries. It includes revenue of FY19 in percentage and numbers and revenue of FY20 in percentage and numbers. Showcasing this set of slides titled Sales Sales By Geographic Region Report With Doughnut Chart Themes PDF. The topics addressed in these templates are Revenue, Doughnut Chart, Geographic Region Report. All the content presented in this PPT design is completely editable. Download it and make adjustments in color, background, font etc. as per your unique business setting.

Data And Customer Analysis Company Outline Diversified And Growing Business Elements PDF
This slide highlights the Nielsen diversified and growing business which includes solutions revenue share, customer base and revenue by geography, contracted revenue and years of experience. Find a pre designed and impeccable Data And Customer Analysis Company Outline Diversified And Growing Business Elements PDF. The templates can ace your presentation without additional effort. You can download these easy to edit presentation templates to make your presentation stand out from others. So, what are you waiting for Download the template from Slidegeeks today and give a unique touch to your presentation.

Hospitality Business Service Executive Report Demonstration PDF
This slide provide description of hospitability business that provide world class experience to travelers. It includes elements such as revenue streams, customer segment , channel traffic value propositions, products, annual revenue etc. Showcasing this set of slides titled Hospitality Business Service Executive Report Demonstration PDF. The topics addressed in these templates are Customer Segment, Revenue Streams, Value Propositions. All the content presented in this PPT design is completely editable. Download it and make adjustments in color, background, font etc. as per your unique business setting.
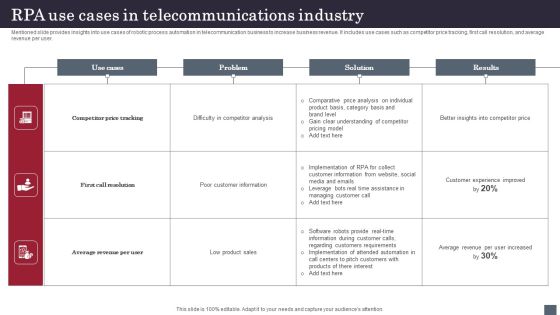
RPA Use Cases In Telecommunications Industry Infographics PDF
Mentioned slide provides insights into use cases of robotic process automation in telecommunication business to increase business revenue. It includes use cases such as competitor price tracking, first call resolution, and average revenue per user. Showcasing this set of slides titled RPA Use Cases In Telecommunications Industry Infographics PDF. The topics addressed in these templates are Competitor Price Tracking, First Call Resolution, Average Revenue Per User . All the content presented in this PPT design is completely editable. Download it and make adjustments in color, background, font etc. as per your unique business setting.

Goals Of Funding Ppt Powerpoint Presentation Slides Deck
This is a goals of funding ppt powerpoint presentation slides deck. This is a five stage process. The stages in this process are production capacity will increase by, revenue will increase by, market share will increase by.

Target Functional Framework For New Business Growth Download PDF
This slide demonstrates the operating model for a new business focuses on key channels, cost structure, value preposition and revenue streams. Showcasing this set of slides titled target functional framework for new business growth download pdf. The topics addressed in these templates are key partners, key resources, key activities, value proposition, customer relationship. All the content presented in this PPT design is completely editable. Download it and make adjustments in color, background, font etc. as per your unique business setting.
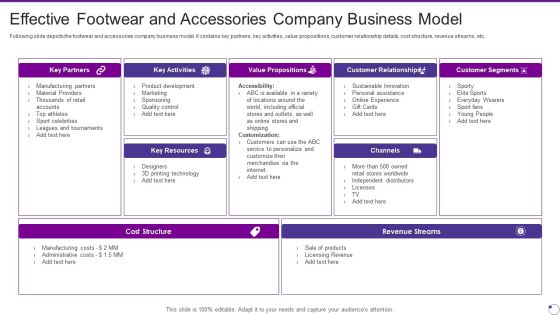
Footwear And Accessories Business Pitch Deck Effective Footwear And Accessories Company Formats PDF
Following slide depicts the footwear and accessories company business model. It contains key partners, key activities, value propositions, customer relationship details, cost structure, revenue streams, etc. Deliver an awe inspiring pitch with this creative footwear and accessories business pitch deck effective footwear and accessories company formats pdf bundle. Topics like key partners, key resources, cost structure, revenue streams can be discussed with this completely editable template. It is available for immediate download depending on the needs and requirements of the user.
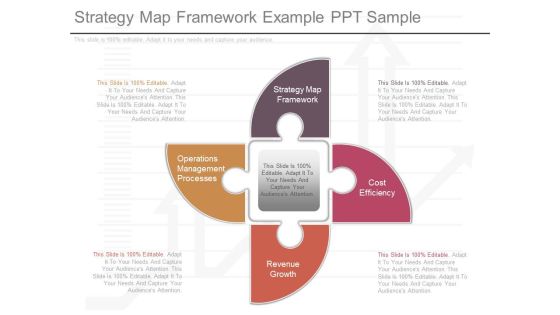
Strategy Map Framework Example Ppt Sample
This is a strategy map framework example ppt sample. This is a four stage process. The stages in this process are operations management processes, strategy map framework, cost efficiency, revenue growth.

Social Media Measurement Framework Powerpoint Slides
This is a social media measurement framework powerpoint slides. This is a six stage process. The stages in this process are innovation, brand health, customer experience, marketing optimization, business goal, revenue generation.\n\n\n\n\n\n
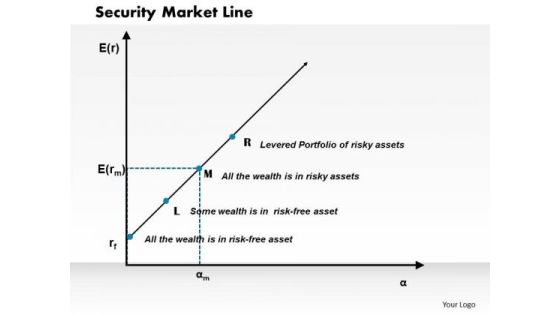
Business Framework Security Market Line PowerPoint Presentation
This diagram displays graph of security market line. You can use line graph to plot changes in data over time, such as monthly revenue and earnings changes or daily changes in stock market prices.
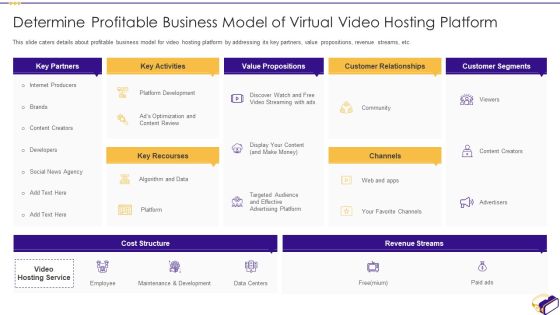
Virtual Video Hosting Applications Investor Fundraising Elevator Determine Profitable Business Brochure PDF
This slide caters details about profitable business model for video hosting platform by addressing its key partners, value propositions, revenue streams, etc. Deliver an awe inspiring pitch with this creative virtual video hosting applications investor fundraising elevator determine profitable business brochure pdf bundle. Topics like recourses, social, internet producers, development can be discussed with this completely editable template. It is available for immediate download depending on the needs and requirements of the user.

M And A Synergy Framework Ppt PowerPoint Presentation Professional Graphics
This is a m and a synergy framework ppt powerpoint presentation professional graphics. This is a three stage process. The stages in this process are revenue growth, commercial optimization, operational optimization, reduction in financial cost investment.
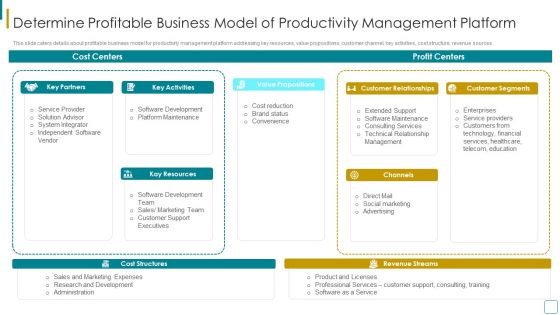
Strategic Business Efficiency Administration Tool Investor Financing Elevator Pitch Deck Determine Profitable Business Template PDF
This slide caters details about profitable business model for productivity management platform addressing key resources, value propositions, customer channel, key activities, cost structure, revenue sources. Deliver an awe inspiring pitch with this creative strategic business efficiency administration tool investor financing elevator pitch deck determine profitable business template pdf bundle. Topics like partners, activities, resources can be discussed with this completely editable template. It is available for immediate download depending on the needs and requirements of the user.
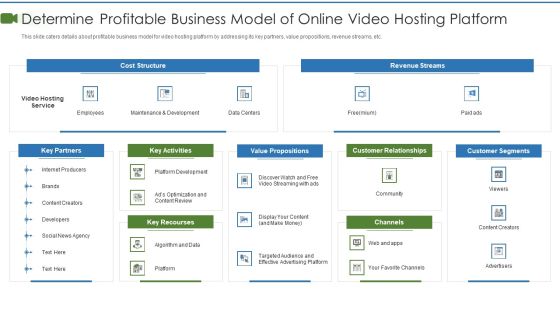
Private Video Streaming Platform Capital Fundraising Pitch Deck Determine Profitable Business Sample PDF
This slide caters details about profitable business model for video hosting platform by addressing its key partners, value propositions, revenue streams, etc. Deliver and pitch your topic in the best possible manner with this private video streaming platform capital fundraising pitch deck determine profitable business sample pdf. Use them to share invaluable insights on value propositions, customer relationships, customer segments and impress your audience. This template can be altered and modified as per your expectations. So, grab it now.
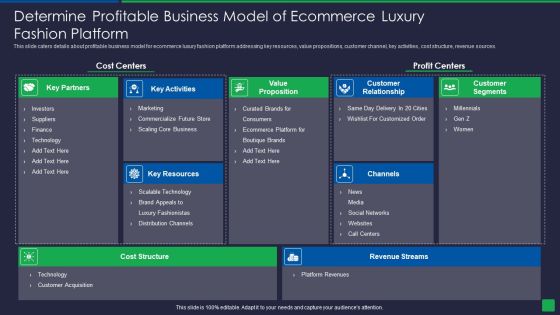
Online Fashion Extravagance Platform Venture Capitalist Financing Elevator Determine Profitable Business Elements PDF
This slide caters details about profitable business model for ecommerce luxury fashion platform addressing key resources, value propositions, customer channel, key activities, cost structure, revenue sources. Deliver and pitch your topic in the best possible manner with this online fashion extravagance platform venture capitalist financing elevator determine profitable business elements pdf. Use them to share invaluable insights on craftsmanship and heritage, growth, fashion industry and impress your audience. This template can be altered and modified as per your expectations. So, grab it now.

Advertisement And Marketing Agency Company Profile Advertising Agency Business Diagrams PDF
This slide shows the business model of advertising agency which covers key partners, activities, value proposition, customer relationships, key resources, channels, cost structure, revenue streams, etc. Deliver an awe inspiring pitch with this creative Advertisement And Marketing Agency Company Profile Advertising Agency Business Diagrams PDF bundle. Topics like Key Partners, Key Activities, Value Propositions can be discussed with this completely editable template. It is available for immediate download depending on the needs and requirements of the user.
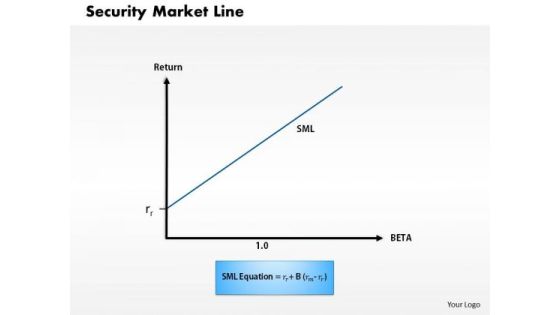
Business Framework Security Market Line 1 PowerPoint Presentation
This diagram displays graph of security market line. You can use line graph to plot changes in data over time, such as monthly revenue and earnings changes or daily changes in stock market prices.

Business Framework Security Market Line 11 PowerPoint Presentation
This diagram displays graph of security market line. You can use line graph to plot changes in data over time, such as monthly revenue and earnings changes or daily changes in stock market prices.

Agribusiness Competitive Assessment Of Major Agriculture Players Existing Mockup PDF
This slide caters details about profitable business model for agriculture firm addressing key resources, value propositions, customer channel, key activities, cost structure, revenue sources. Deliver an awe inspiring pitch with this creative Agribusiness Competitive Assessment Of Major Agriculture Players Existing Mockup PDF bundle. Topics like Nutrien, Data AND Image Precision, Data Library FOR Farmers, Development AND Deployment, Customized Solutions can be discussed with this completely editable template. It is available for immediate download depending on the needs and requirements of the user.

How We Creates Delivers And Captures Value Virtual Currency Financing Pitch Deck Pictures PDF
The slide provides the business model of the company. It covers the key stakeholders partners, users, operators etc. uses of cryptocurrency, revenue generation etc. Deliver an awe inspiring pitch with this creative how we creates delivers and captures value virtual currency financing pitch deck pictures pdf bundle. Topics like shopkeepers, telecom companies, businesses, companies can be discussed with this completely editable template. It is available for immediate download depending on the needs and requirements of the user.
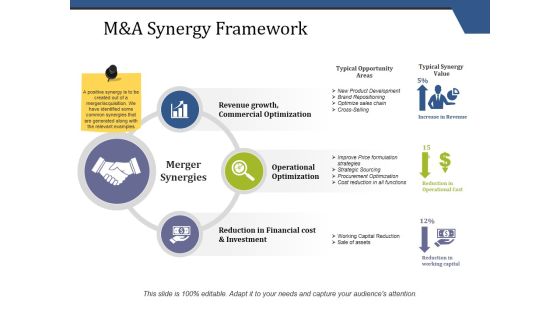
M And A Synergy Framework Ppt PowerPoint Presentation Gallery Graphics Tutorials
This is a m and a synergy framework ppt powerpoint presentation gallery graphics tutorials. This is a three stage process. The stages in this process are merger synergies, revenue growth, commercial optimization, operational optimization, reduction in financial cost and investment.

Hubspot Financial Framework For Profitable Growth Introduction PDF
This slide provides the glimpse about the financial framework of the company which focuses on revenue growth, operating margin, operating cash flow, etc. Deliver an awe inspiring pitch with this creative hubspot financial framework for profitable growth introduction pdf bundle. Topics like revenue growth, operating margin, operating cash flow can be discussed with this completely editable template. It is available for immediate download depending on the needs and requirements of the user.

Agile Quality Control Framework IT Forfeiture Of Poorquality Projects Structure PDF
This slide highlights the companys year over year financial statistics covering details about the loss incur, revenue generated, and expenses made. Deliver an awe inspiring pitch with this creative agile quality control framework it forfeiture of poorquality projects structure pdf bundle. Topics like software, developed, financial, revenue, expense can be discussed with this completely editable template. It is available for immediate download depending on the needs and requirements of the user.

B2B Sales Framework Playbook B2B Prospects Performance Measurement Dashboard Professional PDF
This slide provides information regarding B2B performance tracking dashboard to measure leads, MQL, SQL, customers, revenue goals, total media spend. Deliver an awe inspiring pitch with this creative B2B Sales Framework Playbook B2B Prospects Performance Measurement Dashboard Professional PDF bundle. Topics like Cost Per Lead, Customers, Revenue Goal can be discussed with this completely editable template. It is available for immediate download depending on the needs and requirements of the user.

Business Analysis Ppt PowerPoint Presentation Outline Design Inspiration
This is a business analysis ppt powerpoint presentation outline design inspiration. This is a four stage process. The stages in this process are high, market share, low, takeovers targets, winners, breakup targets, losers, revenue growth.

Business Analysis Ppt PowerPoint Presentation Styles Images
This is a business analysis ppt powerpoint presentation styles images. This is a four stage process. The stages in this process are high, low, market share, revenue growth, winners.
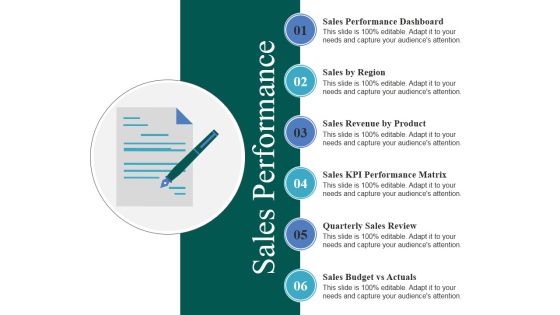
Sales Performance Ppt PowerPoint Presentation Infographics Visuals
This is a sales performance ppt powerpoint presentation infographics visuals. This is a six stage process. The stages in this process are sales by region, sales revenue by product, sales kpi performance matrix, quarterly sales review, sales budget vs actuals.
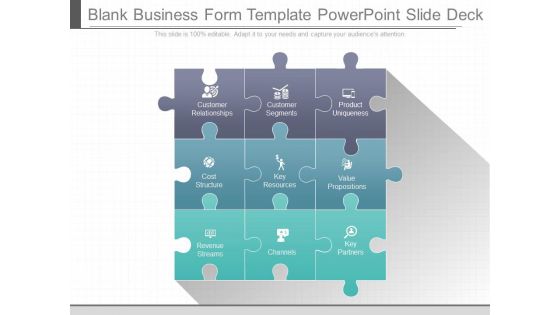
Blank Business Form Template Powerpoint Slide Deck
This is a blank business form template powerpoint slide deck. This is a nine stage process. The stages in this process are customer relationships, customer segments, product uniqueness, cost structure, key resources, value propositions, revenue streams, channels, key partners.\n\n
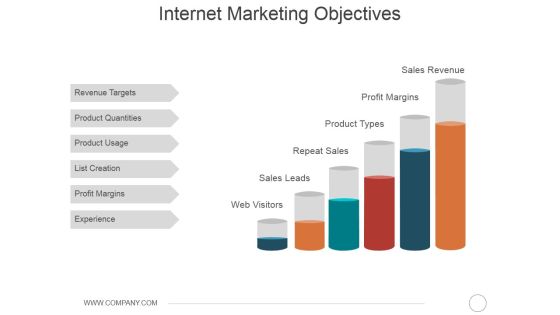
Internet Marketing Objectives Ppt PowerPoint Presentation Portfolio Summary
This is a internet marketing objectives ppt powerpoint presentation portfolio summary. This is a six stage process. The stages in this process are revenue targets, product quantities, product usage, list creation, profit margins, experience.
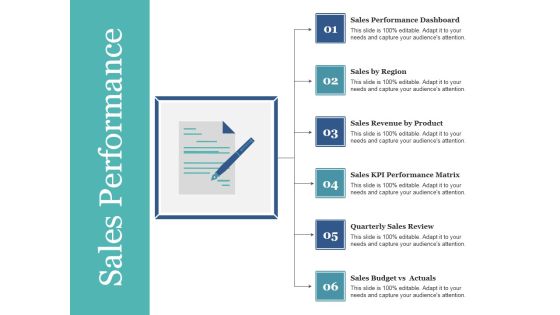
Sales Performance Ppt PowerPoint Presentation Summary Influencers
This is a sales performance ppt powerpoint presentation summary influencers. This is a six stage process. The stages in this process are sales performance dashboard, sales by region, sales revenue by product, sales kpi performance matrix, quarterly sales review.
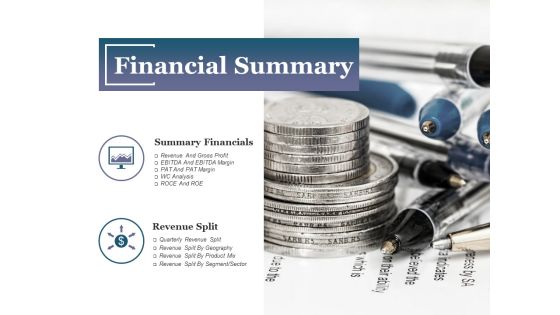
Financial Summary Ppt PowerPoint Presentation Infographics Design Inspiration
This is a financial summary ppt powerpoint presentation infographics design inspiration. This is a two stage process. The stages in this process are summary financials, revenue split, financial summary, business, marketing.
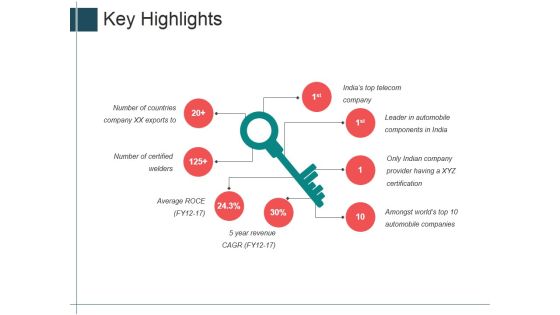
Key Highlights Ppt Powerpoint Presentation Styles Portfolio
This is a key highlights ppt powerpoint presentation styles portfolio. This is a seven stage process. The stages in this process are average roce, 5 year revenue cagr, indies top telecom company, key.

Stacked Line Ppt PowerPoint Presentation Portfolio Vector
This is a stacked line ppt powerpoint presentation portfolio vector. This is a three stage process. The stages in this process are revenue in percentage, business, marketing, growth, strategy.
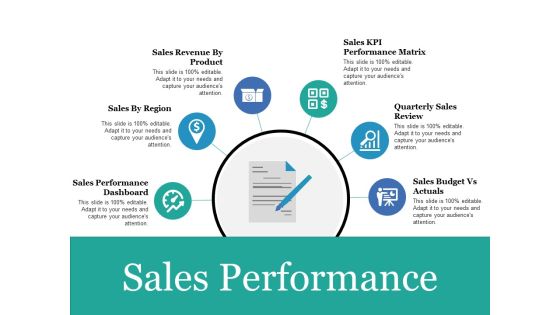
Sales Performance Ppt PowerPoint Presentation Portfolio Show
This is a sales performance ppt powerpoint presentation portfolio show. This is a six stage process. The stages in this process are sales performance dashboard, sales by region, sales revenue by product, quarterly sales review, sales budget vs actuals.
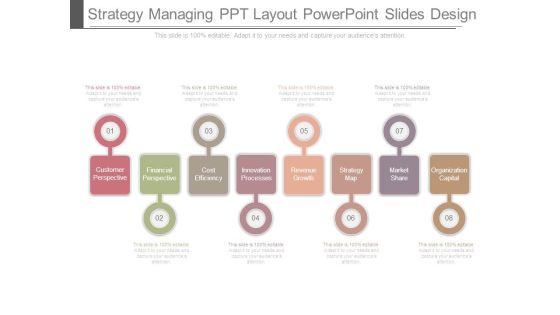
Strategy Managing Ppt Layout Powerpoint Slides Design
This is a strategy managing ppt layout powerpoint slides design. This is a eight stage process. The stages in this process are customer perspective, financial perspective, cost efficiency, innovation processes, revenue growth, strategy map, market share, organization capital.
Website Performance Review Template 2 Ppt PowerPoint Presentation Icon Design Ideas
This is a website performance review template 2 ppt powerpoint presentation icon design ideas. This is a four stage process. The stages in this process are column two, revenue trends, traffic sources.

External Partner Activities Done Powerpoint Slide Designs
This is an external partner activities done powerpoint slide designs. This is a five stage process. The stages in this process are external partner activities done, customer relationships, customer segments, cost structure, revenue streams.

Sales Highlight Ppt PowerPoint Presentation Ideas Design Templates
This is a sales highlight ppt powerpoint presentation ideas design templates. This is a five stage process. The stages in this process are total sales by month, lead sources revenue share, opportunities total sales by probability, total sale amount.
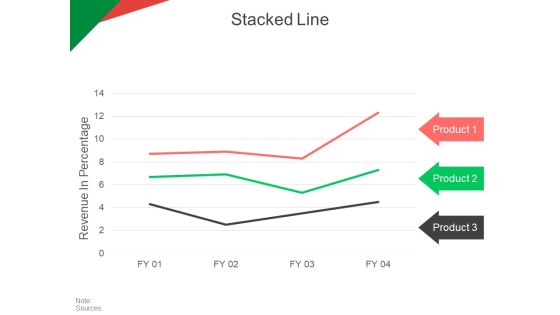
Stacked Line Ppt PowerPoint Presentation Portfolio Example Topics
This is a stacked line ppt powerpoint presentation portfolio example topics. This is a three stage process. The stages in this process are revenue in percentage, product, business, marketing, strategy.

Customer Success Vs Customer Service Ppt PowerPoint Presentation Portfolio Professional
This is a customer success vs customer service ppt powerpoint presentation portfolio professional. This is a six stage process. The stages in this process are reactive, proactive, cost centre, revenue generating, customer service, customer success.

Business Overview Ppt PowerPoint Presentation Styles Icons
This is a business overview ppt powerpoint presentation styles icons. This is a six stage process. The stages in this process are highlights, financial highlights, product offering, revenue split by country, quarter track record.

Business Overview Ppt PowerPoint Presentation Infographic Template Visuals
This is a business overview ppt powerpoint presentation infographic template visuals. This is a six stage process. The stages in this process are highlights, financial highlights, product offering, revenue split by country, quarter track record.

Business Overview Ppt PowerPoint Presentation File Ideas
This is a business overview ppt powerpoint presentation file ideas. This is a six stage process. The stages in this process are highlights, financial highlights, product offering, revenue split by country, our team.

Content Ppt PowerPoint Presentation Infographics Diagrams
This is a content ppt powerpoint presentation infographics diagrams. This is a thirteen stage process. The stages in this process are business highlights, financial highlights, products offering, sales performance dashboard, sales revenue by region.

Strategic Objectives Perspective Presentation Design
This is a strategic objectives perspective presentation design. This is a four stage process. The stages in this process are strategic objectives perspective, build high performance products, improve cost efficiency, increase revenue growth.
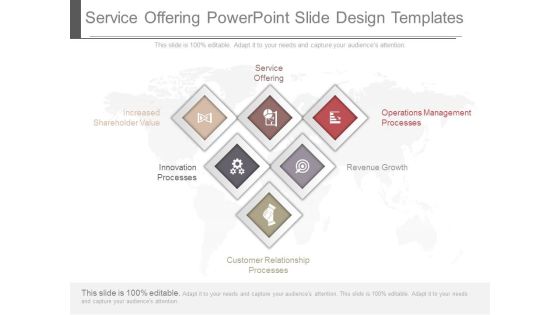
Service Offering Powerpoint Slides Design Templates
This is a service offering powerpoint slides design templates. This is a six stage process. The stages in this process are service offering, increased shareholder value, innovation processes, customer relationship processes, revenue growth, operations management processes.

Customer Relationship Processes Powerpoint Slide Design Templates
This is a customer relationship processes powerpoint slide design templates. This is a six stage process. The stages in this process are customer relationship processes, increased shareholder value, revenue growth, innovation processes, service offering, operations management processes.
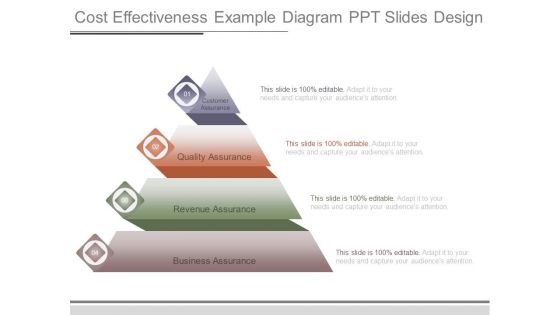
Cost Effectiveness Example Diagram Ppt Slides Design
This is a cost effectiveness example diagram ppt slides design. This is a four stage process. The stages in this process are customer assurance, quality assurance, revenue assurance, business assurance.
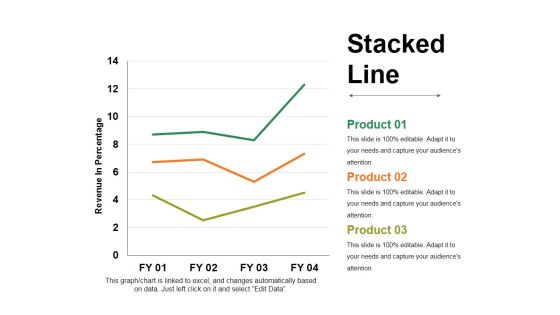
Stacked Line Ppt PowerPoint Presentation Ideas Design Inspiration
This is a stacked line ppt powerpoint presentation ideas design inspiration. This is a three stage process. The stages in this process are revenue in percentage, business, marketing, growth, strategy.

Customer Success Vs Customer Service Ppt PowerPoint Presentation Ideas Design Templates
This is a customer success vs customer service ppt powerpoint presentation ideas design templates. This is a two stage process. The stages in this process are proactive, customer goal achievement, revenue generating, reactive, cost centre.
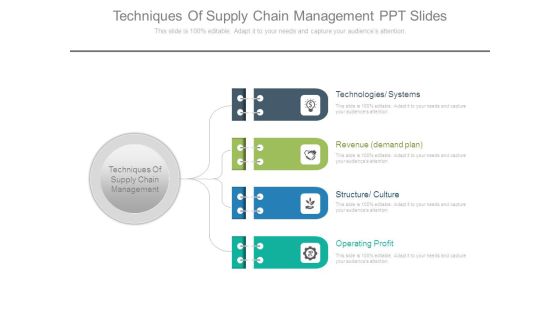
Techniques Of Supply Chain Management Ppt Slides
This is a techniques of supply chain management ppt slides. This is a four stage process. The stages in this process are techniques of supply chain management, technologies systems, revenue demand plan, structure culture, operating profit.

Improve Shareholder Value Powerpoint Slide Clipart
This is a improve shareholder value powerpoint slide clipart. This is a six stage process. The stages in this process are improve shareholder value, revenue growth strategy, productivity strategy, improve cost structure, increase value to customers, build the franchise.
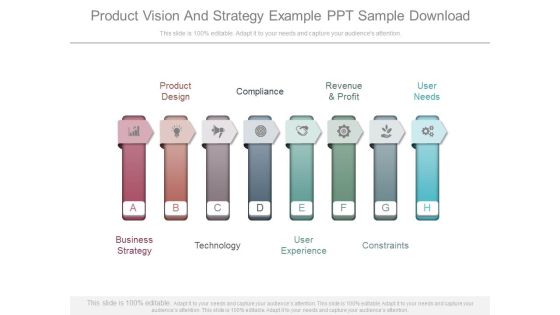
Product Vision And Strategy Example Ppt Sample Download
This is a product vision and strategy example ppt sample download. This is a eight stage process. The stages in this process are product design, compliance, revenue and profit, user needs, constraints, user experience, technology, business strategy.

Advertising Online Example Ppt Presentation
This is a advertising online example ppt presentation. This is a six stage process. The stages in this process are business strategy, constraints, revenue and profit, product design, user experience, technology.
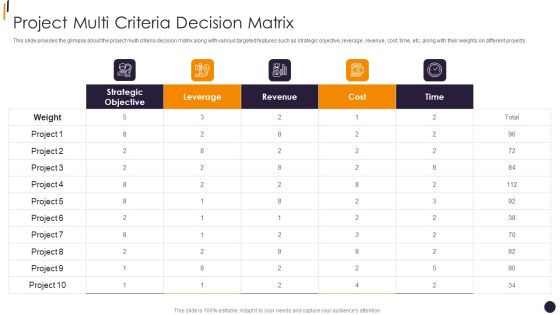
PMP Tools Project Multi Criteria Decision Matrix Ideas PDF
This slide provides the glimpse about the project multi criteria decision matrix along with various targeted features such as strategic objective, leverage, revenue, cost, time, etc. along with their weights on different projects.Deliver an awe inspiring pitch with this creative PMP Tools Project Multi Criteria Decision Matrix Ideas PDF bundle. Topics like Strategic Objective, Leverage, Revenue can be discussed with this completely editable template. It is available for immediate download depending on the needs and requirements of the user.

Supplier Impact On Shareholder Value Elements PDF
This slide shows the supplier impact on shareholder valuation such as profitability, capital employed, revenue growth, cost reduction, working capital efficiency, etc.Presenting supplier impact on shareholder value elements pdf to provide visual cues and insights. Share and navigate important information on two stages that need your due attention. This template can be used to pitch topics like revenue growth, profitability, capital employed. In addtion, this PPT design contains high resolution images, graphics, etc, that are easily editable and available for immediate download.

Business Assessment Outline Financial Summary Ppt Portfolio Gallery PDF
Presenting business assessment outline financial summary ppt portfolio gallery pdf to provide visual cues and insights. Share and navigate important information on five stages that need your due attention. This template can be used to pitch topics like ebitda, revenue growth, net revenue, net profit, net profit margin. In addition, this PPT design contains high-resolution images, graphics, etc, that are easily editable and available for immediate download.

Financial Software Vendor Scan And Mini Profiles Mockup PDF
The slide provides brief business overview of a financial software vendor. Profile include details such as business overview, revenue from the software, user base the software, major industries served, key partners, major competitors etc. Deliver an awe inspiring pitch with this creative Financial Software Vendor Scan And Mini Profiles Mockup PDF bundle. Topics like Financial Services, Consumer Goods, Technology, Revenue can be discussed with this completely editable template. It is available for immediate download depending on the needs and requirements of the user.

Information Technology Transformation Organization Financials Summary Of The Company Structure PDF
This slide shows companys key financial summary covering revenue generation, gross profit and gross profit margin. It also includes statistics of earnings before interest, tax, depreciation and amortization EBITDA and its margin Deliver an awe inspiring pitch with this creative information technology transformation organization financials summary of the company structure pdf bundle. Topics like gross profit, revenue, ebitda margin can be discussed with this completely editable template. It is available for immediate download depending on the needs and requirements of the user.

Company Financials Before Implementation Of Upsell Strategy Structure PDF
This slide shows the company financials before the implementation of upsell strategy in the business Total Revenue and Total Profits for the last five years from 2017 to 2021 along with the key notes. Deliver an awe inspiring pitch with this creative company financials before implementation of upsell strategy structure pdf bundle. Topics like financials, total profit, revenue, rate can be discussed with this completely editable template. It is available for immediate download depending on the needs and requirements of the user.
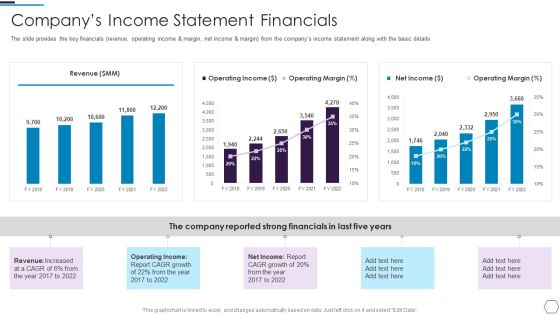
Information Technology Firm Report Example Companys Income Statement Financials Structure PDF
The slide provides the key financials revenue, operating income and margin, net income and margin from the companys income statement along with the basic details Deliver an awe inspiring pitch with this creative Information Technology Firm Report Example Companys Income Statement Financials Structure PDF bundle. Topics like Revenue Increased, Operating Income, Operating Margin can be discussed with this completely editable template. It is available for immediate download depending on the needs and requirements of the user.

Addressing Financial Projections Of Consumer Electronics Firm Structure PDF
This slide caters details about financial projections of consumer electronics firm progress for next 5 years with operating profit, total revenue and Opex. Deliver an awe inspiring pitch with this creative addressing financial projections of consumer electronics firm structure pdf bundle. Topics like gross sale or total revenue, gross profit, growth assumption can be discussed with this completely editable template. It is available for immediate download depending on the needs and requirements of the user.
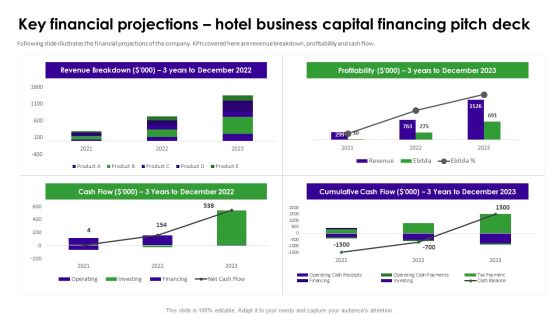
Key Financial Projections Hotel Business Capital Financing Pitch Deck Structure PDF
Following slide illustrates the financial projections of the company. KPIs covered here are revenue breakdown, profitability and cash flow.Deliver an awe inspiring pitch with this creative Key Financial Projections Hotel Business Capital Financing Pitch Deck Structure PDF bundle. Topics like Revenue Breakdown, Profitability, Cumulative Cash can be discussed with this completely editable template. It is available for immediate download depending on the needs and requirements of the user.

Hospital Medical Research Company Profile Ownership Structure Designs PDF
The slide describes the company shares held by promoters, public, mutual funds, foreign institutional investors and other institutions. It also depicts FII share holding by region and historical promoter share holding. Deliver an awe inspiring pitch with this creative Hospital Medical Research Company Profile Ownership Structure Designs PDF bundle. Topics like Historical Revenue, Geography, Revenue Split 2022, 2018 To 2022 can be discussed with this completely editable template. It is available for immediate download depending on the needs and requirements of the user.

IT Application Services Company Outline Competitor Comparison Report Elements PDF
The slide highlights the competitor report for IT company. It compares companies on the basis of business segment, geographical presence, financial revenue and global market share. Deliver an awe inspiring pitch with this creative IT Application Services Company Outline Competitor Comparison Report Elements PDF bundle. Topics like Total Employees, Revenue Per Employee, Countries Served can be discussed with this completely editable template. It is available for immediate download depending on the needs and requirements of the user.

Dashboards Related To The Zoo Financials And Operations Ppt Portfolio Graphics Example PDF
This slide shows the dashboard KPI related to the ABC Zoo which includes the forecasted revenue, competitors details, visitors attractions, capital expenditure and many more.Deliver and pitch your topic in the best possible manner with this dashboards related to the zoo financials and operations ppt portfolio graphics example pdf. Use them to share invaluable insights on capital expenditure, visitors attraction, forecasted revenue and impress your audience. This template can be altered and modified as per your expectations. So, grab it now.

Competitor Comparison Report IT Software Development Company Profile Background PDF
The slide highlights the competitor report for IT company. It compares companies on the basis of business segment, geographical presence, financial revenue and global market share. Deliver an awe inspiring pitch with this creative Competitor Comparison Report IT Software Development Company Profile Background PDF bundle. Topics like Competitor Comparison Report, Revenue Per Employee can be discussed with this completely editable template. It is available for immediate download depending on the needs and requirements of the user.

Business Operations Assessment Financial Summary Ppt Inspiration Design Templates PDF
Presenting business operations assessment financial summary ppt inspiration design templates pdf to provide visual cues and insights. Share and navigate important information on five stages that need your due attention. This template can be used to pitch topics like ebitda, revenue growth, net revenue, net profit, net profit margin. In addition, this PPT design contains high-resolution images, graphics, etc, that are easily editable and available for immediate download.
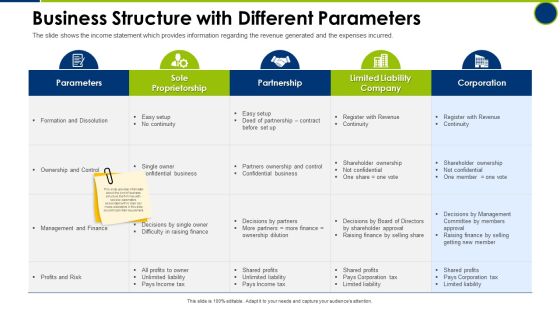
Business Structure With Different Parameters Operating Manual Ppt Layouts Inspiration PDF
The slide shows the income statement which provides information regarding the revenue generated and the expenses incurred. Deliver an awe inspiring pitch with this creative business structure with different parameters operating manual ppt layouts inspiration pdf bundle. Topics like revenue, income tax, risk, profits, finance can be discussed with this completely editable template. It is available for immediate download depending on the needs and requirements of the user.

Market Validation And Traction Dating Services Application Investor Funding PDF Demonstration PDF
Following slide provides informational statistics about market validation and business traction. Key metrics covered in the slide are active users, revenue and profit margins. Deliver an awe inspiring pitch with this creative Market Validation And Traction Dating Services Application Investor Funding PDF Demonstration PDF bundle. Topics like Key Matric, Profit Margins, Revenue can be discussed with this completely editable template. It is available for immediate download depending on the needs and requirements of the user.
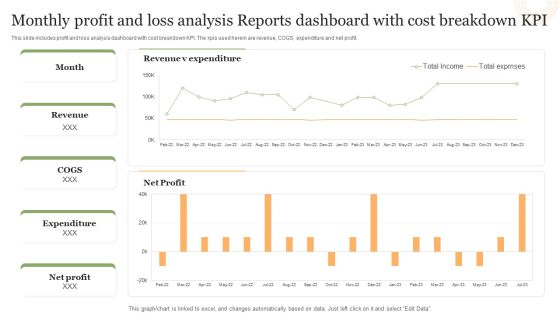
Monthly Profit And Loss Analysis Reports Dashboard With Cost Breakdown Kpi Structure PDF
This slide includes profit and loss analysis dashboard with cost breakdown KPI. The kpis used herein are revenue, COGS, expenditure and net profit.Pitch your topic with ease and precision using this Monthly Profit And Loss Analysis Reports Dashboard With Cost Breakdown Kpi Structure PDF. This layout presents information on Revenue Expenditure, Net Profit, Total Exprnses. It is also available for immediate download and adjustment. So, changes can be made in the color, design, graphics or any other component to create a unique layout.

Yearly Business Performance Assessment And Evaluation Dashboard Structure PDF
This slide contains annual business review of a company. It includes revenue comparison, sales assessment and profitability representation. Showcasing this set of slides titled Yearly Business Performance Assessment And Evaluation Dashboard Structure PDF. The topics addressed in these templates are Revenue Comparison, Sales, Profitability. All the content presented in this PPT design is completely editable. Download it and make adjustments in color, background, font etc. as per your unique business setting.
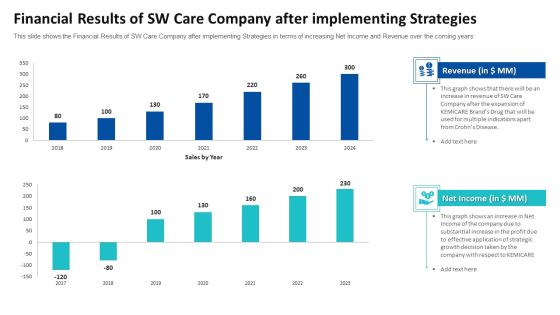
Financial Results Of SW Care Company After Implementing Strategies Ppt Summary Design Templates PDF
This slide shows the Financial Results of SW Care Company after implementing Strategies in terms of increasing Net Income and Revenue over the coming years. Deliver an awe inspiring pitch with this creative financial results of sw care company after implementing strategies ppt summary design templates pdf bundle. Topics like revenue, net income, strategic, growth can be discussed with this completely editable template. It is available for immediate download depending on the needs and requirements of the user.

Comprehensive Development And Operations Adoption Initiatives IT Devops Activities Management Structure PDF
This slide provides information regarding essential DevOps activities management dashboard in terms of revenue by hour, storefront users, errors by host, response time by app, etc. Deliver and pitch your topic in the best possible manner with this comprehensive development and operations adoption initiatives it devops activities management structure pdf. Use them to share invaluable insights on application, revenue, average and impress your audience. This template can be altered and modified as per your expectations. So, grab it now.

Quarterly Financial Performance Evaluation Report Template PDF
This slide showcase quarterly financial performance measurement and analysis summary charts. It highlights the revenue chart, gross profit chart, profit before tax chart, and net profit chart. Showcasing this set of slides titled Quarterly Financial Performance Evaluation Report Template PDF. The topics addressed in these templates are Revenue, Gross Profit, Profit Before Tax . All the content presented in this PPT design is completely editable. Download it and make adjustments in color, background, font etc. as per your unique business setting.

Accounting Pitch Deck Key Financial Projections For Upcoming Years Designs PDF
This slide illustrates key performance indicators highlighting the financial projections for upcoming years. KPIs covered here are revenue breakdown, profitability and cash flow.Deliver an awe inspiring pitch with this creative accounting pitch deck key financial projections for upcoming years designs pdf bundle. Topics like revenue breakdown, profitability, cumulative cash flow can be discussed with this completely editable template. It is available for immediate download depending on the needs and requirements of the user.

 Home
Home