Revenue Management

Improve Shareholder Value Powerpoint Slide Clipart
This is a improve shareholder value powerpoint slide clipart. This is a six stage process. The stages in this process are improve shareholder value, revenue growth strategy, productivity strategy, improve cost structure, increase value to customers, build the franchise.
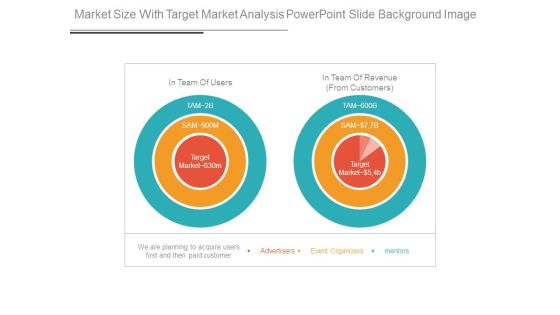
Market Size With Target Market Analysis Powerpoint Slide Background Image
This is a market size with target market analysis powerpoint slide background image. This is a three stage process. The stages in this process are in team of users, in team of revenue from customer, advertisers, event organizers, mentors.

Daily Executive Dashboards For Web Ppt Presentation Ideas
This is a daily executive dashboards for web ppt presentation ideas. This is a six stage process. The stages in this process are homepage, login, purchase ticket, email confirmation, ecommerce website, revenue per minute.

Pricing Objectives Diagram Sample Of Ppt Presentation
This is a pricing objectives diagram sample of ppt presentation. This is a seven stage process. The stages in this process are pricing objectives, revenue maximization, profit maximization, partial cost recovery, survival, status quo, quantity leader, maximize quantity.

Table Of Contents Template 2 Ppt PowerPoint Presentation Slide
This is a table of contents template 2 ppt powerpoint presentation slide. This is a two stage process. The stages in this process are business model, revenue model, growth strategy, marketing strategy, market size, financial summary, financial projection, shareholding pattern.
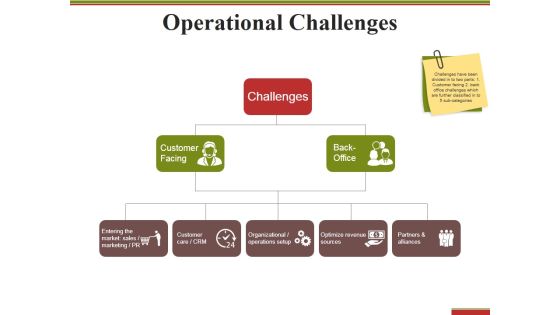
Operational Challenges Ppt PowerPoint Presentation Infographics Slideshow
This is a operational challenges ppt powerpoint presentation infographics slideshow. This is a three stage process. The stages in this process are challenges, customer facing, optimize revenue sources, back office.
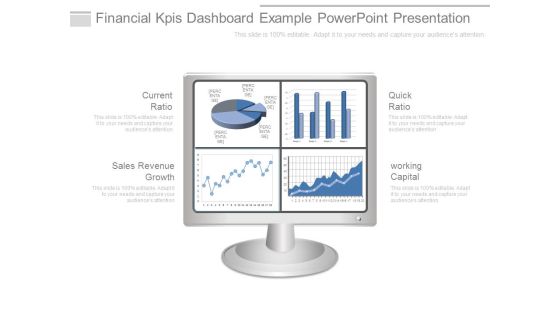
Financial Kpis Dashboard Example Powerpoint Presentation
This is a financial kpis dashboard example powerpoint presentation. This is a four stage process. The stages in this process are current ratio, sales revenue growth, quick ratio, working capital.
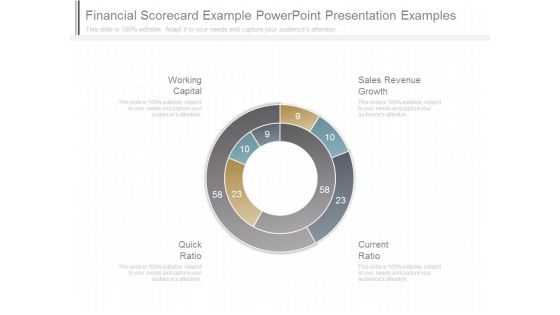
Financial Scorecard Example Powerpoint Presentation Examples
This is a financial scorecard example powerpoint presentation examples. This is a four stage process. The stages in this process are working capital, quick ratio, current ratio, sales revenue growth.
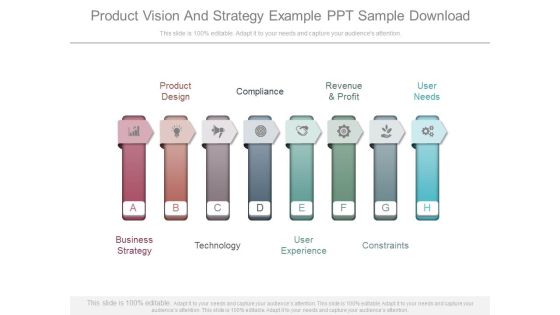
Product Vision And Strategy Example Ppt Sample Download
This is a product vision and strategy example ppt sample download. This is a eight stage process. The stages in this process are product design, compliance, revenue and profit, user needs, constraints, user experience, technology, business strategy.

Sales Kpi Performance Summary Ppt PowerPoint Presentation Infographic Template Elements
This is a sales kpi performance summary ppt powerpoint presentation infographic template elements. This is a seven stage process. The stages in this process are revenue comparison, quantity comparison, product sales mix, regional sales mix, budget.

Sales Kpi Performance Summary Ppt PowerPoint Presentation Show Inspiration
This is a sales kpi performance summary ppt powerpoint presentation show inspiration. This is a two stage process. The stages in this process are revenue comparison, quantity comparison, product sales mix, regional sales mix, budget.

Business Economic Value Diagram Ppt Slides Examples
This is a business economic value diagram ppt slides examples. This is a four stage process. The stages in this process are revenue model, value chain structure, value proposition, market segments.

Example Of Economic Issues Ppt Powerpoint Shapes
This is a example of economic issues ppt powerpoint shapes. This is a five stage process. The stages in this process are electricity shortfall, dependence on loans, excess of import than export, weak revenue system, foreign exchange rate.
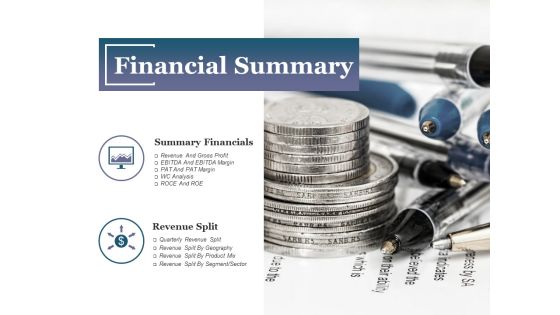
Financial Summary Ppt PowerPoint Presentation Infographics Design Inspiration
This is a financial summary ppt powerpoint presentation infographics design inspiration. This is a two stage process. The stages in this process are summary financials, revenue split, financial summary, business, marketing.

Business And Financial Overview Ppt PowerPoint Presentation Pictures Visuals
This is a business and financial overview ppt powerpoint presentation pictures visuals. This is a two stage process. The stages in this process are current key offerings, revenue by geography, current technology used, business financial overview.

Business Model Canvas Process Table Powerpoint Topics
This is a business model canvas process table powerpoint topics. This is a five stage process. The stages in this process are key partners, cost structure, key resources, key activities, channels, revenue streams, value propositions, customer, relationships, customer segments.
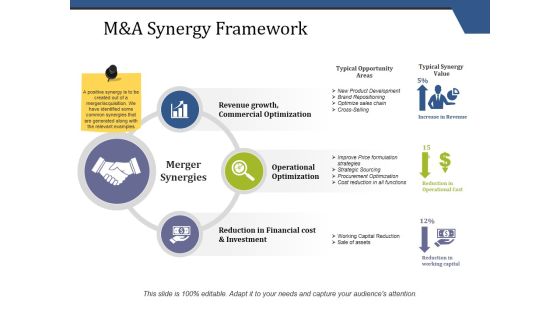
M And A Synergy Framework Ppt PowerPoint Presentation Gallery Graphics Tutorials
This is a m and a synergy framework ppt powerpoint presentation gallery graphics tutorials. This is a three stage process. The stages in this process are merger synergies, revenue growth, commercial optimization, operational optimization, reduction in financial cost and investment.
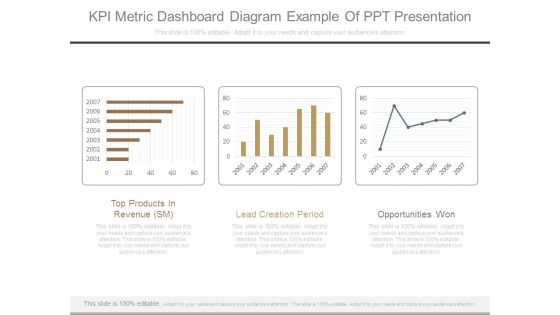
Kpi Metric Dashboard Diagram Example Of Ppt Presentation
This is a kpi metric dashboard diagram example of ppt presentation. This is a three stage process. The stages in this process are top products in revenue sm, lead creation period, opportunities won.
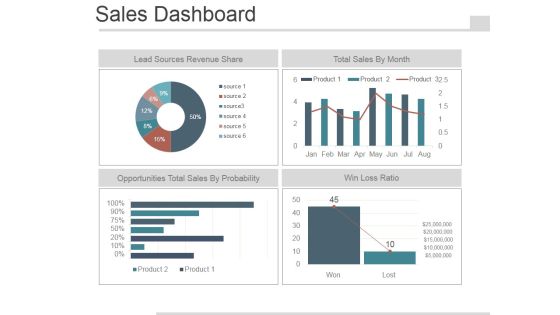
Sales Dashboard Slide Template 2 Ppt PowerPoint Presentation Images
This is a sales dashboard slide template 2 ppt powerpoint presentation images. This is a four stage process. The stages in this process are lead sources revenue share, total sales by month, opportunities total sales by probability, win loss ratio.

Goals Of Funding Ppt PowerPoint Presentation Pictures Format
This is a goals of funding ppt powerpoint presentation pictures format. This is a five stage process. The stages in this process are market share will increase by, operating cost will reduce by, revenue will increase by.

Service Profit Chain Diagram Ppt Images
This is a service profit chain diagram ppt images. This is a four stage process. The stages in this process are org processes, employee satisfaction, quality of customer interactions, customer satisfaction, revenue and profit.

Table Of Contents Ppt PowerPoint Presentation Outline Ideas
This is a table of contents ppt powerpoint presentation outline ideas. This is a two stage process. The stages in this process are executive summary, key highlights, business model, revenue model.

Business Overview Ppt PowerPoint Presentation Styles Icons
This is a business overview ppt powerpoint presentation styles icons. This is a six stage process. The stages in this process are highlights, financial highlights, product offering, revenue split by country, quarter track record.

Business Overview Ppt PowerPoint Presentation Infographic Template Visuals
This is a business overview ppt powerpoint presentation infographic template visuals. This is a six stage process. The stages in this process are highlights, financial highlights, product offering, revenue split by country, quarter track record.
Stacked Line Ppt PowerPoint Presentation Icon Professional
This is a stacked line ppt powerpoint presentation icon professional. This is a three stage process. The stages in this process are Business, Financial, Marketing, Graph, Strategy Revenue In Percentage.

Business Model Canvas For Process Analysis Powerpoint Images
This is a business model canvas for process analysis powerpoint images. This is a seven stage process. The stages in this process are key partners, key activities, value, propositions, customer relationships, customer segments, key resources, channels, cost structure, revenue streams.

External Analysis Template 2 Ppt PowerPoint Presentation Styles Example File
This is a external analysis template 2 ppt powerpoint presentation styles example file. This is a two stage process. The stages in this process are revenue export, year, growth.

Sales Highlights Ppt PowerPoint Presentation Infographic Template Show
This is a sales highlights ppt powerpoint presentation infographic template show. This is a four stage process. The stages in this process are lead sources revenue share, total sales by month, opportunities total sales by probability, win loss ratio.
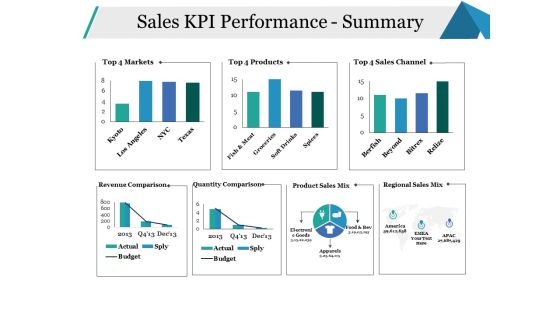
Sales KPI Performance Summary Ppt PowerPoint Presentation Infographics Model
This is a sales kpi performance summary ppt powerpoint presentation infographics model. This is a seven stage process. The stages in this process are sales channel, revenue comparison, quantity comparison, business, marketing.
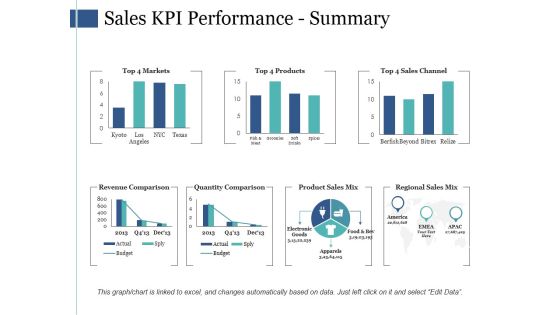
Sales Kpi Performance Summary Ppt PowerPoint Presentation Infographic Template Infographics
This is a sales kpi performance summary ppt powerpoint presentation infographic template infographics. This is a seven stage process. The stages in this process are revenue comparison, quantity comparison, product sales mix, regional sales mix.

Sales Kpi Performance Summary Ppt PowerPoint Presentation Ideas Graphics Template
This is a sales kpi performance summary ppt powerpoint presentation ideas graphics template. This is a seven stage process. The stages in this process are revenue comparison, quantity comparison, product sales mix, regional sales mix.

Competitor Analysis Ppt PowerPoint Presentation Layouts Slides
This is a competitor analysis ppt powerpoint presentation layouts slides. This is a four stage process. The stages in this process are sales development, performance indicators, sales development of industry, revenue sales.

Competitor Analysis Ppt PowerPoint Presentation Visual Aids Model
This is a competitor analysis ppt powerpoint presentation visual aids model. This is a four stage process. The stages in this process are sales development of industry, performance indicators, sales development, revenue sales, business.

Stacked Line Ppt PowerPoint Presentation Professional Graphics Pictures
This is a stacked line ppt powerpoint presentation professional graphics pictures. This is a two stage process. The stages in this process are revenue in percentage, business, marketing, graph, finance.
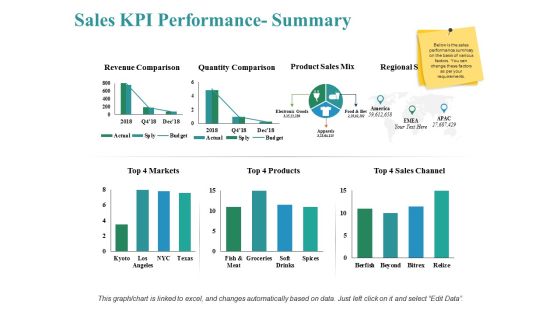
Sales Kpi Performance Summary Ppt PowerPoint Presentation Show Themes
This is a sales kpi performance summary ppt powerpoint presentation show themes. This is a three stage process. The stages in this process are revenue comparison, quantity comparison, product sales mix, markets, sales channel.

Cost And Benefits Of New Product Ppt PowerPoint Presentation Inspiration Diagrams
This is a cost and benefits of new product ppt powerpoint presentation inspiration diagrams. This is a three stage process. The stages in this process are recurrent costs, cost decreasing, revenue increasing, benefits, costs.

M And A Synergy Framework Ppt PowerPoint Presentation Professional Graphics
This is a m and a synergy framework ppt powerpoint presentation professional graphics. This is a three stage process. The stages in this process are revenue growth, commercial optimization, operational optimization, reduction in financial cost investment.

Agile Quality Control Framework IT Forfeiture Of Poorquality Projects Structure PDF
This slide highlights the companys year over year financial statistics covering details about the loss incur, revenue generated, and expenses made. Deliver an awe inspiring pitch with this creative agile quality control framework it forfeiture of poorquality projects structure pdf bundle. Topics like software, developed, financial, revenue, expense can be discussed with this completely editable template. It is available for immediate download depending on the needs and requirements of the user.

Accrual Accounting Principles Ppt Powerpoint Shapes
This is a accrual accounting principles ppt powerpoint shapes. This is a four stage process. The stages in this process are provides and more accurate financial picture, revenue when customer has ownership, cost are incurred, accrual accounting.

Formulating Procurement Strategy Ppt PowerPoint Presentation Styles Gallery
This is a formulating procurement strategy ppt powerpoint presentation styles gallery. This is a six stage process. The stages in this process are formulating procurement strategy, operations, financial data, procurement strategy, revenue impact.

Roi Strategies Diagram Powerpoint Slide Themes
This is a roi strategies diagram powerpoint slide themes. This is a eight stage process. The stages in this process are marketing, investment, economy sale, profits, asset, revenue mechanism, price, cost and capital.

Social Media Business Goals Objectives Powerpoint Slides
This is a social media business goals objectives powerpoint slides. This is a six stage process. The stages in this process are innovation, brand health, marketing optimization, revenue generation, operational efficiency, customer experience, business goals.

B2b Marketing Strategy Sample Diagram Ppt Example
This is a b2b marketing strategy sample diagram ppt example. This is a six stage process. The stages in this process are customer retention strategy, web strategy, lead to revenue strategy, content strategy, lead generation strategy, social media strategy.

Business Model Innovation Segments Ppt PowerPoint Presentation Gallery Infographics
This is a business model innovation segments ppt powerpoint presentation gallery infographics. This is a three stage process. The stages in this process are revenue model innovation, customer model innovation, organizational model innovation, business model innovation.

The Strategy Of Innovation Ppt PowerPoint Presentation Pictures Show
This is a the strategy of innovation ppt powerpoint presentation pictures show. This is a three stage process. The stages in this process are value proposition, revenue model, value chain.

Strategic Objectives Perspective Presentation Design
This is a strategic objectives perspective presentation design. This is a four stage process. The stages in this process are strategic objectives perspective, build high performance products, improve cost efficiency, increase revenue growth.

Business Model Framework Powerpoint Guide
This is a business model framework powerpoint guide. This is a five stage process. The stages in this process are channels, key resources, key partners, key activities, value propositions, customer relationships, customer segments, cost structure, revenue streams.

Business Model Template 3 Ppt PowerPoint Presentation Guide
This is a business model template 3 ppt powerpoint presentation guide. This is a five stage process. The stages in this process are cost structure, revenue streams, key activities, key partners, key resources, key propositions, customer relationships, customer segments.

Manufacturing Schedule Cycle Diagram Ppt Sample
This is a manufacturing schedule cycle diagram ppt sample. This is a six stage process. The stages in this process are delivery product on time, satisfy customer, improve customer retention, increase sales, drive revenue growth, deliver profit.

Manufacturing Schedule Cycle Diagram Sample
This is a manufacturing schedule cycle diagram sample. This is a six stage process. The stages in this process are delivery product on time, satisfy customer, improve customer retention, increase sales, drive revenue growth, deliver profit.

Advertising Online Example Ppt Presentation
This is a advertising online example ppt presentation. This is a six stage process. The stages in this process are business strategy, constraints, revenue and profit, product design, user experience, technology.
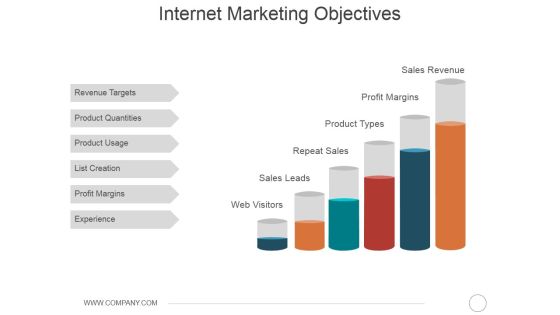
Internet Marketing Objectives Ppt PowerPoint Presentation Portfolio Summary
This is a internet marketing objectives ppt powerpoint presentation portfolio summary. This is a six stage process. The stages in this process are revenue targets, product quantities, product usage, list creation, profit margins, experience.

Cost Reductions Powerpoint Slide Background Image
This is a cost reductions powerpoint slide background image. This is a five stage process. The stages in this process are cost reductions, business analytics, payment reform, capital access, revenue cycle.
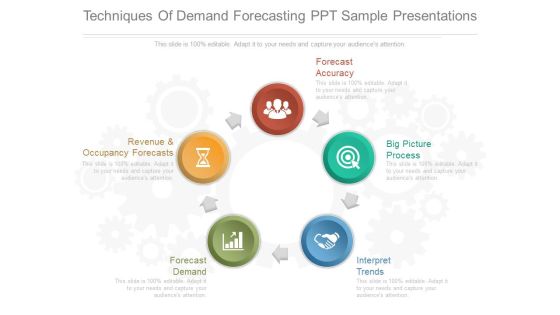
Techniques Of Demand Forecasting Ppt Sample Presentations
This is a techniques of demand forecasting ppt sample presentations. This is a five stage process. The stages in this process are revenue and occupancy forecasts, forecast accuracy, big picture process, interpret trends, forecast demand.

External Partner Activities Done Powerpoint Slide Designs
This is an external partner activities done powerpoint slide designs. This is a five stage process. The stages in this process are external partner activities done, customer relationships, customer segments, cost structure, revenue streams.

Direct And Partner Sales Force Powerpoint Guide
This is a direct and partner sales force powerpoint guide. This is a four stage process. The stages in this process are ptc business model future, direct and partner sales force, ptc revenue model, supply funnel.

Business Partners Presentation Powerpoint Example
This is a business partners presentation powerpoint example. This is a four stage process. The stages in this process are business partners, increased customer base, market segment and expansion, pricing and revenue increments.

Competitive Strategy Presentation Background Images
This is a competitive strategy presentation background images. This is a six stage process. The stages in this process are revenue model, value chain structure, market segments, value proposition, growth strategies, competitive strategy.

Sales Pipeline Planning Model Diagram Ppt Sample
This is a sales pipeline planning model diagram ppt sample. This is a one stage process. The stages in this process are revenue target, key assumption, sales pipeline contribution, sales, marketing, partners, sales development reps.

Strategic Planning Powerpoint Template
This is a strategic planning powerpoint template. This is a seven stage process. The stages in this process are strategic planning, business development, general counsel, customer experience, marketing optimization, revenue generation, operational efficiency.


 Continue with Email
 Sign up for an account
 Home
Home