Revenue Management
Website Performance Review Template 2 Ppt PowerPoint Presentation Icon Master Slide
This is a website performance review template 2 ppt powerpoint presentation icon master slide. This is a three stage process. The stages in this process are cost, visits, conversion rate.
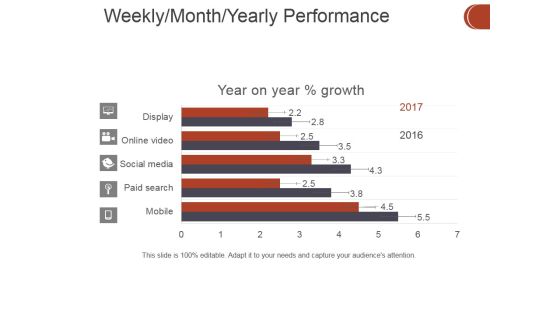
Weekly Month Yearly Performance Ppt PowerPoint Presentation Ideas Maker
This is a weekly month yearly performance ppt powerpoint presentation ideas maker. This is a five stage process. The stages in this process are business, finance, marketing, strategy, analysis, investment.

Current Staff Profile Years Of Experience Ppt PowerPoint Presentation Shapes
This is a current staff profile years of experience ppt powerpoint presentation shapes. This is a four stage process. The stages in this process are staff types, percentage of staff, least experience, years.

External Analysis Trends In Public Sector Employment Ppt PowerPoint Presentation Slides Templates
This is a external analysis trends in public sector employment ppt powerpoint presentation slides templates. This is a seven stage process. The stages in this process are percentage, growth, business, marketing, strategy.

Gap Between Current And Required Staff Ppt PowerPoint Presentation Ideas Format Ideas
This is a gap between current and required staff ppt powerpoint presentation ideas format ideas. This is a five stage process. The stages in this process are number of staff, category, current, graph, finance.
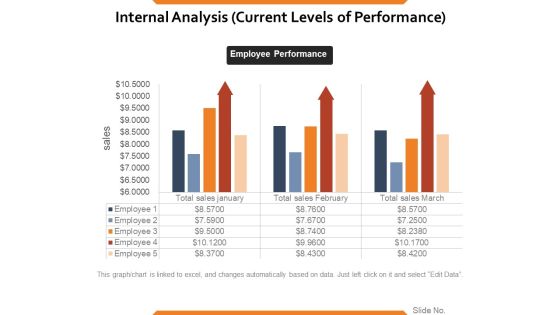
Internal Analysis Current Levels Of Performance Ppt PowerPoint Presentation Ideas Vector
This is a internal analysis current levels of performance ppt powerpoint presentation ideas vector. This is a three stage process. The stages in this process are sales, employee performance, business, finance, marketing.
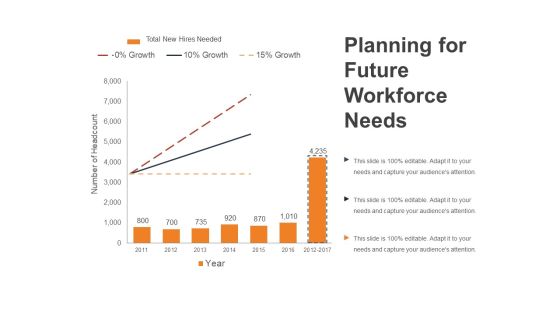
Planning For Future Workforce Needs Ppt PowerPoint Presentation Outline Smartart
This is a planning for future workforce needs ppt powerpoint presentation outline smartart. This is a three stage process. The stages in this process are growth, percentage, number of headcount, year, finance.

Area Chart Ppt PowerPoint Presentation Slides Rules
This is a area chart ppt powerpoint presentation slides rules. This is a two stage process. The stages in this process are sales in percentage, business, marketing, product, finance.

Bar Graph Ppt PowerPoint Presentation Portfolio Example
This is a bar graph ppt powerpoint presentation portfolio example. This is a three stage process. The stages in this process are sales in percentage, year, business, product, business, graph.

Bubble Chart Ppt PowerPoint Presentation Icon Slides
This is a bubble chart ppt powerpoint presentation icon slides. This is a three stage process. The stages in this process are product, finance, business, marketing, bubble chart .

Marketing Assessment Ppt PowerPoint Presentation Gallery Guidelines
This is a marketing assessment ppt powerpoint presentation gallery guidelines. This is a five stage process. The stages in this process are target market, forecasting of sales volume, indication of product positioning,, competitor reaction.

Area Stacked Ppt PowerPoint Presentation Diagram Images
This is a area stacked ppt powerpoint presentation diagram images. This is a two stage process. The stages in this process are sales in percentage, product, business, marketing, finance.

Clustered Column Line Ppt PowerPoint Presentation Infographics Templates
This is a clustered column line ppt powerpoint presentation infographics templates. This is a three stage process. The stages in this process are in percentage, business, marketing, product, finance, graph.

Clustered Column Ppt PowerPoint Presentation Slides Ideas
This is a clustered column ppt powerpoint presentation slides ideas. This is a two stage process. The stages in this process are sales in percentage, business, marketing, finance, graph.

High Low Close Chart Ppt PowerPoint Presentation Ideas Brochure
This is a high low close chart ppt powerpoint presentation ideas brochure. This is a three stage process. The stages in this process are in percentage, product, business, marketing, finance.

Line Chart Ppt PowerPoint Presentation Professional Ideas
This is a line chart ppt powerpoint presentation professional ideas. This is a two stage process. The stages in this process are in percentage, product, business, marketing, finance, percentage.
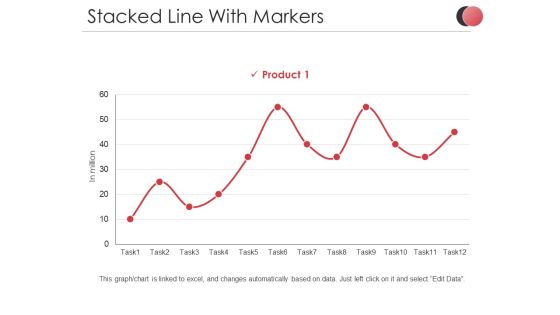
Stacked Line With Markers Ppt PowerPoint Presentation Slides Demonstration
This is a stacked line with markers ppt powerpoint presentation slides demonstration. This is a one stage process. The stages in this process are in million, product, percentage, business, marketing, finance.

Demand Forecasting Ppt PowerPoint Presentation Outline Model
This is a demand forecasting ppt powerpoint presentation outline model. This is a one stage process. The stages in this process are demand quality, dynamic demand, stable demand, trend, finance.
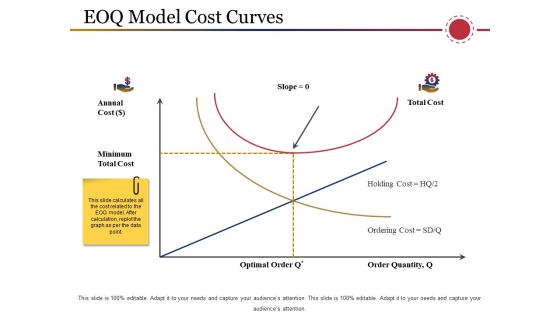
Eoq Model Cost Curves Ppt PowerPoint Presentation Infographics Background Image
This is a eoq model cost curves ppt powerpoint presentation infographics background image. This is a four stage process. The stages in this process are annual cost , minimum, optimal order , order quantity, business, finance.
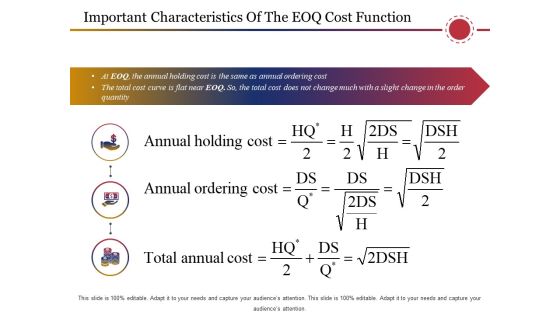
Important Characteristics Of The Eoq Cost Function Ppt PowerPoint Presentation Infographic Template Maker
This is a important characteristics of the eoq cost function ppt powerpoint presentation infographic template maker. This is a three stage process. The stages in this process are icons, business, marketing, finance.

Logistics And It Ppt PowerPoint Presentation Show Vector
This is a logistics and it ppt powerpoint presentation show vector. This is a three stage process. The stages in this process are transportation medium, transportation challenges, finance, business, marketing.
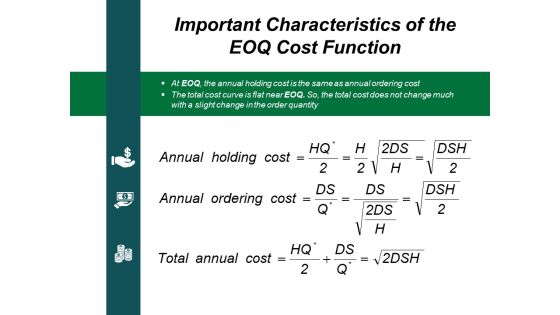
Important Characteristics Of The Eoq Cost Function Ppt PowerPoint Presentation Gallery Slide Download
This is a important characteristics of the eoq cost function ppt powerpoint presentation gallery slide download. This is a three stage process. The stages in this process are icons, business, marketing, finance, strategy.

Stacked Column Ppt PowerPoint Presentation Infographics Samples
This is a stacked column ppt powerpoint presentation infographics samples. This is a two stage process. The stages in this process are product, sales in percentage, business, marketing, graph.
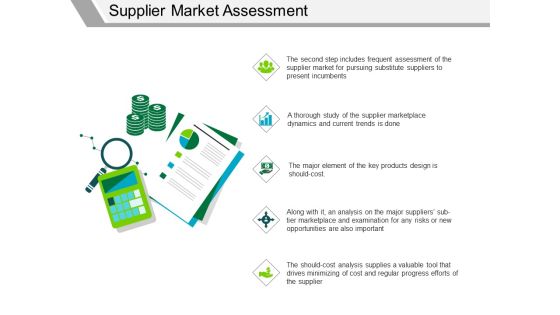
Supplier Market Assessment Ppt PowerPoint Presentation Visual Aids Slides
This is a supplier market assessment ppt powerpoint presentation visual aids slides. This is a five stage process. The stages in this process are finance, marketing, icons, business, strategy.
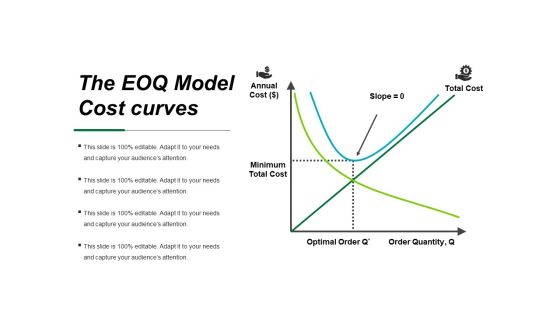
The Eoq Model Cost Curves Ppt PowerPoint Presentation Layouts Portfolio
This is a the eoq model cost curves ppt powerpoint presentation layouts portfolio. This is a two stage process. The stages in this process are minimum, annual, lope, total cost, order, optimal.

Stock Chart Ppt PowerPoint Presentation Outline Graphics Example
This is a stock chart ppt powerpoint presentation outline graphics example. This is a five stage process. The stages in this process are close, volume, low, high, open, product.
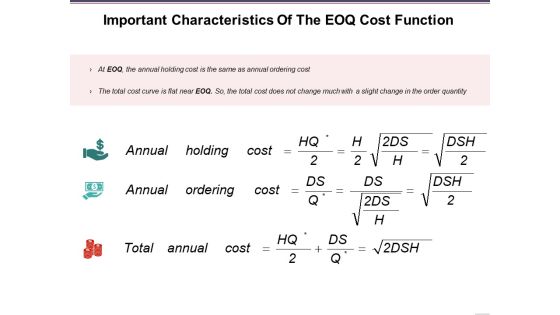
Important Characteristics Of The Eoq Cost Function Ppt PowerPoint Presentation Show Slides
This is a important characteristics of the eoq cost function ppt powerpoint presentation show slides. This is a three stage process. The stages in this process are icons, business, marketing, finance, strategy.

Sales Forecasting Template 2 Ppt PowerPoint Presentation Infographic Template Examples
This is a sales forecasting template 2 ppt powerpoint presentation infographic template examples. This is a two stage process. The stages in this process are forecasting, business, marketing, finance, graph.

Scatter Bubble Chart Ppt PowerPoint Presentation Infographic Template Examples
This is a scatter bubble chart ppt powerpoint presentation infographic template examples. This is a two stage process. The stages in this process are highest sale, product, in price, finance, business.

Competitor Analysis Graph Ppt PowerPoint Presentation Slides Elements
This is a competitor analysis graph ppt powerpoint presentation slides elements. This is a five stage process. The stages in this process are bar graph, finance, marketing, strategy, business.
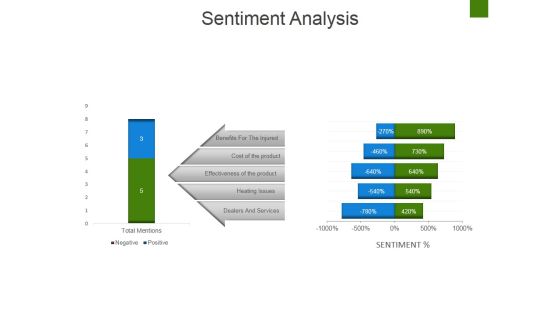
Sentiment Analysis Ppt PowerPoint Presentation Diagram Ppt
This is a sentiment analysis ppt powerpoint presentation diagram ppt. This is a two stage process. The stages in this process are benefits for the injured, cost of the product, effectiveness of the product, heating issues, dealers and services.

Area Chart Ppt PowerPoint Presentation Summary Objects
This is a area chart ppt powerpoint presentation summary objects. This is a two stage process. The stages in this process are product, sales in percentage, finance, business, marketing.

Bar Graph Template 2 Ppt PowerPoint Presentation Ideas Files
This is a bar graph template 2 ppt powerpoint presentation ideas files. This is a five stage process. The stages in this process are in percentage, business, marketing, finance, graph.
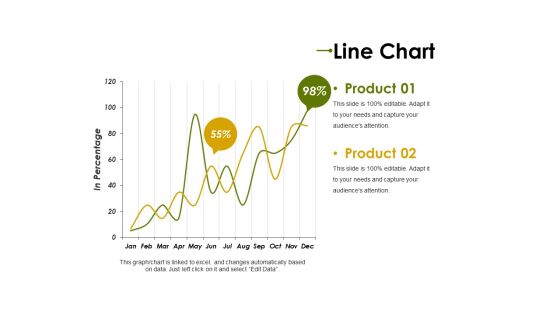
Line Chart Ppt PowerPoint Presentation Professional Clipart Images
This is a line chart ppt powerpoint presentation professional clipart images. This is a two stage process. The stages in this process are product, in percentage, graph, percentage, finance, business.
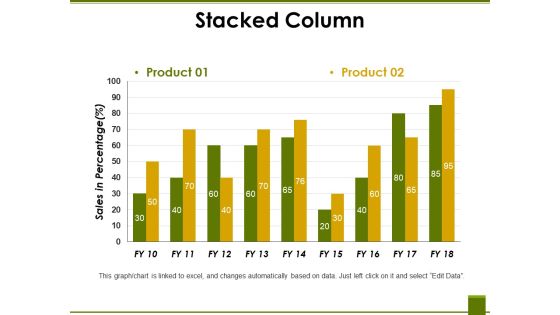
Stacked Column Ppt PowerPoint Presentation Professional Vector
This is a stacked column ppt powerpoint presentation professional vector. This is a two stage process. The stages in this process are product, sales in percentage, business, marketing, graph.

Stacked Line Ppt PowerPoint Presentation Infographic Template Graphics Template
This is a stacked line ppt powerpoint presentation infographic template graphics template. This is a three stage process. The stages in this process are product, in percentage, business, marketing, finance.

Bar Chart Ppt PowerPoint Presentation Layouts Pictures
This is a bar chart ppt powerpoint presentation layouts pictures. This is a three stage process. The stages in this process are bar graph, product, sales in percentage, business, marketing.

Bar Graph Ppt PowerPoint Presentation Gallery Grid
This is a bar graph ppt powerpoint presentation gallery grid. This is a three stage process. The stages in this process are sales in percentage, product, finance, business, marketing.
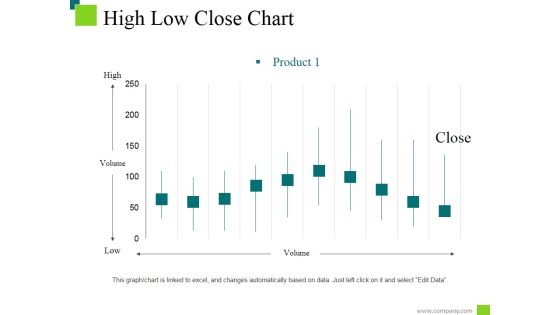
High Low Close Chart Ppt PowerPoint Presentation Styles Information
This is a high low close chart ppt powerpoint presentation styles information. This is a ten stage process. The stages in this process are low, high, product, volume, close.
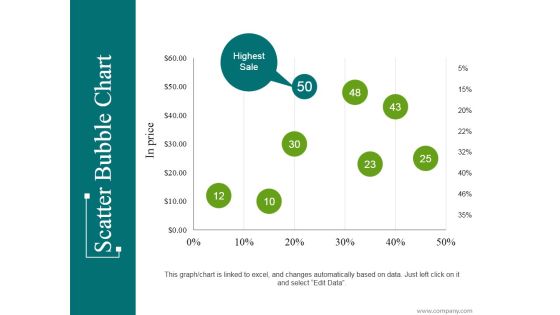
Scatter Bubble Chart Ppt PowerPoint Presentation Infographic Template Introduction
This is a scatter bubble chart ppt powerpoint presentation infographic template introduction. This is a eight stage process. The stages in this process are highest sale, business, marketing, percentage, finance.

Area Chart Ppt PowerPoint Presentation Show Templates
This is a area chart ppt powerpoint presentation show templates. This is a two stage process. The stages in this process are product, in percentage, in years, finance, graph.

Bar Chart Ppt PowerPoint Presentation Outline Guidelines
This is a bar chart ppt powerpoint presentation outline guidelines. This is a four stage process. The stages in this process are product, unit count, in years, graph, finance, business.
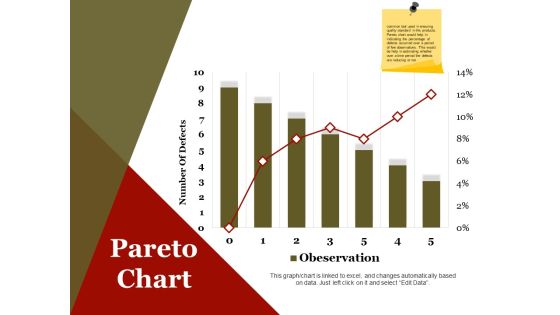
Pareto Chart Ppt PowerPoint Presentation Infographics Design Inspiration
This is a pareto chart ppt powerpoint presentation infographics design inspiration. This is a seven stage process. The stages in this process are number of defects, business, marketing, finance.

4 Quarter Track Record Template Ppt PowerPoint Presentation Model Graphics Download
This is a 4 quarter track record template ppt powerpoint presentation model graphics download. This is a four stage process. The stages in this process are business, marketing, strategy, planning, finance.
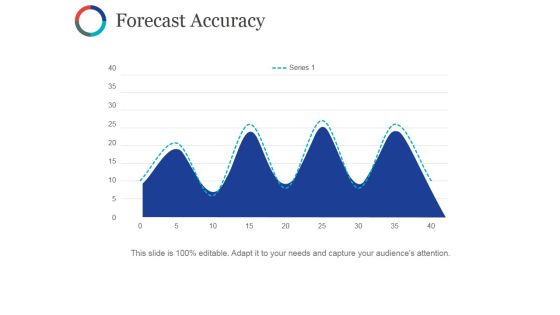
Forecast Accuracy Template Ppt PowerPoint Presentation Styles Format Ideas
This is a forecast accuracy template ppt powerpoint presentation styles format ideas. This is a four stage process. The stages in this process are business, marketing, strategy, graph, planning.
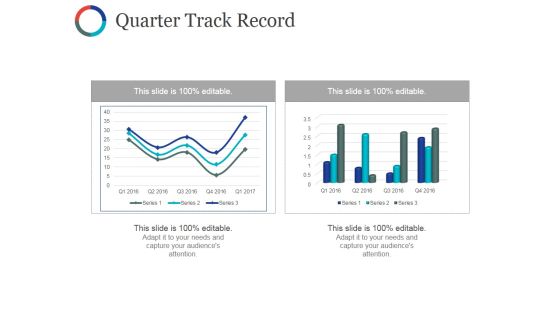
Quarter Track Record Ppt PowerPoint Presentation Professional Layout Ideas
This is a quarter track record ppt powerpoint presentation professional layout ideas. This is a two stage process. The stages in this process are business, marketing, finance, graph, plan.
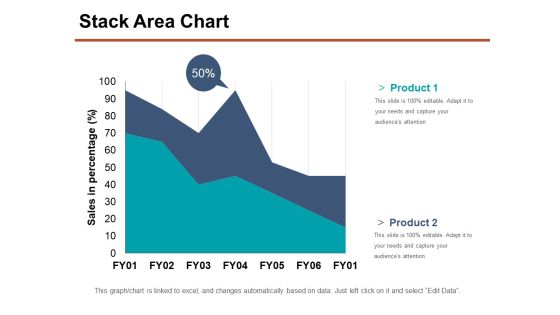
Stack Area Chart Ppt PowerPoint Presentation Show Samples
This is a stack area chart ppt powerpoint presentation show samples. This is a two stage process. The stages in this process are product, sales in percentage, business, marketing, percentage.

High Low Close Chart Ppt PowerPoint Presentation Layouts Objects
This is a high low close chart ppt powerpoint presentation layouts objects. This is a five stage process. The stages in this process are high, volume, low, business, marketing.

Cost Of Quality Template 2 Ppt PowerPoint Presentation Slides Design Inspiration
This is a cost of quality template 2 ppt powerpoint presentation slides design inspiration. This is a four stage process. The stages in this process are prevention cost, appraisal cost, internal failure cost, external failure cost.
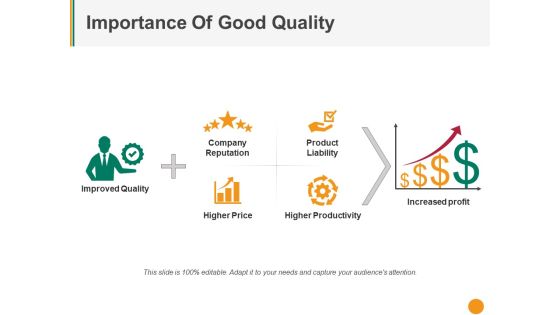
Importance Of Good Quality Ppt PowerPoint Presentation Example 2015
This is a importance of good quality ppt powerpoint presentation example 2015. This is a six stage process. The stages in this process are company reputation, product liability, higher productivity, higher price, improved quality.
Open High Low Close Ppt PowerPoint Presentation Icon Model
This is a open high low close ppt powerpoint presentation icon model. This is a five stage process. The stages in this process are high, low, product, business, finance.
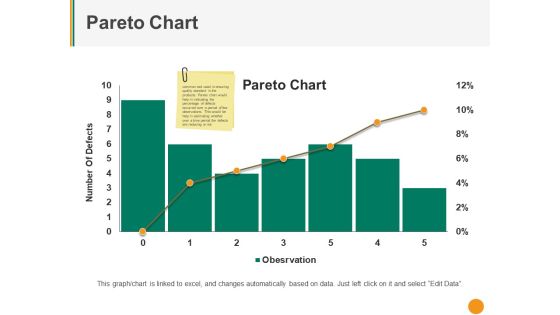
Pareto Chart Ppt PowerPoint Presentation Inspiration Master Slide
This is a pareto chart ppt powerpoint presentation inspiration master slide. This is a six stage process. The stages in this process are number of defects, pareto chart, finance, business, graph.

Clustered Bar Ppt PowerPoint Presentation Show Slide Portrait
This is a clustered bar ppt powerpoint presentation show slide portrait. This is a four stage process. The stages in this process are product, unit count, graph, business, marketing.

Pareto Chart Ppt PowerPoint Presentation File Infographic Template
This is a pareto chart ppt powerpoint presentation file infographic template. This is a six stage process. The stages in this process are number of defects, business, marketing, graph.
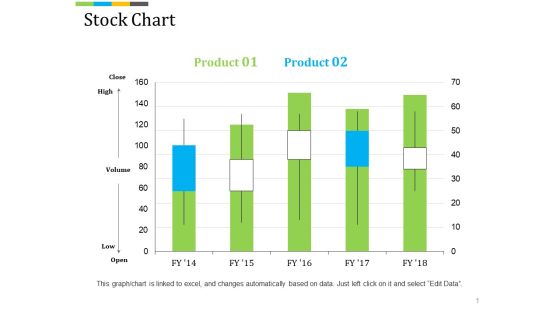
Stock Chart Ppt PowerPoint Presentation Professional Background Image
This is a stock chart ppt powerpoint presentation professional background image. This is a five stage process. The stages in this process are high, volume, low, finance, business, marketing.

Clustered Column Ppt PowerPoint Presentation Infographic Template Background Designs
This is a clustered column ppt powerpoint presentation infographic template background designs. This is a two stage process. The stages in this process are sales in percentage, bar, business, marketing, planning.

Volume Open High Low Close Chart Ppt PowerPoint Presentation Ideas Graphics Example
This is a volume open high low close chart ppt powerpoint presentation ideas graphics example. This is a five stage process. The stages in this process are business, bar graph, stock, cost, market.

Stock Chart Ppt PowerPoint Presentation Summary File Formats
This is a stock chart ppt powerpoint presentation summary file formats. This is a five stage process. The stages in this process are high, volume, low, business, graph, finance.
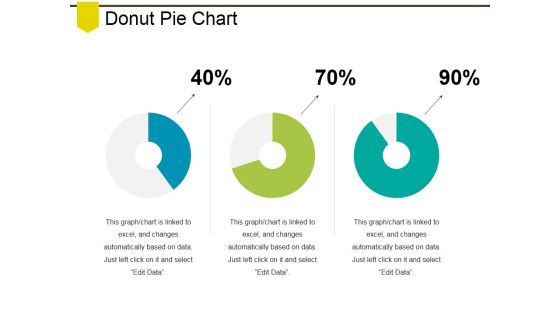
Donut Pie Chart Ppt PowerPoint Presentation File Example Introduction
This is a donut pie chart ppt powerpoint presentation file example introduction. This is a three stage process. The stages in this process are business, marketing, finance, planning, analysis.

Sponsorship Opportunities Template 4 Ppt PowerPoint Presentation Design Ideas
This is a sponsorship opportunities template 4 ppt powerpoint presentation design ideas. This is a one stage process. The stages in this process are benefits, presenting sponsor, business, planning.
 Home
Home