Revenue Management

Financial Report Of An IT Firm Future Opportunities For The Company Topics PDF
The slide provides the key future opportunities for the company such as workplace transformation, growing demand for AI and cloud based services, innovations in gaming sector etc.This is a Financial Report Of An IT Firm Future Opportunities For The Company Topics PDF template with various stages. Focus and dispense information on seven stages using this creative set, that comes with editable features. It contains large content boxes to add your information on topics like Opportunities Businesses, Gaming Experiences, Interpreting Needs You can also showcase facts, figures, and other relevant content using this PPT layout. Grab it now.

Evaluating Financial Position Of E Commerce Company Ecommerce Clothing Retail Company Description Clipart PDF
This slide provides an overview of the apparel firm. It includes companys mission, vision, principles and highlights that covers headquarter, employees, valuation, business model, website, email, etc. From laying roadmaps to briefing everything in detail, our templates are perfect for you. You can set the stage with your presentation slides. All you have to do is download these easy to edit and customizable templates. Evaluating Financial Position Of E Commerce Company Ecommerce Clothing Retail Company Description Clipart PDF will help you deliver an outstanding performance that everyone would remember and praise you for. Do download this presentation today.

Evaluating Financial Position Of E Commerce Company Steps To Develop E Commerce Marketing Plan Download PDF
The Evaluating Financial Position Of E Commerce Company Steps To Develop E Commerce Marketing Plan Download PDF is a compilation of the most recent design trends as a series of slides. It is suitable for any subject or industry presentation, containing attractive visuals and photo spots for businesses to clearly express their messages. This template contains a variety of slides for the user to input data, such as structures to contrast two elements, bullet points, and slides for written information. Slidegeeks is prepared to create an impression.

Evaluating Financial Position Of E Commerce Company Video Marketing To Convert Warm Leads Information PDF
This slide provides an overview of video marketing strategy. It includes impact and steps which are attract, engage, convert and delight. Slidegeeks has constructed Evaluating Financial Position Of E Commerce Company Video Marketing To Convert Warm Leads Information PDF after conducting extensive research and examination. These presentation templates are constantly being generated and modified based on user preferences and critiques from editors. Here, you will find the most attractive templates for a range of purposes while taking into account ratings and remarks from users regarding the content. This is an excellent jumping off point to explore our content and will give new users an insight into our top notch PowerPoint Templates.

Remuneration Strategy For Accounting Executive Compensation Mix Ppt Inspiration Gallery PDF
The following slide highlights the commission scheme for Accounting executive with compensation mix. It depicts position, reporting, on target earning, base salary, commission scheme, rate, commission gap, seniority, quota, compensation mix and sales incentive. Presenting Remuneration Strategy For Accounting Executive Compensation Mix Ppt Inspiration Gallery PDF to dispense important information. This template comprises four stages. It also presents valuable insights into the topics including Positions, Commission, Target Pay. This is a completely customizable PowerPoint theme that can be put to use immediately. So, download it and address the topic impactfully.

Risk Return Plot Ppt PowerPoint Presentation Background Images
This is a risk return plot ppt powerpoint presentation background images. This is a nine stage process. The stages in this process are annualized return, annualized standard deviation.
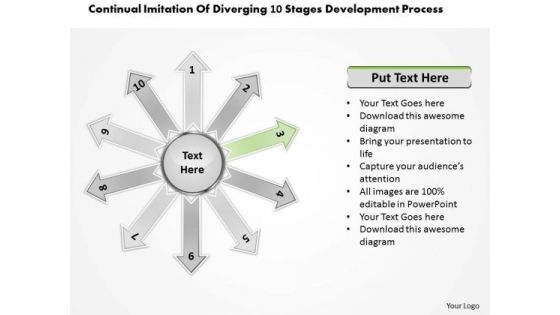
Of Diverging 10 Stages Development Process Circular Chart PowerPoint Templates
We present our of diverging 10 stages development process Circular Chart PowerPoint templates.Use our Communication PowerPoint Templates because it explains the goals of each team and how you intend for each slice to contribute to the entire cake. Present our Arrows PowerPoint Templates because analyse your plans with equal sincerity. Use our Signs PowerPoint Templates because they have always been a source of inspiration for us all. Download and present our Business PowerPoint Templates because you have had your share of being a goldfish in a small bowl.you are ready to launch out and spread your wings. Present our Process and Flows PowerPoint Templates because they will Amplify your thoughts via our appropriate templates.Use these PowerPoint slides for presentations relating to Abstract, Arrow, Background, Buttons, Circle, Clean, Communication, Concept, Conceptual, Design, Diagram, Direction, Elements, Exchange, Flow, Flowchart, Graph, Graphic, Icon, Illustration, Internet, Precise, Process, Red, Sign, Symbol, Template. The prominent colors used in the PowerPoint template are Green, Gray, Black. Use our of diverging 10 stages development process Circular Chart PowerPoint templates are Magnificent. We assure you our Background PowerPoint templates and PPT Slides are Romantic. People tell us our of diverging 10 stages development process Circular Chart PowerPoint templates are Sparkling. PowerPoint presentation experts tell us our Buttons PowerPoint templates and PPT Slides are Magical. PowerPoint presentation experts tell us our of diverging 10 stages development process Circular Chart PowerPoint templates provide great value for your money. Be assured of finding the best projection to highlight your words. Use our Background PowerPoint templates and PPT Slides are Ritzy.

Adjusting Financial Strategies And Planning Analyzing Selected Investment Portfolio With Net Return Information PDF
This slide provides glimpse about analysis of selected investment portfolio that can help our business in tracking of our investment. It includes annualized gross return, annualized standard deviation, amount, expected ROI, etc. Formulating a presentation can take up a lot of effort and time, so the content and message should always be the primary focus. The visuals of the PowerPoint can enhance the presenters message, so our Adjusting Financial Strategies And Planning Analyzing Selected Investment Portfolio With Net Return Information PDF was created to help save time. Instead of worrying about the design, the presenter can concentrate on the message while our designers work on creating the ideal templates for whatever situation is needed. Slidegeeks has experts for everything from amazing designs to valuable content, we have put everything into Adjusting Financial Strategies And Planning Analyzing Selected Investment Portfolio With Net Return Information PDF

Determining The Competitors Portfolio Characteristic And Markets They Serve Microsoft PDF
This slide shows the various dimensions for measuring the success of the project XYZ such as profit efficiency, impact on consumers, business success, preparation for the future, etc.Presenting Efficient Ways For Successful Project Administration Dimensions Of Success Related To Project Rules PDF to provide visual cues and insights. Share and navigate important information on five stages that need your due attention. This template can be used to pitch topics like Project Efficiency, Impact On Consumer, Business Success In addtion, this PPT design contains high resolution images, graphics, etc, that are easily editable and available for immediate download.

Impact Of Diversity And Inclusion Factors On Organization Performance Pictures PDF
This slide covers the graphical representation of diversity and inclusion impact of organizational performance in the form of employee retention, customer satisfaction, innovation level and improvement in financial performance. Welcome to our selection of the Impact Of Diversity And Inclusion Factors On Organization Performance Pictures PDF. These are designed to help you showcase your creativity and bring your sphere to life. Planning and Innovation are essential for any business that is just starting out. This collection contains the designs that you need for your everyday presentations. All of our PowerPoints are 100 percent editable, so you can customize them to suit your needs. This multi-purpose template can be used in various situations. Grab these presentation templates today
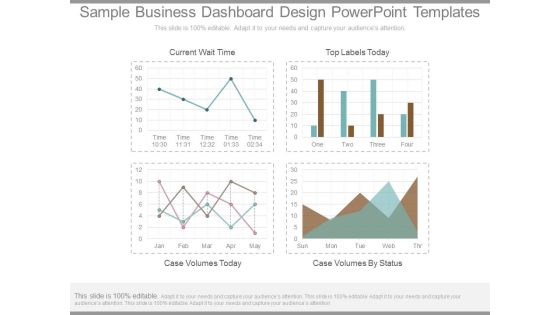
Sample Business Dashboard Design Powerpoint Templates
This is a sample business dashboard design powerpoint templates. This is a four stage process. The stages in this process are current wait time, top labels today, case volumes today, case volumes by status.
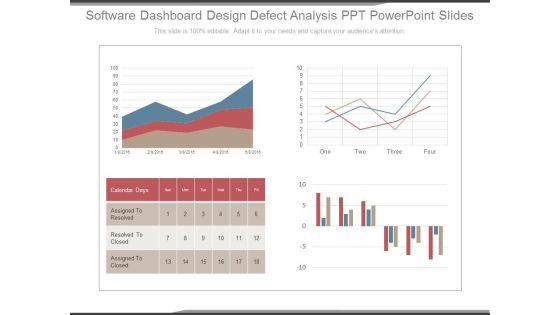
Software Dashboard Design Defect Analysis Ppt Powerpoint Slides
This is a software dashboard design defect analysis ppt powerpoint slides. This is a four stage process. The stages in this process are calendar days, assigned to resolved, resolved to closed, assigned to closed.

Break Point Chart For Quality Analysis Powerpoint Slide Show
This is a break point chart for quality analysis powerpoint slide show. This is a one stage process. The stages in this process are total variable costs, fixed costs, quality sold.
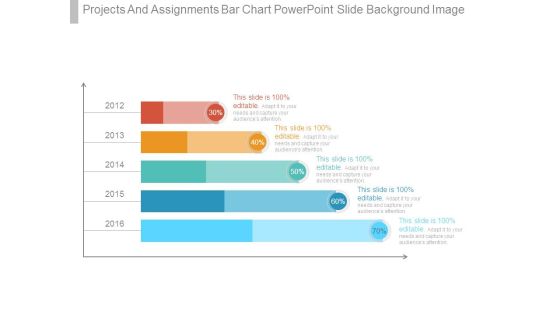
Projects And Assignments Bar Chart Powerpoint Slide Background Image
This is a projects and assignments bar chart powerpoint slide background image. This is a five stage process. The stages in this process are finance, presentation, business, strategy, marketing.

Business Strategy Marketing Plans And Strategies Ppt PowerPoint Presentation Complete Deck With Slides
This is a business strategy marketing plans and strategies ppt powerpoint presentation complete deck with slides. This is a one stage process. The stages in this process are business, marketing, finance, analysis, sales.

Adjusted Roce Template 1 Ppt PowerPoint Presentation Styles Background Designs
This is a adjusted roce template 1 ppt powerpoint presentation styles background designs. This is a seven stage process. The stages in this process are bar graph, finance, year, business, marketing.

Volume High Low Close Chart Ppt PowerPoint Presentation Gallery Shapes
This is a volume high low close chart ppt powerpoint presentation gallery shapes. This is a five stage process. The stages in this process are high, volume, low, close, finance.

High Low Close Chart Template 1 Ppt PowerPoint Presentation Infographics Graphics Design
This is a high low close chart template 1 ppt powerpoint presentation infographics graphics design. This is a five stage process. The stages in this process are close, high, volume, low, open, product.
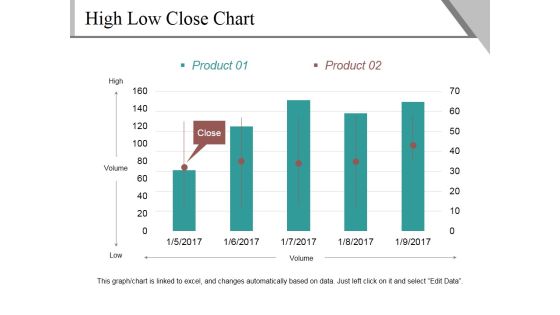
High Low Close Chart Template 2 Ppt PowerPoint Presentation Outline Show
This is a high low close chart template 2 ppt powerpoint presentation outline show. This is a five stage process. The stages in this process are high, volume, low, close, product.

Clustered Column Line Ppt PowerPoint Presentation Slide
This is a clustered column line ppt powerpoint presentation slide. This is a three stage process. The stages in this process are bar graph, growth, finance, product, sales in percentage.

Brand Tracking Info Graphics Ppt PowerPoint Presentation Infographics Slides
This is a brand tracking info graphics ppt powerpoint presentation infographics slides. This is a four stage process. The stages in this process are of consumers read, trust online reviews, user generated, look to online.
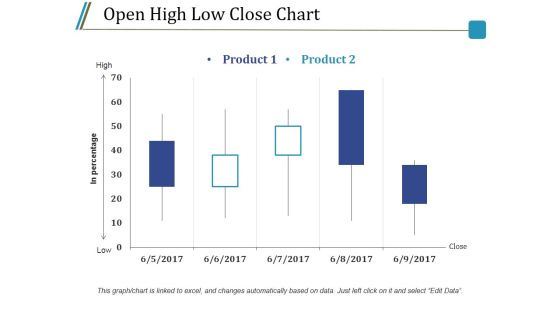
Open High Low Close Chart Ppt PowerPoint Presentation Styles Model
This is a open high low close chart ppt powerpoint presentation styles model. This is a five stage process. The stages in this process are product, high, low, in percentage, close.

Clustered Column Line Ppt PowerPoint Presentation Inspiration Guidelines
This is a clustered column line ppt powerpoint presentation inspiration guidelines. This is a three stage process. The stages in this process are product, sales in percentage, graph, line, finance, business.

Bridge Transition Model Ppt PowerPoint Presentation Gallery Infographics
This is a bridge transition model ppt powerpoint presentation gallery infographics. This is a four stage process. The stages in this process are ending, transitions, new beginning, commitment, exploration.

Stock Chart Template 2 Ppt PowerPoint Presentation Infographic Template Styles
This is a stock chart template 2 ppt powerpoint presentation infographic template styles. This is a one stage process. The stages in this process are high, volume, low, product, volume.

Open High Low Close Chart Ppt PowerPoint Presentation Outline Rules
This is a open high low close chart ppt powerpoint presentation outline rules. This is a two stage process. The stages in this process are product, high, low, close, in percentage.
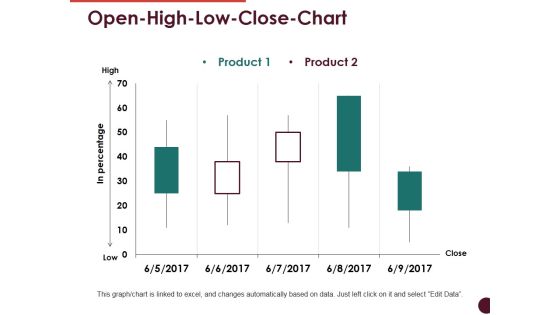
Open High Low Close Chart Ppt PowerPoint Presentation Professional Visuals
This is a open high low close chart ppt powerpoint presentation professional visuals. This is a two stage process. The stages in this process are high, low, in percentage, product, close.

Volume High Low Close Chart Ppt PowerPoint Presentation Infographics Good
This is a volume high low close chart ppt powerpoint presentation infographics good. This is a two stage process. The stages in this process are high, volume, low, product, close.
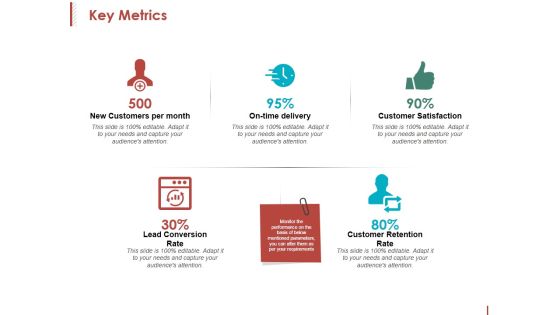
Key Metrics Ppt PowerPoint Presentation Inspiration Format
This is a key metrics ppt powerpoint presentation inspiration format. This is a five stage process. The stages in this process are new customers per month, on time delivery, customer satisfaction, customer retention rate.
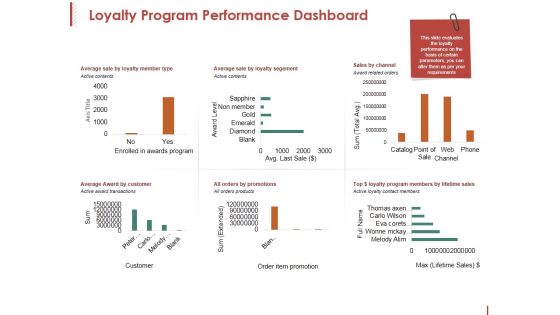
Loyalty Program Performance Dashboard Ppt PowerPoint Presentation Pictures Clipart
This is a loyalty program performance dashboard ppt powerpoint presentation pictures clipart. This is a six stage process. The stages in this process are axis title, award level, sum, active contents, channel.
Sales Kpi Tracker Ppt PowerPoint Presentation Gallery Shapes
This is a sales kpi tracker ppt powerpoint presentation gallery shapes. This is a six stage process. The stages in this process are target growth, leads created, sales ratio, last year, stretched growth.

Cost Of Quality Four Cost Categories Ppt PowerPoint Presentation Portfolio Background Designs
This is a cost of quality four cost categories ppt powerpoint presentation portfolio background designs. This is a three stage process. The stages in this process are finance, business, analysis, marketing, strategy.
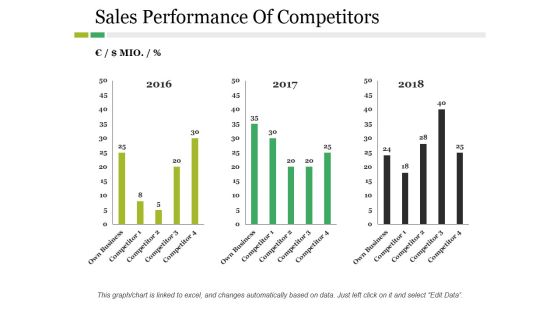
Sales Performance Of Competitors Ppt PowerPoint Presentation Inspiration Example
This is a sales performance of competitors ppt powerpoint presentation inspiration example. This is a three stage process. The stages in this process are business, marketing, year, bar graph, finance.
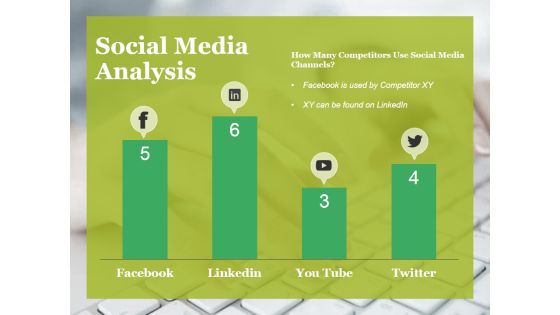
Social Media Analysis Ppt PowerPoint Presentation Infographics Samples
This is a social media analysis ppt powerpoint presentation infographics samples. This is a four stage process. The stages in this process are facebook, linkedin, twitter, you tube, social media.

Radar Chart Ppt PowerPoint Presentation Summary Design Templates
This is a radar chart ppt powerpoint presentation summary design templates. This is a two stage process. The stages in this process are radar chart, product, shapes, business, marketing.
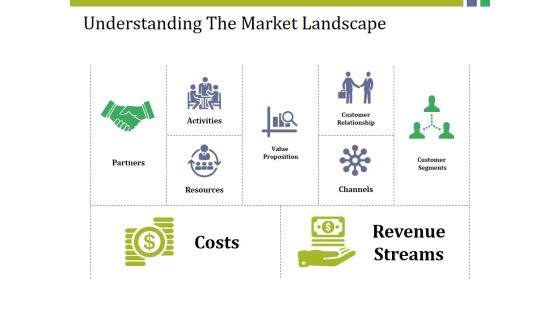
Understanding The Market Landscape Ppt PowerPoint Presentation Model Skills
This is a understanding the market landscape ppt powerpoint presentation model skills. This is a two stage process. The stages in this process are costs, resources, channels, partners, activities.

Financing Ppt PowerPoint Presentation Infographic Template Example Topics
This is a financing ppt powerpoint presentation infographic template example topics. This is a two stage process. The stages in this process are investment terms, valuation of the company.
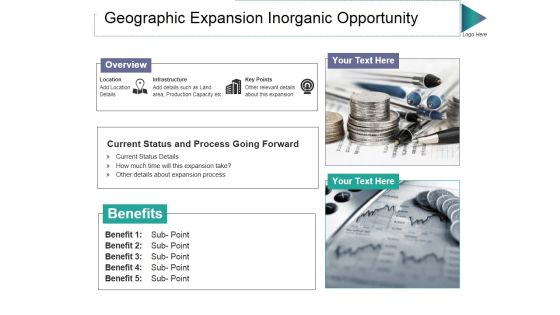
Geographic Expansion Inorganic Opportunity Ppt PowerPoint Presentation Pictures Maker
This is a geographic expansion inorganic opportunity ppt powerpoint presentation pictures maker. This is a two stage process. The stages in this process are overview, infrastructure, key points, location, benefits.
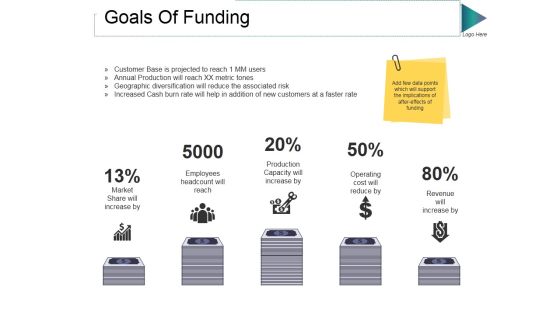
Goals Of Funding Ppt PowerPoint Presentation Summary Background Designs
This is a goals of funding ppt powerpoint presentation summary background designs. This is a five stage process. The stages in this process are finance, business, percentage, marketing, currency.
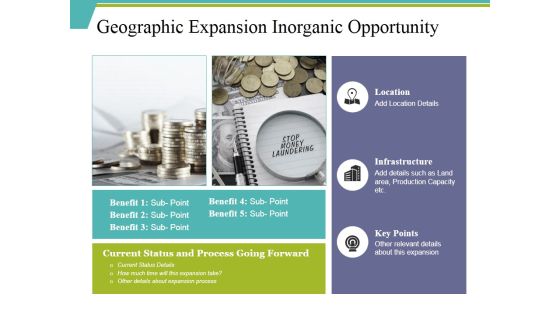
Geographic Expansion Inorganic Opportunity Ppt PowerPoint Presentation Ideas Example Introduction
This is a geographic expansion inorganic opportunity ppt powerpoint presentation ideas example introduction. This is a three stage process. The stages in this process are location, infrastructure, key points, benefit, sub point.

Competitors Average Price Product Ppt PowerPoint Presentation Icon Layout
This is a competitors average price product ppt powerpoint presentation icon layout. This is a five stage process. The stages in this process are company, bar graph, finance, business, marketing.

Radar Chart Ppt PowerPoint Presentation Inspiration Infographic Template
This is a radar chart ppt powerpoint presentation inspiration infographic template. This is a two stage process. The stages in this process are radar chart, product, business, finance, marketing.
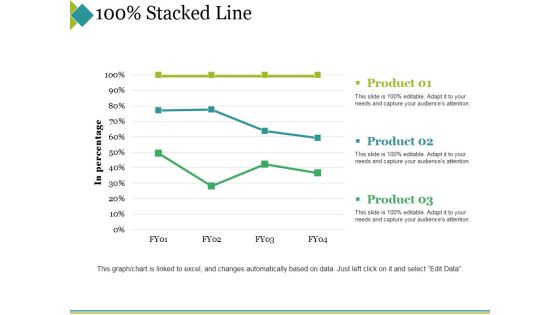
Stacked Line Ppt PowerPoint Presentation Professional Background Designs
This is a stacked line ppt powerpoint presentation professional background designs. This is a three stage process. The stages in this process are product, in percentage, stacked line, finance, business.

Radar Chart Ppt PowerPoint Presentation Infographics Visual Aids
This is a radar chart ppt powerpoint presentation infographics visual aids. This is a two stage process. The stages in this process are radar chart, product, finance, business, marketing.

Comparison Ppt PowerPoint Presentation Slides Structure
This is a comparison ppt powerpoint presentation slides structure. This is a three stage process. The stages in this process are pc users in, laptop users in, mobile users in, technology, years.
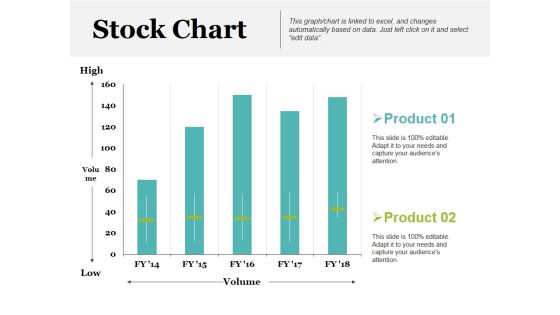
Stock Chart Ppt PowerPoint Presentation Inspiration Example Introduction
This is a stock chart ppt powerpoint presentation inspiration example introduction. This is a two stage process. The stages in this process are product, high, volume, low, stock chart.
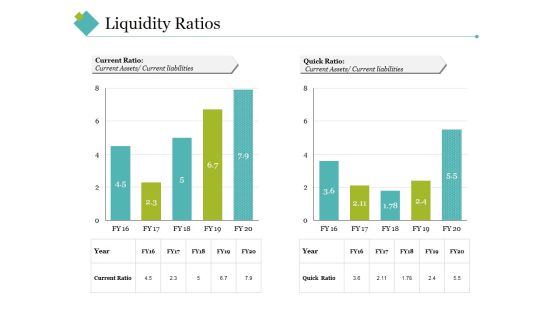
Liquidity Ratios Template 2 Ppt PowerPoint Presentation Gallery Vector
This is a liquidity ratios template 2 ppt powerpoint presentation gallery vector. This is a two stage process. The stages in this process are quick ratio, current ratio, current liabilities, current assets.
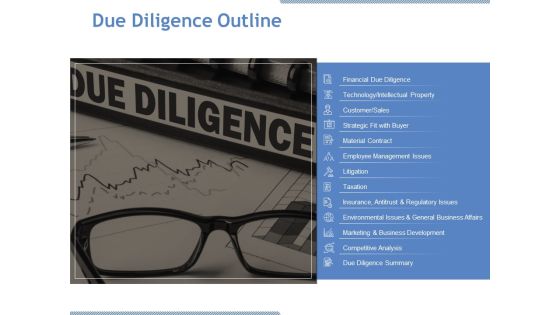
Due Diligence Outline Ppt PowerPoint Presentation Inspiration Gallery
This is a due diligence outline ppt powerpoint presentation inspiration gallery. This is a one stage process. The stages in this process are customer, material contract, litigation, taxation, competitive analysis.

Stacked Line Ppt PowerPoint Presentation Pictures Example Topics
This is a stacked line ppt powerpoint presentation pictures example topics. This is a three stage process. The stages in this process are product, in percentage, stacked line, business, marketing.

Cash Flow Statement Graphical Representation Ppt PowerPoint Presentation Ideas Graphic Tips
This is a cash flow statement graphical representation ppt powerpoint presentation ideas graphic tips. This is a four stage process. The stages in this process are operations, financing activities, investing activities, net increase in cash.
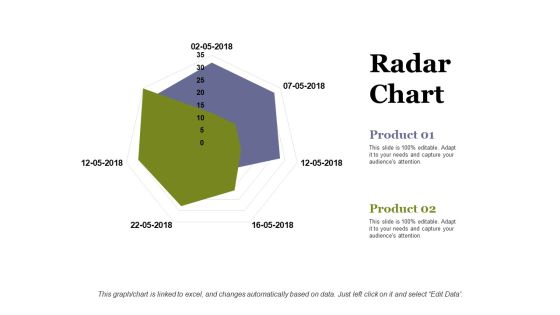
Radar Chart Ppt PowerPoint Presentation Infographic Template Information
This is a radar chart ppt powerpoint presentation infographic template information. This is a two stage process. The stages in this process are radar chart, product, business, marketing, shape.

Stacked Line Ppt PowerPoint Presentation Infographics Vector
This is a stacked line ppt powerpoint presentation infographics vector. This is a three stage process. The stages in this process are product, stacked line, business, marketing, in percentage.

Radar Chart Ppt PowerPoint Presentation Portfolio Graphics Template
This is a radar chart ppt powerpoint presentation portfolio graphics template. This is a two stage process. The stages in this process are product, finance, shape, radar chart, business.

Marketing Reach By Channels Ppt PowerPoint Presentation Styles Professional
This is a marketing reach by channels ppt powerpoint presentation styles professional. This is a six stage process. The stages in this process are top performing, non scalable, emails, print ads, inline media.

Radar Chart Ppt PowerPoint Presentation Professional Infographic Template
This is a radar chart ppt powerpoint presentation professional infographic template. This is a two stage process. The stages in this process are product, finance, shape, radar chart, business.
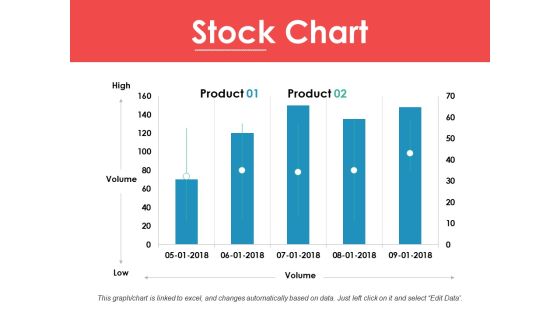
Stock Chart Ppt PowerPoint Presentation Ideas Infographic Template
This is a stock chart ppt powerpoint presentation ideas infographic template. This is a two stage process. The stages in this process are high, volume, low, product, stock chart.
Volume Open High Low Close Chart Ppt PowerPoint Presentation Icon Design Inspiration
This is a volume open high low close chart ppt powerpoint presentation icon design inspiration. This is a three stage process. The stages in this process are close, high, low, volume, open.

Open High Low Close Chart Ppt PowerPoint Presentation Professional Inspiration
This is a open high low close chart ppt powerpoint presentation professional inspiration. This is a five stage process. The stages in this process are high, low, close, business, finance.

Donut Pie Chart Ppt PowerPoint Presentation Show Graphics Download
This is a donut pie chart ppt powerpoint presentation show graphics download. This is a three stage process. The stages in this process are percentage, finance, donut, business, marketing.
Happy Woman With Dollars In Hand Ppt PowerPoint Presentation Icon Visuals
This is a happy woman with dollars in hand ppt powerpoint presentation icon visuals. This is a one stage process. The stages in this process are mutual funds, funds to buy, investment slide.


 Continue with Email

 Home
Home


