AI PPT Maker
Templates
PPT Bundles
Design Services
Business PPTs
Business Plan
Management
Strategy
Introduction PPT
Roadmap
Self Introduction
Timelines
Process
Marketing
Agenda
Technology
Medical
Startup Business Plan
Cyber Security
Dashboards
SWOT
Proposals
Education
Pitch Deck
Digital Marketing
KPIs
Project Management
Product Management
Artificial Intelligence
Target Market
Communication
Supply Chain
Google Slides
Research Services
 One Pagers
All Categories
-
Home
- Customer Favorites
- Revenue Management
Revenue Management
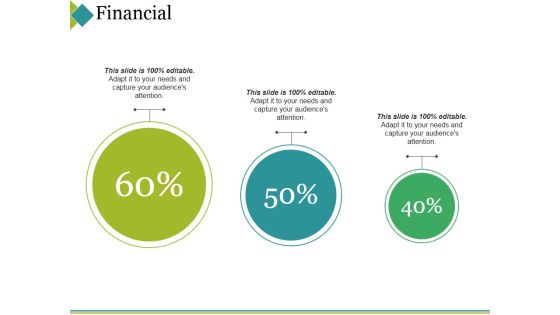
Financial Ppt PowerPoint Presentation Layouts Portrait
This is a financial ppt powerpoint presentation layouts portrait. This is a seven stage process. The stages in this process are target market, users, net revenue, financing cost, total expenses.

Financial Ppt PowerPoint Presentation Pictures Inspiration
This is a financial ppt powerpoint presentation pictures inspiration. This is a six stage process. The stages in this process are target market, users, net revenue, total expenses, pat margin.
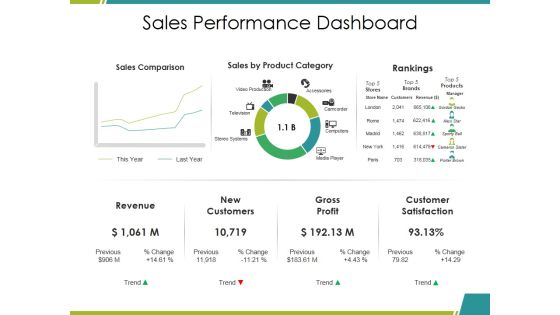
Sales Performance Dashboard Ppt PowerPoint Presentation Infographics Mockup
This is a sales performance dashboard ppt powerpoint presentation infographics mockup. This is a three stage process. The stages in this process are sales comparison, sales by product category, rankings, revenue, gross profit.

Sales Performance Dashboard Ppt PowerPoint Presentation Outline File Formats
This is a sales performance dashboard ppt powerpoint presentation outline file formats. This is a three stage process. The stages in this process are revenue, new customers, gross profit, customer satisfaction, rankings.

Financials Summary Base Plan Vs Stretch Plan Ppt PowerPoint Presentation File Shapes
This is a financials summary base plan vs stretch plan ppt powerpoint presentation file shapes. This is a three stage process. The stages in this process are finance summary, revenue, gross profit, operating profit, ending cash.

Company Financial Performance Indicators Comparative Analysis Of Two Firms Elements PDF
This slide showcases financial comparative analysis of two firms. It includes revenue, net and gross profit, assets, liabilities, capital and shareholders equity. Showcasing this set of slides titled Company Financial Performance Indicators Comparative Analysis Of Two Firms Elements PDF. The topics addressed in these templates are Revenue, Net Profit, Gross Profit. All the content presented in this PPT design is completely editable. Download it and make adjustments in color, background, font etc. as per your unique business setting.
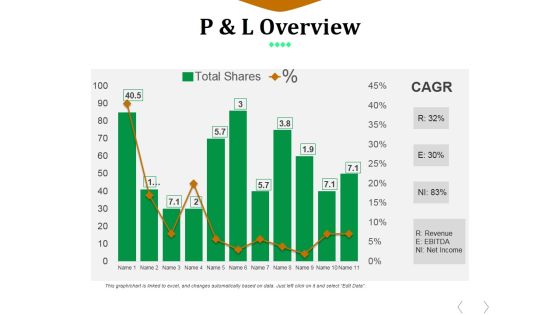
P And L Overview Ppt PowerPoint Presentation Styles Summary
This is a p and l overview ppt powerpoint presentation styles summary. This is a eleven stage process. The stages in this process are revenue, ebitda, net income, total shares.

Pandl Kpis Tabular Form Ppt PowerPoint Presentation Visual Aids
This is a pandl kpis tabular form ppt powerpoint presentation visual aids. This is a four stage process. The stages in this process are revenue, cogs, operating profit, net profit.
Pandl Kpis Tabular Form Ppt PowerPoint Presentation Gallery Icon
This is a pandl kpis tabular form ppt powerpoint presentation gallery icon. This is a four stage process. The stages in this process are revenue, cogs, operating profit, net profit.
P And L Kpis Template 2 Ppt PowerPoint Presentation Summary Icon
This is a p and l kpis template 2 ppt powerpoint presentation summary icon. This is a four stage process. The stages in this process are revenue, cogs, operating profit, net profit.

Pandl Kpis Tabular Form Ppt PowerPoint Presentation Pictures Visual Aids
This is a pandl kpis tabular form ppt powerpoint presentation pictures visual aids. This is a four stage process. The stages in this process are revenue, operating profit, cogs, net profit.
Pandl Kpis Template Ppt PowerPoint Presentation Model Icon
This is a pandl kpis template ppt powerpoint presentation model icon. This is a four stage process. The stages in this process are revenue, cogs, operating profit, net profit.
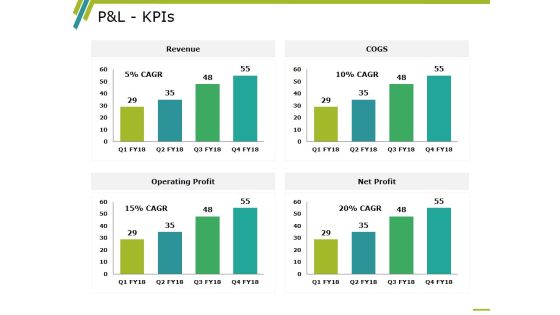
P And L Kpis Template 2 Ppt PowerPoint Presentation Professional Information
This is a p and l kpis template 2 ppt powerpoint presentation professional information. This is a four stage process. The stages in this process are revenue, operating profit, cogs, net profit, business.
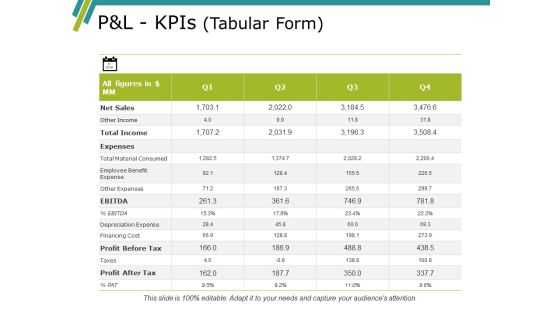
Pandl Kpis Template Ppt PowerPoint Presentation Gallery Summary
This is a pandl kpis template ppt powerpoint presentation gallery summary. This is a four stage process. The stages in this process are revenue, cogs, operating profit, net profit.
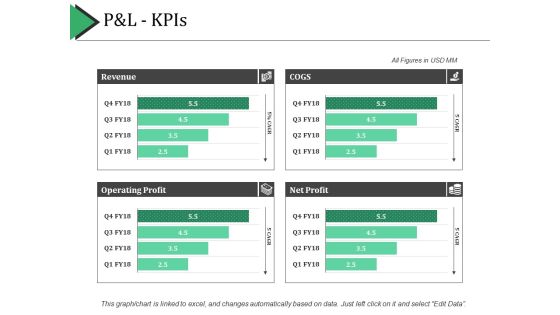
P And L Kpis Ppt PowerPoint Presentation Show Example Introduction
This is a p and l kpis ppt powerpoint presentation show example introduction. This is a four stage process. The stages in this process are revenue, cogs, net profit, operating profit.

Pandl Kpis Ppt PowerPoint Presentation Professional Backgrounds
This is a pandl kpis ppt powerpoint presentation professional backgrounds. This is a four stage process. The stages in this process are business, revenue, operating profit, cogs, net profit.

Company Sales And Performance Dashboard Ppt PowerPoint Presentation Show Structure
This is a company sales and performance dashboard ppt powerpoint presentation show structure. This is a four stage process. The stages in this process are year product sales, month growth in revenue, profit margins graph, year profits.

Sales Compensation Plan Template Good Ppt Example
This is a sales compensation plan template good ppt example. This is a eight stage process. The stages in this process are review strategic goals, assess current plan, assemble advisors, formulate new plan, plan implementation, evaluate and measure, managing profit and performance execution, managing profit and performance review and evaluation.
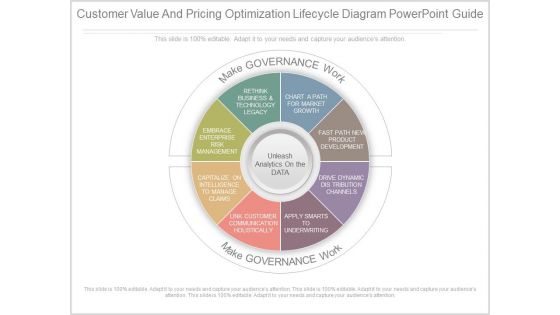
Customer Value And Pricing Optimization Lifecycle Diagram Powerpoint Guide
This is a customer value and pricing optimization lifecycle diagram powerpoint guide. This is a eight stage process. The stages in this process are unleash analytics on the data, make governance work, rethink business and technology legacy, chart a path for market growth, fast path new product development, drive dynamic distribution channels, apply smarts to underwriting, link customer communication holistically, capitalize on intelligence to manage claims, embrace enterprise risk management.

Competitors Financial Comparison With Income Statement And Balance Sheet Numbers Infographics PDF
This slide shows companys Financial Comparison with the competitors based on certain factors like Revenue, EBIT, Net Cash Flows, Total Assets, Working Capital etc. for a specific year. Deliver an awe-inspiring pitch with this creative competitors financial comparison with income statement and balance sheet numbers infographics pdf bundle. Topics like revenue, gross profit, net cash flows, working capital, competitor can be discussed with this completely editable template. It is available for immediate download depending on the needs and requirements of the user.

Competitors Financial Comparison With Income Statement And Balance Sheet Numbers Mockup PDF
This slide shows companys Financial Comparison with the competitors based on certain factors like Revenue, EBIT, Net Cash Flows, Total Assets, Working Capital etc. for a specific year. Deliver an awe inspiring pitch with this creative competitors financial comparison with income statement and balance sheet numbers mockup pdf bundle. Topics like revenue, gross profit, working capital, net cash flows can be discussed with this completely editable template. It is available for immediate download depending on the needs and requirements of the user.
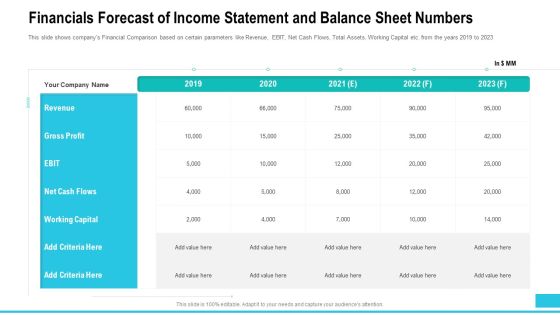
Financials Forecast Of Income Statement And Balance Sheet Numbers Professional PDF
This slide shows companys Financial Comparison based on certain parameters like Revenue, EBIT, Net Cash Flows, Total Assets, Working Capital etc. from the years 2019 to 2023. Deliver an awe inspiring pitch with this creative financials forecast of income statement and balance sheet numbers professional pdf bundle. Topics like revenue, gross profit, net cash flows, working capital, value can be discussed with this completely editable template. It is available for immediate download depending on the needs and requirements of the user.

Financials Forecast Of Income Statement And Balance Sheet Numbers Clipart PDF
This slide shows companys Financial Comparison based on certain parameters like Revenue, EBIT, Net Cash Flows, Total Assets, Working Capital etc. from the years 2019 to 2023 Deliver an awe-inspiring pitch with this creative financials forecast of income statement and balance sheet numbers clipart pdf bundle. Topics like gross profit, working capital, net cash flows, revenue, ebit can be discussed with this completely editable template. It is available for immediate download depending on the needs and requirements of the user.

Financials Forecast Of Income Statement And Balance Sheet Numbers Ppt File Slides PDF
This slide shows companys Financial Comparison based on certain parameters like Revenue, EBIT, Net Cash Flows, Total Assets, Working Capital etc. from the years 2019 to 2023. Deliver an awe inspiring pitch with this creative financials forecast of income statement and balance sheet numbers ppt file slides pdf bundle. Topics like revenue, gross profit, ebit, net cash flows, working capital can be discussed with this completely editable template. It is available for immediate download depending on the needs and requirements of the user.

Companys Financial Comparison With Income Statement And Balance Sheet Numbers Mockup PDF
This slide shows companys Financial Comparison based on certain parameters like Revenue, EBIT, Net Cash Flows, Total Assets, Working Capital etc. from the years 2019 to 2023.Deliver an awe-inspiring pitch with this creative companys financial comparison with income statement and balance sheet numbers mockup pdf. bundle. Topics like revenue, gross profit, net cash flows, working capital can be discussed with this completely editable template. It is available for immediate download depending on the needs and requirements of the user.

Financials Summary Base Plan Vs Stretch Plan Ppt PowerPoint Presentation Microsoft
This is a financials summary base plan vs stretch plan ppt powerpoint presentation microsoft. This is a three stage process. The stages in this process are revenue, cost of sales, gross profit, customer acquisition cost, other operating cost expense.

Last 90 Days Results Ppt PowerPoint Presentation Graphics
This is a last 90 days results ppt powerpoint presentation graphics. This is a five stage process. The stages in this process are new customer ytd, average weekly sales revenue, above sales target i ytd, customer acquisition cost, global performance.

External Analysis Industry Trends Ppt PowerPoint Presentation File Outfit
This is a external analysis industry trends ppt powerpoint presentation file outfit. This is a two stage process. The stages in this process are revenue, export, bar, finance, analysis.
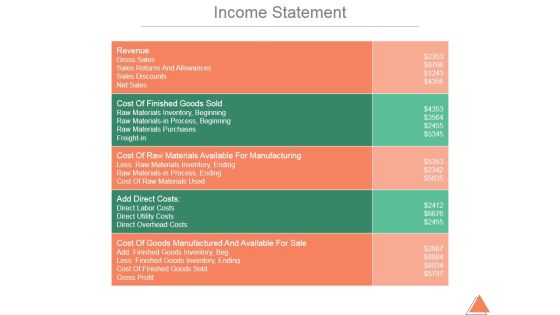
Income Statement Ppt PowerPoint Presentation Background Images
This is a income statement ppt powerpoint presentation background images. This is a five stage process. The stages in this process are revenue, gross sales, sales returns and allowances, sales discounts, net sales.
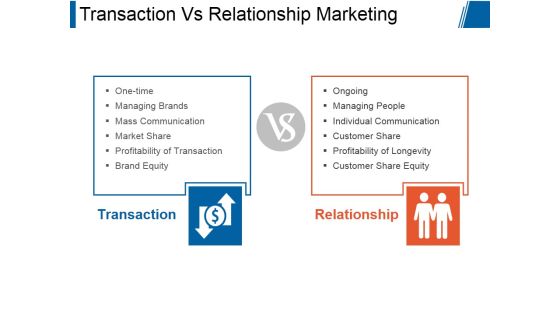
Transaction Vs Relationship Marketing Ppt PowerPoint Presentation Deck
This is a transaction vs relationship marketing ppt powerpoint presentation deck. This is a two stage process. The stages in this process are transaction, relationship, one time, managing brands, mass communication, market share, profitability of transaction, brand equity, ongoing, managing people, individual communication, customer share, profitability of longevity, customer share equity.
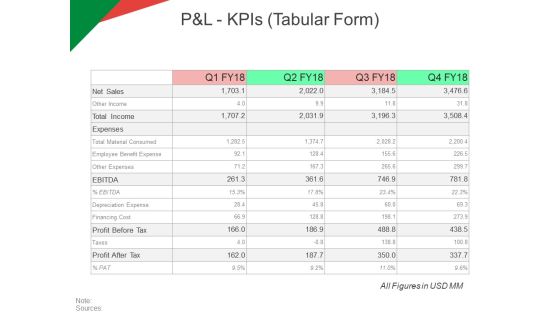
P And L Kpis Tabular Form Ppt PowerPoint Presentation Model Ideas
This is a p and l kpis tabular form ppt powerpoint presentation model ideas. This is a four stage process. The stages in this process are revenue, operating profit, cogs, net profit.
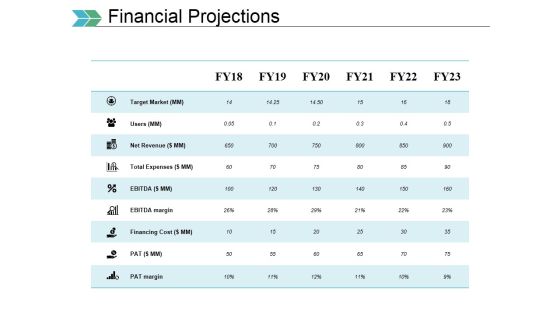
Financial Projections Ppt PowerPoint Presentation Ideas Example Introduction
This is a financial projections ppt powerpoint presentation ideas example introduction. This is a five stage process. The stages in this process are target market, users, net revenue, total expenses, financing cost.
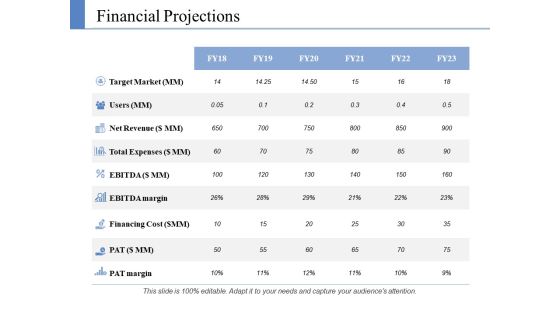
Financial Projections Ppt PowerPoint Presentation Layouts Example File
This is a financial projections ppt powerpoint presentation layouts example file. This is a six stage process. The stages in this process are target market, users, net revenue, total expenses, financing cost.
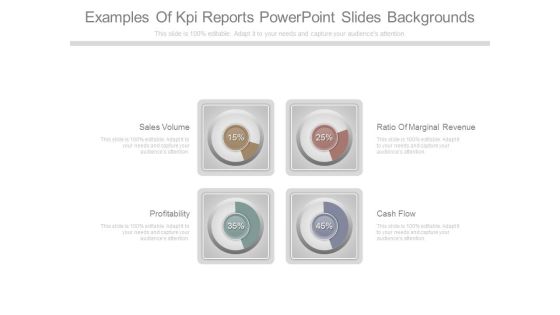
Examples Of Kpi Reports Powerpoint Slides Backgrounds
This is a examples of kpi reports powerpoint slides backgrounds. This is a four stage process. The stages in this process are sales volume, profitability, ratio of marginal revenue, cash flow.

Industry Overview Template 1 Ppt PowerPoint Presentation Show
This is a industry overview template 1 ppt powerpoint presentation show. This is a six stage process. The stages in this process are revenue, profit, annual growth, wages, businesses.

Internet Marketing Objectives Ppt PowerPoint Presentation Layouts Smartart
This is a internet marketing objectives ppt powerpoint presentation layouts smartart. This is a six stage process. The stages in this process are sales leads, product types, sales revenue, profit margins, repeat sales, web visitors.

Consequences Of Poor Quality Ppt PowerPoint Presentation Portfolio Graphics Tutorials
This is a consequences of poor quality ppt powerpoint presentation portfolio graphics tutorials. This is a six stage process. The stages in this process are lost revenue, lost customers, increased costs, lower profits, lost productivity.

Consequences Of Poor Quality Ppt PowerPoint Presentation Gallery Layout Ideas
This is a consequences of poor quality ppt powerpoint presentation gallery layout ideas. This is a six stage process. The stages in this process are lost revenue, lost productivity, lower profits, lost customers, increased costs.

Consequences Of Poor Quality Ppt PowerPoint Presentation File Graphics
This is a consequences of poor quality ppt powerpoint presentation file graphics. This is a six stage process. The stages in this process are lost revenue, lost customers, increased costs, damaged brand, lower profits.

Sales Performance Dashboard Ppt PowerPoint Presentation Ideas Portfolio
This is a sales performance dashboard ppt powerpoint presentation ideas portfolio. This is a three stage process. The stages in this process are revenue, new customers, gross profit, customer satisfaction, sales comparison.
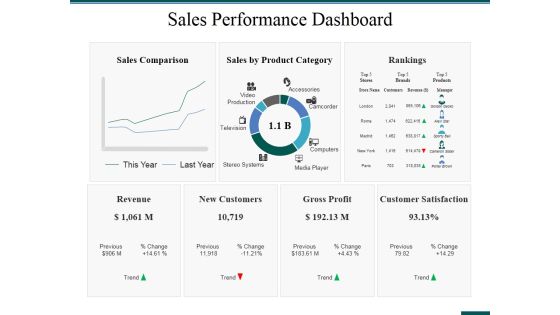
Sales Performance Dashboard Ppt PowerPoint Presentation Ideas Format Ideas
This is a sales performance dashboard ppt powerpoint presentation ideas format ideas. This is a three stage process. The stages in this process are rankings, revenue, new customers, gross profit, customer satisfaction.
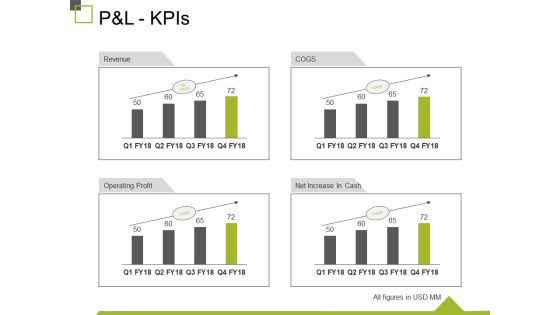
P And L Kpis Ppt PowerPoint Presentation Show Design Inspiration
This is a p and l kpis ppt powerpoint presentation show design inspiration. This is a four stage process. The stages in this process are revenue, operating profit, cogs, net increase in cash, business.

Sales Performance Dashboard Template Ppt PowerPoint Presentation Professional Elements
This is a sales performance dashboard template ppt powerpoint presentation professional elements. This is a eight stage process. The stages in this process are sales comparison, sales by product category, sales by month, brand profitability, revenue.

Competitor Analysis Ppt PowerPoint Presentation Inspiration Ideas
This is a competitor analysis ppt powerpoint presentation inspiration ideas. This is a four stage process. The stages in this process are sales development, performance indicators, revenue, sales, sales development of industry.
Sales Kpi Tracker Ppt PowerPoint Presentation Layout
This is a sales kpi tracker ppt powerpoint presentation layout. This is a six stage process. The stages in this process are leads created, sales ratio, opportunities won, top products in revenue, actual.

Competitor Analysis Ppt PowerPoint Presentation Pictures Visuals
This is a competitor analysis ppt powerpoint presentation pictures visuals. This is a four stage process. The stages in this process are sales development, performance indicators, sales development of industry, sales, revenue.
Highlights Ppt PowerPoint Presentation Icon Infographics
This is a highlights ppt powerpoint presentation icon infographics. This is a five stage process. The stages in this process are countries, stores worldwide, total revenue, associates, monthly website visitors.

Competitor Analysis Ppt PowerPoint Presentation File Influencers
This is a competitor analysis ppt powerpoint presentation file influencers. This is a four stage process. The stages in this process are revenue, sales, placeholder, performance indicators, sales development.

Competitor Analysis Ppt PowerPoint Presentation File Graphics Example
This is a competitor analysis ppt powerpoint presentation file graphics example. This is a four stage process. The stages in this process are revenue, sales development of industry, own company, placeholder, competitor.

Ppt Circular Interpretation Of 9 Steps Involved Procedure PowerPoint Templates
PPT circular interpretation of 9 steps involved procedure PowerPoint Templates-Use this Circular flow diagram to describe key strategic issues and information flows and internal communication.-PPT circular interpretation of 9 steps involved procedure PowerPoint Templates-Affiliate, Affiliation, Arrow, Business, Chart, Circular, Commerce, Concept, Contribution, Cycle, Development, Diagram, Idea, Informative, Internet, Join, Making, Manage, Management, Market, Marketing, Member, Money, Network, Partner, Partnership, Pay, Paying, Performance, Plans, Process, Productive, Productivity, Profit, Profitable, Project, Recruit, Recruiting, Recruitment, Refer, Referral, Referring, Revenue, Sales, Socialize, Steps, Strategy

Ppt Circular Interpretation Of 12 Steps Involved Procedure PowerPoint Templates
PPT circular interpretation of 12 steps involved procedure PowerPoint Templates-Use this Circular flow diagram to describe key strategic issues and information flows and internal communication.-PPT circular interpretation of 12 steps involved procedure PowerPoint Templates-Affiliate, Affiliation, Arrow, Business, Chart, Circular, Commerce, Concept, Contribution, Cycle, Development, Diagram, Idea, Informative, Internet, Join, Making, Manage, Management, Market, Marketing, Member, Money, Network, Partner, Partnership, Pay, Paying, Performance, Plans, Process, Productive, Productivity, Profit, Profitable, Project, Recruit, Recruiting, Recruitment, Refer, Referral, Referring, Revenue, Sales, Socialize, Steps, Strategy
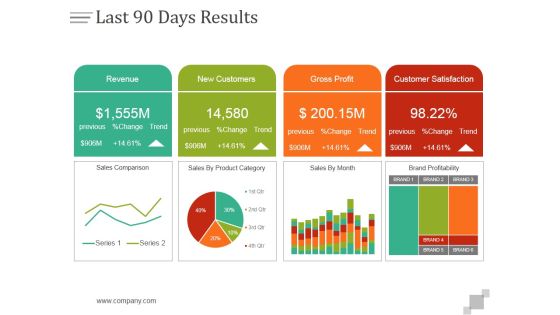
Last 90 Days Results Ppt PowerPoint Presentation Design Templates
This is a last 90 days results ppt powerpoint presentation design templates. This is a four stage process. The stages in this process are revenue, new customers, gross profit, customer satisfaction.

Industry Snapshot Template 2 Ppt PowerPoint Presentation Layouts Examples
This is a industry snapshot template 2 ppt powerpoint presentation layouts examples. This is a three stage process. The stages in this process are revenue, profit, annual growth, wages, annual growth, business.

Industry Snapshot Template 1 Ppt PowerPoint Presentation Gallery Design Ideas
This is a industry snapshot template 1 ppt powerpoint presentation gallery design ideas. This is a three stage process. The stages in this process are revenue, profit, annual growth, wages, business.
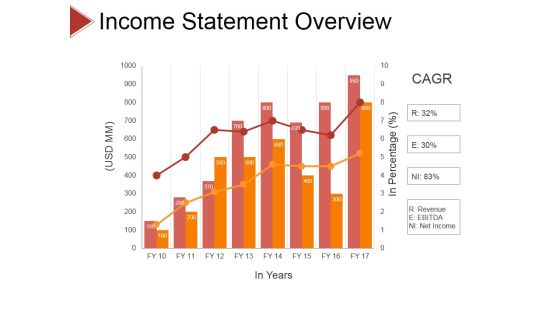
Income Statement Overview Ppt PowerPoint Presentation Slides Samples
This is a income statement overview ppt powerpoint presentation slides samples. This is a eight stage process. The stages in this process are business, strategy, analysis, pretention, revenue, ebitda, net income.

Twitter Company Summary Annual Expenditure Download PDF
This slide showcases the annual expenditure of Twitter for 2021 which includes cost of revenue, research and development, sales and marketing, general and administration, litigation settlement, etc. Deliver an awe inspiring pitch with this creative Twitter Company Summary Annual Expenditure Download PDF bundle. Topics like Revenue, Expenses Cost, Development Expenses can be discussed with this completely editable template. It is available for immediate download depending on the needs and requirements of the user.
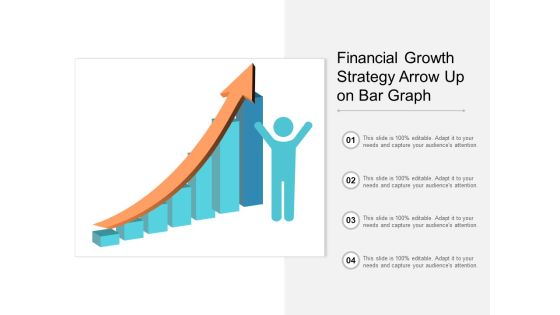
Financial Growth Strategy Arrow Up On Bar Graph Ppt PowerPoint Presentation Gallery Example
This is a financial growth strategy arrow up on bar graph ppt powerpoint presentation gallery example. This is a four stage process. The stages in this process are growth, increase sales, increase revenue.

Planning Logistic Technique Superior Supply Chain Execution Roi After Successful Logistic Strategy Plan Themes PDF
This slide shows the ROI after successful logistic strategy plan which includes increasing sales revenue, bringing more profits, provide adequate budge, etc. Deliver an awe-inspiring pitch with this creative planning logistic technique superior supply chain execution roi after successful logistic strategy plan themes pdf bundle. Topics like sales revenue, profits, provide adequate budge can be discussed with this completely editable template. It is available for immediate download depending on the needs and requirements of the user.

Competitors Financial Comparison With Income Statement And Balance Sheet Numbers Professional PDF
This slide shows companys Financial Comparison with the competitors based on certain factors like Revenue, EBIT, Net Cash Flows, Total Assets, Working Capital etc. for a specific year. Deliver an awe inspiring pitch with this creative competitors financial comparison with income statement and balance sheet numbers professional pdf bundle. Topics like financial, competitor, revenue, gross profit, net cash flows can be discussed with this completely editable template. It is available for immediate download depending on the needs and requirements of the user.
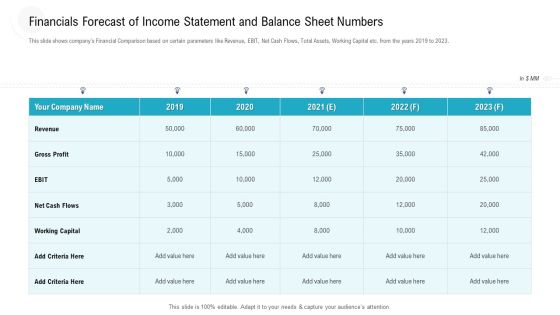
Financials Forecast Of Income Statement And Balance Sheet Numbers Ppt Summary Demonstration PDF
This slide shows companys Financial Comparison based on certain parameters like Revenue, EBIT, Net Cash Flows, Total Assets, Working Capital etc. from the years 2019 to 2023. Deliver an awe inspiring pitch with this creative financials forecast of income statement and balance sheet numbers ppt summary demonstration pdf bundle. Topics like revenue, gross profit, 2019 to 2023 can be discussed with this completely editable template. It is available for immediate download depending on the needs and requirements of the user.
