AI PPT Maker
Templates
PPT Bundles
Design Services
Business PPTs
Business Plan
Management
Strategy
Introduction PPT
Roadmap
Self Introduction
Timelines
Process
Marketing
Agenda
Technology
Medical
Startup Business Plan
Cyber Security
Dashboards
SWOT
Proposals
Education
Pitch Deck
Digital Marketing
KPIs
Project Management
Product Management
Artificial Intelligence
Target Market
Communication
Supply Chain
Google Slides
Research Services
 One Pagers
All Categories
-
Home
- Customer Favorites
- Revenue Growth
Revenue Growth
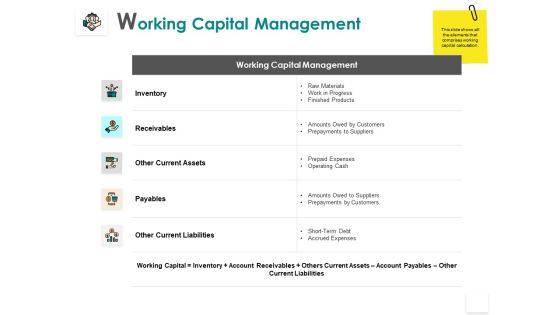
Working Capital Management Inventory Receivables Ppt PowerPoint Presentation Infographic Template Slides
Presenting this set of slides with name working capital management inventory receivables ppt powerpoint presentation infographic template slides. The topics discussed in these slides are inventory, receivable, marketing, management, strategy. This is a completely editable PowerPoint presentation and is available for immediate download. Download now and impress your audience.

Yearly Net Working Capital Table Liabilities Minimum Ppt PowerPoint Presentation Infographic Template Diagrams
Presenting this set of slides with name yearly net working capital table liabilities minimum ppt powerpoint presentation infographic template diagrams. The topics discussed in these slides are liabilities, increase, business, planning, strategy. This is a completely editable PowerPoint presentation and is available for immediate download. Download now and impress your audience.

Monthly Working Capital Calculation Table Inventory Strategy Ppt PowerPoint Presentation Slides Summary
Presenting this set of slides with name monthly working capital calculation table inventory strategy ppt powerpoint presentation slides summary. The topics discussed in these slides are inventory, receivable, marketing, management, strategy. This is a completely editable PowerPoint presentation and is available for immediate download. Download now and impress your audience.

Content Financial Analysis Ppt PowerPoint Presentation Portfolio Portrait
Presenting this set of slides with name content financial analysis ppt powerpoint presentation portfolio portrait. The topics discussed in these slides are financial, analysis, costs, calculation, comparison. This is a completely editable PowerPoint presentation and is available for immediate download. Download now and impress your audience.
Financial Planning And Management Ppt PowerPoint Presentation Infographic Template Slideshow
This is a financial planning and management ppt powerpoint presentation infographic template slideshow. This is a seven stage process. The stages in this process are support, assistance, hand holding.

Stock Market Upward Trends Graph With Dollar Sign And Arrow Up Ppt PowerPoint Presentation Professional Graphics Download
This is a stock market upward trends graph with dollar sign and arrow up ppt powerpoint presentation professional graphics download. This is a four stage process. The stages in this process are stock market, financial markets, bull market.

Bar Graph To Present Financial Information Ppt PowerPoint Presentation Show Tips
This is a bar graph to present financial information ppt powerpoint presentation show tips. This is a four stage process. The stages in this process are stock market, financial markets, bull market.
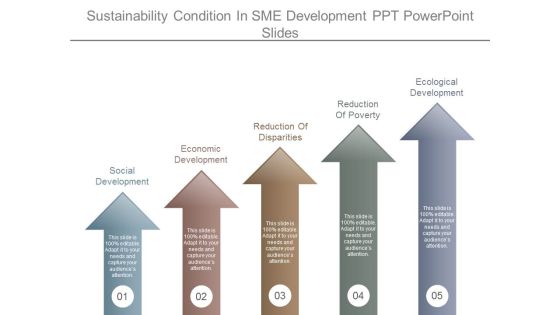
Sustainability Condition In Sme Development Ppt Powerpoint Slides
This is a sustainability condition in sme development ppt powerpoint slides. This is a five stage process. The stages in this process are social development, economic development, reduction of disparities, reduction of poverty, ecological development.

Stock Trading Graph With Bull Showing Upward Trend Ppt Powerpoint Presentation Pictures Outfit
This is a stock trading graph with bull showing upward trend ppt powerpoint presentation pictures outfit. This is a four stage process. The stages in this process are stock market, financial market, bull market.
Stock Market Trend Dollar Sign On Bar Graph Ppt Powerpoint Presentation Show Deck
This is a stock market trend dollar sign on bar graph ppt powerpoint presentation show deck. This is a four stage process. The stages in this process are stock market, financial market, bull market.

Business Plan Development Sample Diagram Powerpoint Layout
This is a business plan development sample diagram powerpoint layout. This is a five stage process. The stages in this process are business plan development, descriptive information, market information, market strategies, business models, financials.

Stock Trading Market Fluctuation Ppt Powerpoint Presentation Professional Visuals
This is a stock trading market fluctuation ppt powerpoint presentation professional visuals. This is a three stage process. The stages in this process are stock market, financial market, bull market.

Profitability Ratios Template 2 Ppt PowerPoint Presentation Infographics Layouts
This is a profitability ratios template 2 ppt powerpoint presentation infographics layouts. This is a two stage process. The stages in this process are price to earning ratio, earning per share, market value price per share.
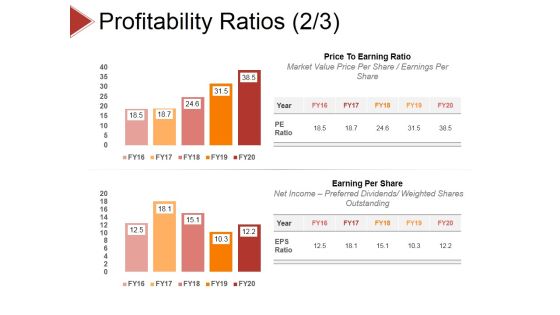
Profitability Ratios Template 3 Ppt PowerPoint Presentation Styles Slide Download
This is a profitability ratios template 3 ppt powerpoint presentation styles slide download. This is a two stage process. The stages in this process are roce, roa, net operating profit, net income.

Crm Dashboard This Year Sales Vs Last Year Sales Ppt PowerPoint Presentation Styles
This is a crm dashboard this year sales vs last year sales ppt powerpoint presentation styles. This is a two stage process. The stages in this process are sales given in fiscal month, business, marketing, presentation, growth.
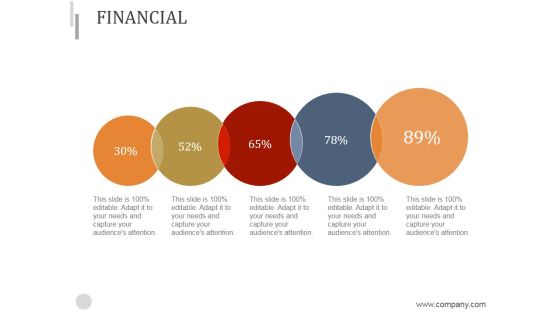
Financial Ppt PowerPoint Presentation Good
This is a financial ppt powerpoint presentation good. This is a five stage process. The stages in this process are finance, growth, process, strategy, business, marketing.
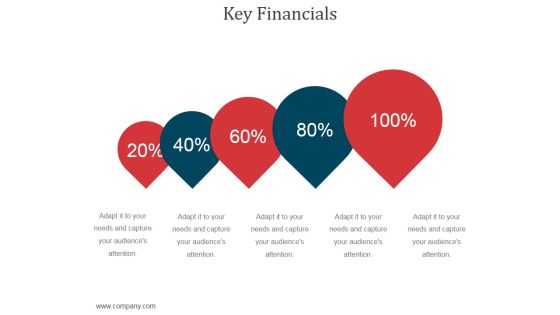
Key Financials Ppt PowerPoint Presentation Information
This is a key financials ppt powerpoint presentation information. This is a five stage process. The stages in this process are growth, finance, management, success, marketing, business.
Profitability Ratios Template 1 Ppt PowerPoint Presentation Icon Example File
This is a profitability ratios template 1 ppt powerpoint presentation icon example file. This is a two stage process. The stages in this process are gross profit ratio, net profit ratio.
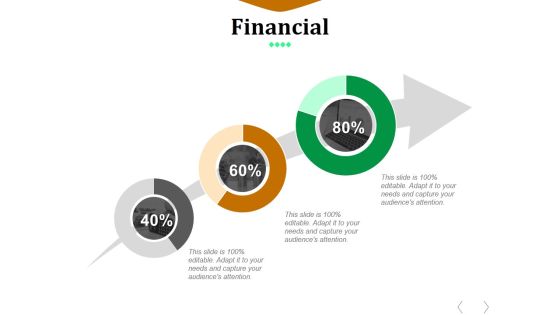
Financial Ppt PowerPoint Presentation Inspiration Ideas
This is a financial ppt powerpoint presentation inspiration ideas. This is a three stage process. The stages in this process are business, marketing, growth, finance, management.
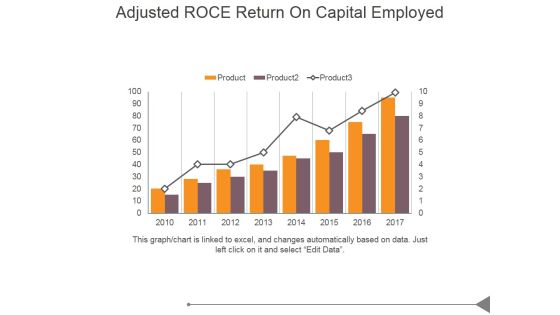
Adjusted Roce Return On Capital Employed Ppt PowerPoint Presentation Tips
This is a adjusted roce return on capital employed ppt powerpoint presentation tips. This is a eight stage process. The stages in this process are business, marketing, success, product, growth.

Line Bubble Chart Ppt PowerPoint Presentation Portfolio Slide Portrait
This is a line bubble chart ppt powerpoint presentation portfolio slide portrait. This is a six stage process. The stages in this process are highest profit, financial year, profit in sales, growth, business.

bar graph template 1 ppt powerpoint presentation infographics
This is a bar graph template 1 ppt powerpoint presentation infographics. This is a five stage process. The stages in this process are business, marketing, graph, analysis, growth.

bar graph template 2 ppt powerpoint presentation gallery
This is a bar graph template 2 ppt powerpoint presentation gallery. This is a four stage process. The stages in this process are business, marketing, product, analysis, growth.
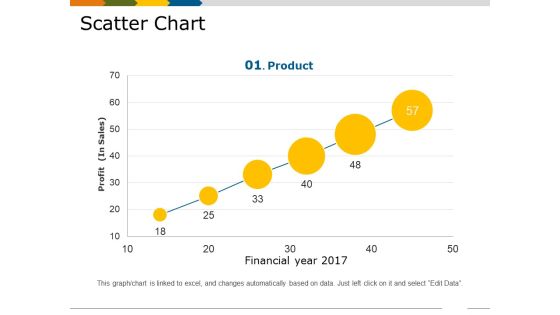
Scatter Chart Template 1 Ppt PowerPoint Presentation Show Slides
This is a scatter chart template 1 ppt powerpoint presentation show slides. This is a six stage process. The stages in this process are financial year, profit in sales, growth, business, marketing, product.

Bar Graph Ppt PowerPoint Presentation Good
This is a bar graph ppt powerpoint presentation good. This is a four stage process. The stages in this process are bar graph, growth, business, marketing, management, percentage.

Volume High Low Close Chart Ppt PowerPoint Presentation Show Outfit
This is a volume high low close chart ppt powerpoint presentation show outfit. This is a five stage process. The stages in this process are business, strategy, marketing, success, finance, growth.

Operational Highlights Ppt PowerPoint Presentation Diagrams
This is a operational highlights ppt powerpoint presentation diagrams. This is a four stage process. The stages in this process are business, process, growth, analysis, strategy, success.

Bar Graph Ppt PowerPoint Presentation Templates
This is a bar graph ppt powerpoint presentation templates. This is a four stage process. The stages in this process are arrows, business, marketing, strategy, growth, graphic.

Bar Graph Ppt PowerPoint Presentation Layout
This is a bar graph ppt powerpoint presentation layout. This is a three stage process. The stages in this process are business, marketing, management, analysis, growth.
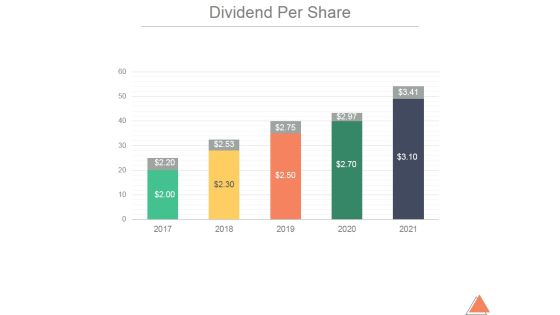
Dividend Per Share Ppt PowerPoint Presentation Pictures
This is a dividend per share ppt powerpoint presentation pictures. This is a five stage process. The stages in this process are business, marketing, management, growth, finance.

Combo Chart Ppt PowerPoint Presentation Files
This is a combo chart ppt powerpoint presentation files. This is a eight stage process. The stages in this process are business, marketing, growth, timeline, graph.
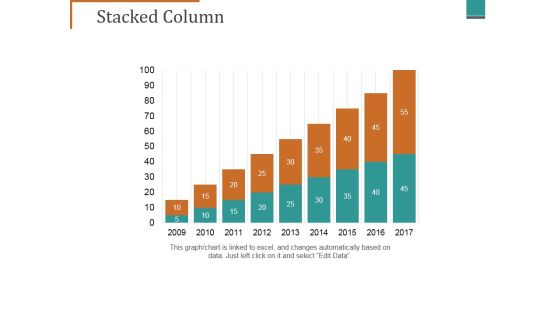
Stacked Column Ppt PowerPoint Presentation Pictures Graphics Design
This is a stacked column ppt powerpoint presentation pictures graphics design. This is a nine stage process. The stages in this process are business, finance, growth, analysis, marketing.

Bar Graph Ppt PowerPoint Presentation Outline Slides
This is a bar graph ppt powerpoint presentation outline slides. This is a three stage process. The stages in this process are business, marketing, management, analysis, growth.

Combo Chart Ppt PowerPoint Presentation Icon Format Ideas
This is a combo chart ppt powerpoint presentation icon format ideas. This is a three stage process. The stages in this process are bar, marketing, strategy, planning, growth.

Column Chart Ppt PowerPoint Presentation Ideas Visual Aids
This is a column chart ppt powerpoint presentation ideas visual aids. This is a two stage process. The stages in this process are growth, business, finance, marketing, analysis.

Combo Chart Ppt PowerPoint Presentation Styles Example File
This is a combo chart ppt powerpoint presentation styles example file. This is a three stage process. The stages in this process are finance, growth, business, analysis, marketing.

Clustered Column Line Ppt PowerPoint Presentation Model Rules
This is a clustered column line ppt powerpoint presentation model rules. This is a four stage process. The stages in this process are financial year, sales in percentage, business, marketing, growth, graph.

Market Trends Percentage Spending By Region Ppt PowerPoint Presentation Picture
This is a market trends percentage spending by region ppt powerpoint presentation picture. This is a seven stage process. The stages in this process are business, marketing, growth, planning, management.
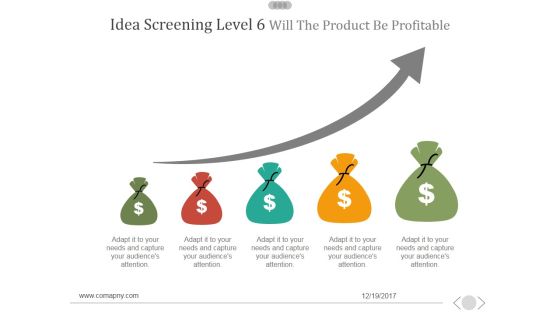
Idea Screening Level 6 Will The Product Be Profitable Ppt PowerPoint Presentation Ideas
This is a idea screening level 6 will the product be profitable ppt powerpoint presentation ideas. This is a five stage process. The stages in this process are business, marketing, success, currency, finance.

Area Chart Ppt PowerPoint Presentation Inspiration Display
This is a area chart ppt powerpoint presentation inspiration display. This is a two stage process. The stages in this process are area chart, finance, growth, success, strategy, business.

Marketing Research By Ppt PowerPoint Presentation Pictures Graphic Images
This is a marketing research by ppt powerpoint presentation pictures graphic images. This is a eight stage process. The stages in this process are business, growth, marketing, strategy, management.
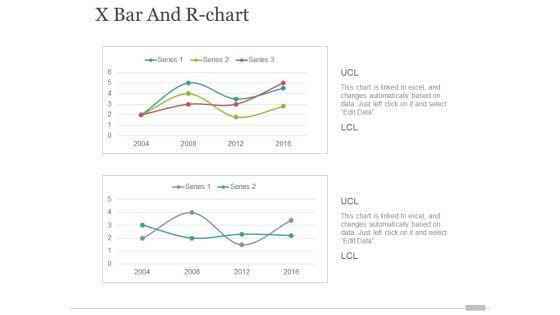
x bar and r chart ppt powerpoint presentation portfolio elements
This is a x bar and r chart ppt powerpoint presentation portfolio elements. This is a two stage process. The stages in this process are finance, business, marketing, growth.
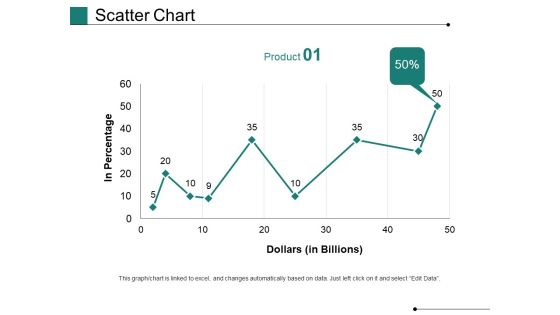
Scatter Chart Ppt PowerPoint Presentation Gallery Show
This is a scatter chart ppt powerpoint presentation gallery show. This is a one stage process. The stages in this process are in percentage, dollars, business, marketing, growth, graph.
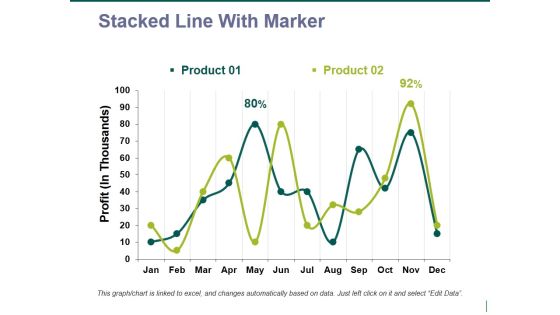
stacked line with marker ppt powerpoint presentation styles slide portrait
This is a stacked line with marker ppt powerpoint presentation styles slide portrait. This is a two stage process. The stages in this process are stacked line, growth, strategy, business, finance.
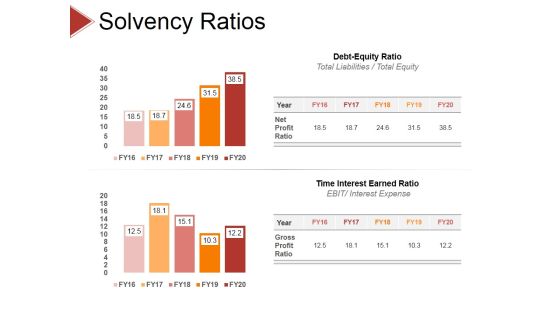
Solvency Ratios Ppt PowerPoint Presentation Model Show
This is a solvency ratios ppt powerpoint presentation model show. This is a two stage process. The stages in this process are debt equity ratio, time interest earned ratio.
Financial Projection Graph Template 1 Ppt PowerPoint Presentation Icon Summary
This is a financial projection graph template 1 ppt powerpoint presentation icon summary. This is a three stage process. The stages in this process are annual sales forecast, years, business, marketing, management.

Key Financials Ppt PowerPoint Presentation Inspiration
This is a key financials ppt powerpoint presentation inspiration. This is a four stage process. The stages in this process are after effect, 3ds max, photoshop, illustrator.

Area Chart Financial Ppt PowerPoint Presentation Outline Professional
This is a area chart financial ppt powerpoint presentation outline professional. This is a four stage process. The stages in this process are product, sales in percentage, financial year.

Column Chart Financial Ppt PowerPoint Presentation Outline Design Templates
This is a column chart financial ppt powerpoint presentation outline design templates. This is a two stage process. The stages in this process are financial, business, marketing, planning, strategy.
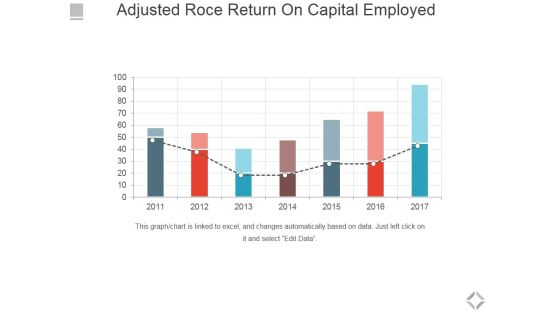
Adjusted Roce Return On Capital Employed Template 1 Ppt PowerPoint Presentation Layouts Themes
This is a adjusted roce return on capital employed template 1 ppt powerpoint presentation layouts themes. This is a seven stage process. The stages in this process are business, marketing, success, planning, management.

Financial What Are We Expecting Ppt PowerPoint Presentation Inspiration Infographics
This is a financial what are we expecting ppt powerpoint presentation inspiration infographics. This is a four stage process. The stages in this process are business, marketing, timeline, planning, strategy.

Bar Graph With Arrow For Career Planning Ppt PowerPoint Presentation Gallery
This is a bar graph with arrow for career planning ppt powerpoint presentation gallery. This is a six stage process. The stages in this process are business, finance, marketing, strategy, planning, success, arrow.

Crowdfunding Statistics Template 1 Ppt PowerPoint Presentation Outline Shapes
This is a crowdfunding statistics template 1 ppt powerpoint presentation outline shapes. This is a seven stage process. The stages in this process are business, strategy, analysis, marketing, crowding portals worldwide.

Change Curve Ppt PowerPoint Presentation Background Designs
This is a change curve ppt powerpoint presentation background designs. This is a five stage process. The stages in this process are satisfaction, denial, exploration, hope, commitment.
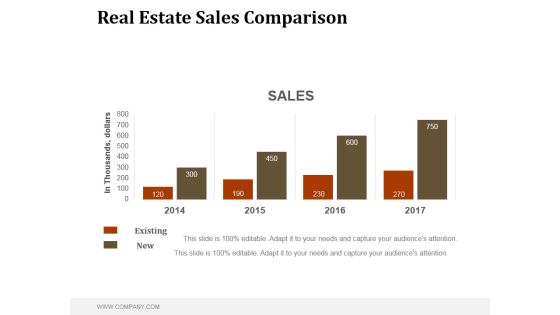
Real Estate Sales Comparison Ppt PowerPoint Presentation Good
This is a real estate sales comparison ppt powerpoint presentation good. This is a four stage process. The stages in this process are business, marketing, management, sales, comparison.
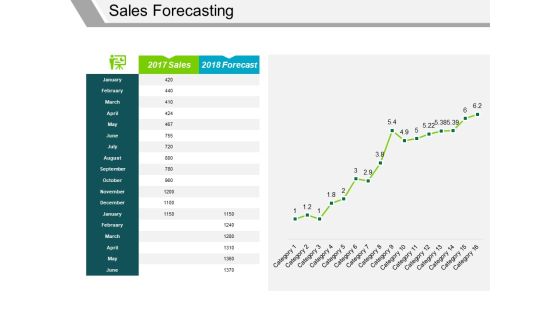
Sales Forecasting Template 1 Ppt PowerPoint Presentation Visual Aids Example 2015
This is a sales forecasting template 1 ppt powerpoint presentation visual aids example 2015. This is a one stage process. The stages in this process are forecast, sales, business, finance, marketing, strategy.

Bar Chart Ppt PowerPoint Presentation Infographic Template Skills
This is a bar chart ppt powerpoint presentation infographic template skills. This is a nine stage process. The stages in this process are sales in percentage, finance, business, marketing, strategy, success.

Hiring Plan Ppt PowerPoint Presentation Pictures Graphic Images
This is a hiring plan ppt powerpoint presentation pictures graphic images. This is a five stage process. The stages in this process are engineering, sales, marketing, product, support, finance.

Portfolio Management Process Ppt PowerPoint Presentation Layout
This is a portfolio management process ppt powerpoint presentation layout. This is a five stage process. The stages in this process are define, analyze, control, measure, improve.

Risk Return Plot Ppt PowerPoint Presentation Background Images
This is a risk return plot ppt powerpoint presentation background images. This is a nine stage process. The stages in this process are annualized return, annualized standard deviation.

Bar Graph Ppt PowerPoint Presentation Outline File Formats
This is a bar graph ppt powerpoint presentation outline file formats. This is a nine stage process. The stages in this process are bar graph, business, management, success, strategy.

Competitor Analysis 2 X 2 Matrix Ppt PowerPoint Presentation Deck
This is a competitor analysis 2 x 2 matrix ppt powerpoint presentation deck. This is a four stage process. The stages in this process are business, marketing, management, matrix, analysis.

Crowdfunding Statistics Template 2 Ppt PowerPoint Presentation Styles Graphics Design
This is a crowdfunding statistics template 2 ppt powerpoint presentation styles graphics design. This is a seven stage process. The stages in this process are raised worldwide, crowding portals worldwide, no of portals.

Customer Service Bench Marketing Ppt PowerPoint Presentation Professional Summary
This is a customer service bench marketing ppt powerpoint presentation professional summary. This is a five stage process. The stages in this process are very poor, poor, good, excellent.

Bar Graph Ppt PowerPoint Presentation Styles Picture
This is a bar graph ppt powerpoint presentation styles picture. This is a four stage process. The stages in this process are business, strategy, marketing, analysis, chart and graph, bar graph.
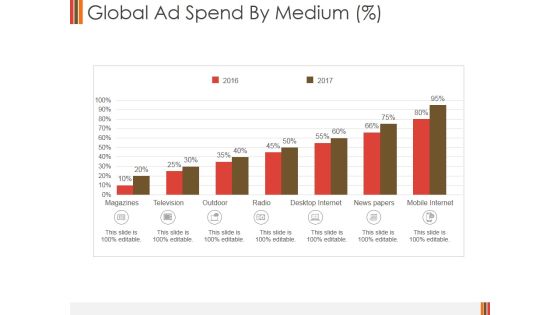
Global Ad Spend By Medium Ppt PowerPoint Presentation Ideas Design Templates
This is a global ad spend by medium ppt powerpoint presentation ideas design templates. This is a seven stage process. The stages in this process are magazines, television, outdoor, radio, desktop internet, news papers, mobile internet.

Web Traffic Insights Ppt PowerPoint Presentation Summary Vector
This is a web traffic insights ppt powerpoint presentation summary vector. This is a five stage process. The stages in this process are website ranks in june, traffic sources, engagement in june, subdomains.

Area Chart Ppt PowerPoint Presentation Styles Designs
This is a area chart ppt powerpoint presentation styles designs. This is a two stage process. The stages in this process are area chart, product.

Stacked Column Ppt PowerPoint Presentation Ideas Pictures
This is stacked column ppt powerpoint presentation ideas pictures. This is a two stage process. The stages in this process are product, in million, strategy management, business, finance.
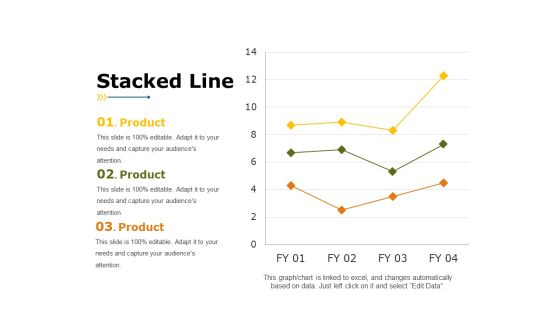
Stacked Line Ppt PowerPoint Presentation Background Image
This is a stacked line ppt powerpoint presentation background image. This is a three stage process. The stages in this process are product, stacked line, business, marketing, finance.
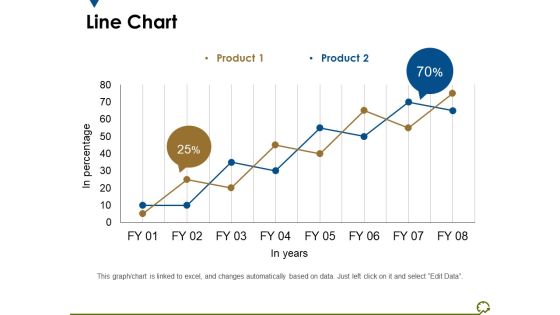
Line Chart Ppt PowerPoint Presentation Outline Diagrams
This is a line chart ppt powerpoint presentation outline diagrams. This is a two stage process. The stages in this process are in percentage, in years, percentage, business, marketing.

Line Chart Ppt PowerPoint Presentation Summary Graphic Tips
This is a line chart ppt powerpoint presentation summary graphic tips. This is a two stage process. The stages in this process are line chart, product, in percentage, analysis, business.

Column Chart Ppt PowerPoint Presentation File Graphics
This is a column chart ppt powerpoint presentation file graphics. This is a two stage process. The stages in this process are column chart, finance, analysis, marketing, business.

Change Management Experience Ppt PowerPoint Presentation Infographic Template Portfolio
This is a change management experience ppt powerpoint presentation infographic template portfolio. This is a one stage process. The stages in this process are finance, marketing, analysis, business, investment.

Combo Chart Finance Ppt PowerPoint Presentation Clipart
This is a combo chart finance ppt powerpoint presentation pictures show. This is a two stage process. The stages in this process are finance, marketing, management, investment, analysis.

Clustered Column Line Ppt PowerPoint Presentation Infographic Template Deck
This is a clustered column line ppt powerpoint presentation infographic template deck. This is a three stage process. The stages in this process are business, strategy, analysis, planning, sales in percentage, financial year.
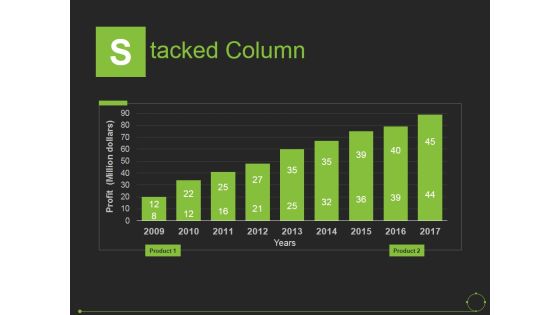
Stacked Column Ppt PowerPoint Presentation Slides Introduction
This is a stacked column ppt powerpoint presentation slides introduction. This is a nine stage process. The stages in this process are years, profit, product, business, marketing.
Line Chart Ppt PowerPoint Presentation Ideas Icon
This is a line chart ppt powerpoint presentation ideas icon. This is a two stage process. The stages in this process are profit, product, line chart.
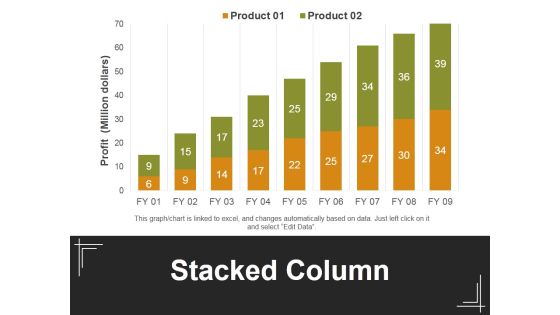
Stacked Column Ppt PowerPoint Presentation Outline Maker
This is a stacked column ppt powerpoint presentation outline maker. This is a two stage process. The stages in this process are profit, stacked bar, product, business, marketing.
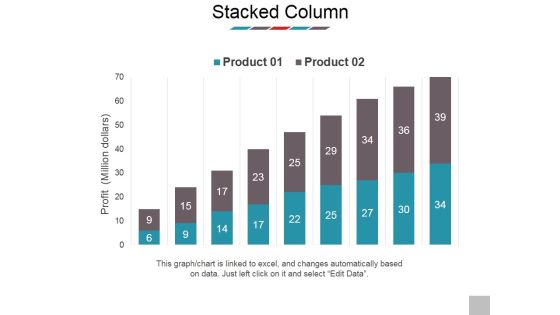
Stacked Column Ppt PowerPoint Presentation Professional Deck
This is a stacked column ppt powerpoint presentation professional deck. This is a two stage process. The stages in this process are profit, business, marketing, presentation, product.

Area Chart Ppt PowerPoint Presentation Samples
This is a area chart ppt powerpoint presentation samples. This is a two stage process. The stages in this process are financial year, sales in percentage, jan, feb.

Column Chart Ppt PowerPoint Presentation Gallery Design Inspiration
This is a column chart ppt powerpoint presentation gallery design inspiration. This is a two stage process. The stages in this process are column chart, product, sales in percentage, financial years.
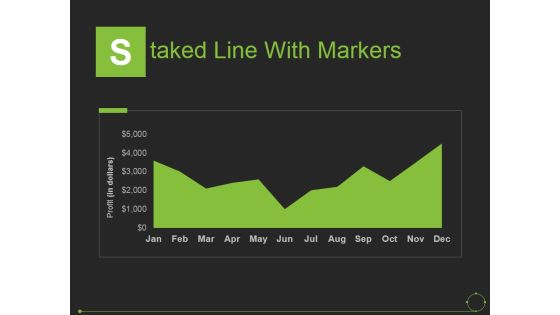
Staked Line With Markers Ppt PowerPoint Presentation Pictures Examples
This is a staked line with markers ppt powerpoint presentation pictures examples. This is a one stage process. The stages in this process are years, profit, product, business, marketing.

Stacked Line Chart Ppt PowerPoint Presentation Outline Examples
This is a stacked line chart ppt powerpoint presentation outline examples. This is a two stage process. The stages in this process are product, stacked line chart, business, marketing, profit.
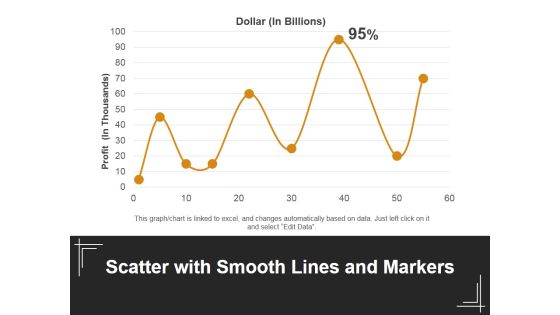
Scatter With Smooth Lines And Markers Ppt PowerPoint Presentation Outline Design Ideas
This is a scatter with smooth lines and markers ppt powerpoint presentation outline design ideas. This is a one stage process. The stages in this process are dollar, profit, line chart, business, marketing.

Bar Graph Ppt PowerPoint Presentation Model Graphic Tips
This is a bar graph ppt powerpoint presentation model graphic tips. This is a two stage process. The stages in this process are we are dollars in millions, financials years, bar graph, product, business.
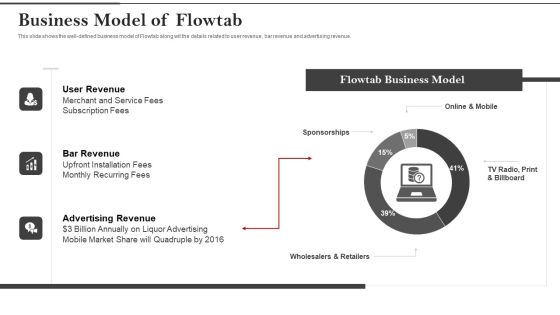
Flowtab Venture Capital Investment Business Model Of Flowtab Elements PDF
This slide shows the well defined business model of Flowtab along wit the details related to user revenue, bar revenue and advertising revenue. This is a flowtab venture capital investment business model of flowtab elements pdf template with various stages. Focus and dispense information on three stages using this creative set, that comes with editable features. It contains large content boxes to add your information on topics like user revenue, bar revenue, advertising revenue. You can also showcase facts, figures, and other relevant content using this PPT layout. Grab it now.

Conversion Rate Template 1 Ppt PowerPoint Presentation Styles
This is a conversion rate template 1 ppt powerpoint presentation styles. This is a two stage process. The stages in this process are net revenue, gross revenue.
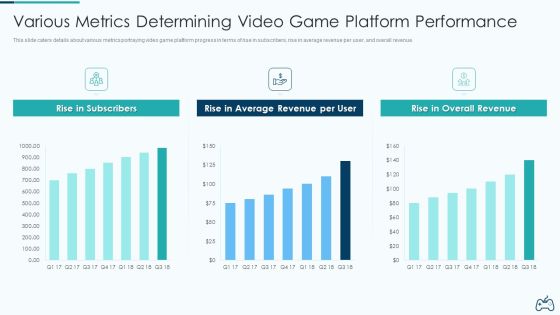
Electronic Game Pitch Deck Various Metrics Determining Video Game Platform Performance Designs PDF
This slide caters details about various metrics portraying video game platform progress in terms of rise in subscribers, rise in average revenue per user, and overall revenue. Deliver an awe inspiring pitch with this creative electronic game pitch deck various metrics determining video game platform performance designs pdf bundle. Topics like rise in subscribers, average revenue, overall revenue can be discussed with this completely editable template. It is available for immediate download depending on the needs and requirements of the user.
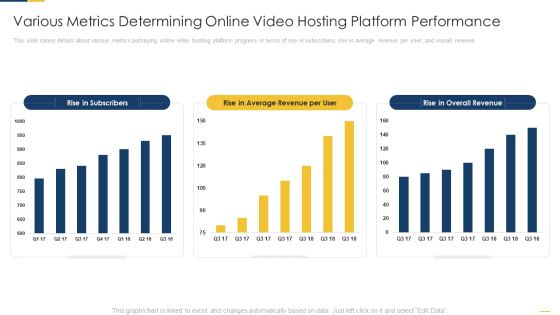
Various Metrics Determining Online Video Hosting Platform Performance Slides PDF
This slide caters details about various metrics portraying online video hosting platform progress in terms of rise in subscribers, rise in average revenue per user, and overall revenue. Deliver an awe inspiring pitch with this creative various metrics determining online video hosting platform performance slides pdf bundle. Topics like rise in subscribers, average revenue, overall revenue can be discussed with this completely editable template. It is available for immediate download depending on the needs and requirements of the user.

Competitor Analysis Template 4 Ppt PowerPoint Presentation Ideas Graphics Example
This is a competitor analysis template 4 ppt powerpoint presentation ideas graphics example. This is a four stage process. The stages in this process are revenue, your company, market share, competitor, analysis.

Key Metrics In Software Sales Strategy Pictures PDF
This slide presents key metrics to be tracked in software sales plan, that helps organisations to keep track of growth and profits generated over time. It includes monthly recurring revenue, average revenue per user, customer lifetime value and lead velocity rate Presenting Key Metrics In Software Sales Strategy Pictures PDF to dispense important information. This template comprises four stages. It also presents valuable insights into the topics including Monthly Recurring Revenue, Customer Lifetime Value, Lead Velocity Rate. This is a completely customizable PowerPoint theme that can be put to use immediately. So, download it and address the topic impactfully.

Crm Dashboard Kpis Ppt PowerPoint Presentation Inspiration Brochure
This is a crm dashboard kpis ppt powerpoint presentation inspiration brochure. This is a three stage process. The stages in this process are acquisition, active subscribers, revenue.

Financial Projections Ppt PowerPoint Presentation Images
This is a financial projections ppt powerpoint presentation images. This is a three stage process. The stages in this process are pat margin, target market, users, net revenue.

External Analysis Template 2 Ppt PowerPoint Presentation Pictures Grid
This is a external analysis template 2 ppt powerpoint presentation pictures grid. This is a two stage process. The stages in this process are revenue, export.

Competitor Comparison Template 2 Ppt PowerPoint Presentation Show Design Ideas
This is a competitor comparison template 2 ppt powerpoint presentation show design ideas. This is a four stage process. The stages in this process are competitor, profit, revenue.

Kpi Dashboard To Track Progress Of Tactics To Launch New Product Infographics PDF
Mentioned slide showcases KPI dashboard to monitor impact of product launch strategy on increasing business market share. It includes elements such as revenue, new customers, lead generation rate, customer satisfaction rate, revenue by customers, revenue and lead generation by marketing platform. Showcasing this set of slides titled Kpi Dashboard To Track Progress Of Tactics To Launch New Product Infographics PDF. The topics addressed in these templates are Quarterly Sales Comparison, Revenue Marketing, Revenue Customers. All the content presented in this PPT design is completely editable. Download it and make adjustments in color, background, font etc. as per your unique business setting.

Financial Business PowerPoint Template 0610
Calculation of the financial growth and investment

Network Business PowerPoint Template 0810
Business financial growth and network concept illustration

Financial Ppt PowerPoint Presentation File Format Ideas
This is a financial ppt powerpoint presentation file format ideas. This is a six stage process. The stages in this process are total assets, total tax paid, loan, revenue, deposits, net income.
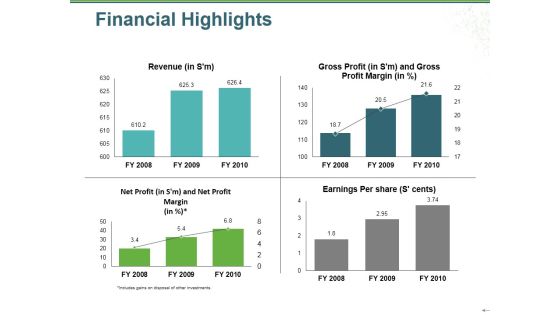
Financial Highlights Ppt PowerPoint Presentation Gallery Graphics Example
This is a financial highlights ppt powerpoint presentation gallery graphics example. This is a four stage process. The stages in this process are revenue, gross profit, net profit, earnings per share, bar graph.
Financial Highlights Ppt PowerPoint Presentation Ideas Graphics Download
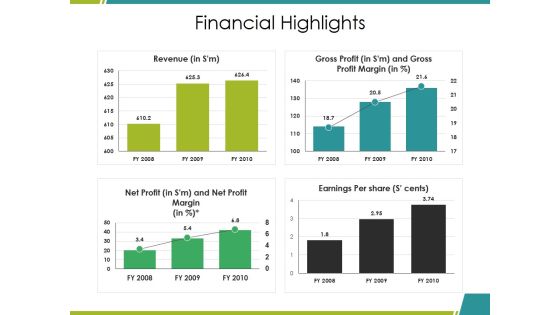
This is a financial highlights ppt powerpoint presentation ideas graphics download. This is a four stage process. The stages in this process are revenue, gross profit, net profit, earnings per share, bar graph.

Current Financial Highlights Ppt PowerPoint Presentation File Demonstration
This is a current financial highlights ppt powerpoint presentation show example. This is a four stage process. The stages in this process are revenue, net profit, earnings per share, gross profit.

Current State Analysis Financial Comparison Ppt PowerPoint Presentation Inspiration Good
This is a current state analysis financial comparison ppt powerpoint presentation inspiration good. This is a five stage process. The stages in this process are revenue, profits, cash balance, competitor.

Income Statement Graphical Representation Ppt PowerPoint Presentation Infographics Layouts
This is a income statement graphical representation ppt powerpoint presentation infographics layouts. This is a four stage process. The stages in this process are revenue, cogs, operating profit, net profit.
Income Statement Overview Ppt PowerPoint Presentation Infographic Template Icon
This is a income statement overview ppt powerpoint presentation infographic template icon. This is a five stage process. The stages in this process are revenue, profit margin, operating profit margin.
Income Statement Graphical Representation Ppt PowerPoint Presentation Infographic Template Influencers
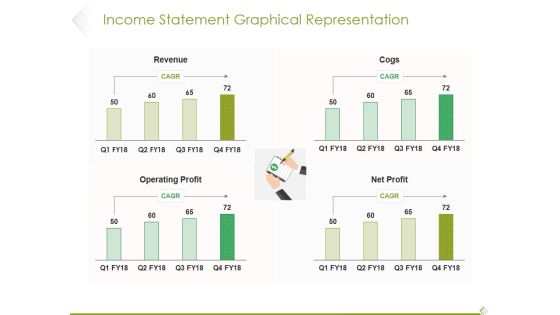
This is a income statement graphical representation ppt powerpoint presentation infographic template influencers. This is a four stage process. The stages in this process are revenue, cogs, operating profit, profit.
Income Statement Overview Ppt PowerPoint Presentation File Structure
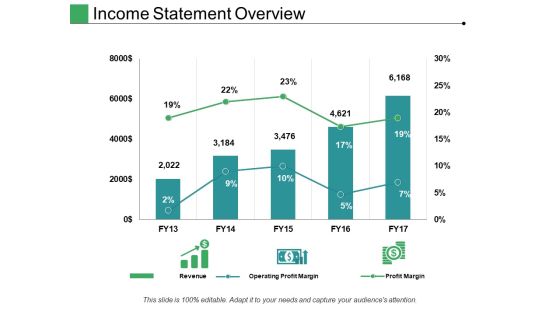
This is a income statement overview ppt powerpoint presentation file structure. This is a five stage process. The stages in this process are revenue, operating profit margin, profit margin.

Pandl Kpis Tabular Form Ppt PowerPoint Presentation Visual Aids
This is a pandl kpis tabular form ppt powerpoint presentation visual aids. This is a four stage process. The stages in this process are revenue, cogs, operating profit, net profit.

Current State Analysis Financial Comparison Ppt Powerpoint Presentation File Graphic Tips
This is a current state analysis financial comparison ppt powerpoint presentation file graphic tips. This is a five stage process. The stages in this process are revenue, profits, cash balance.

Potential Price And Profit Margins Ppt PowerPoint Presentation Design Templates
This is a potential price and profit margins ppt powerpoint presentation design templates. This is a three stage process. The stages in this process are cost item, beginning, revenue, cost of production, gross profit, gross profit margin, other income, wages.

Competitor Analysis Template 1 Ppt PowerPoint Presentation Gallery Demonstration
This is a competitor analysis template 1 ppt powerpoint presentation gallery demonstration. This is a four stage process. The stages in this process are business, strategy, marketing, planning, your company, revenue.

Break Even Analysis Ppt PowerPoint Presentation Design Templates
This is a break even analysis ppt powerpoint presentation design templates. This is a two stage process. The stages in this process are sales, break even volume, total revenue, loss, profit.

Combo Chart Ppt PowerPoint Presentation Infographic Template Graphic Images
This is a combo chart ppt powerpoint presentation infographic template graphic images. This is a three stage process. The stages in this process are market size, growth rate, percentage, business, marketing.

Consulting Methodology Ppt Powerpoint Templates
This is a consulting methodology ppt powerpoint templates. This is a four stage process. The stages in this process are target markets, increase revenue, generate leads, drive sales, align people.

Competitor Analysis Ppt PowerPoint Presentation Professional Designs
This is a competitor analysis ppt powerpoint presentation professional designs. This is a four stage process. The stages in this process are sales development of industry, sales development, performance indicators, revenue.

P And L Kpis Template 2 Ppt PowerPoint Presentation Inspiration Grid
This is a p and l kpis template 2 ppt powerpoint presentation inspiration grid. This is a four stage process. The stages in this process are revenue, cogs, operating profit, net profit.

P And L Kpis Ppt PowerPoint Presentation Designs Download
This is a p and l kpis ppt powerpoint presentation designs download. This is a four stage process. The stages in this process are revenue, cogs, operating profit, net profit.

Gap Analysis Graph Ppt PowerPoint Presentation Slides Graphics Pictures
This is a gap analysis graph ppt powerpoint presentation slides graphics pictures. This is a five stage process. The stages in this process are revenue, time, high, low, risk.

Break Even Analysis Ppt PowerPoint Presentation Inspiration Layouts
This is a break even analysis ppt powerpoint presentation inspiration layouts. This is a three stage process. The stages in this process are total revenue, total costs, variable cost, fixed costs, units sold.

Competitor Analysis Template 4 Ppt PowerPoint Presentation Styles Visual Aids
This is a competitor analysis template 4 ppt powerpoint presentation styles visual aids. This is a four stage process. The stages in this process are revenue, your company, competitor.

Break Even Analysis Ppt Powerpoint Presentation Show Maker
This is a break even analysis ppt powerpoint presentation show maker. This is a two stage process. The stages in this process are total revenue, total costs, break even volume.
Highlights Ppt PowerPoint Presentation Slides Styles
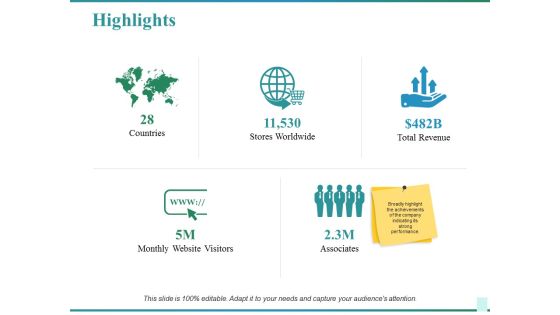
This is a highlights ppt powerpoint presentation slides styles. This is a five stage process. The stages in this process are countries, stores worldwide, total revenue, associates, monthly website visitors.

Customer Behavior Analysis Big Data Ppt PowerPoint Presentation Images
This is a customer behavior analysis big data ppt powerpoint presentation images. This is a five stage process. The stages in this process are analyzing customer behavior, combining multiple data sources, improving customer service, generate additional revenue, be more responsive to the market.
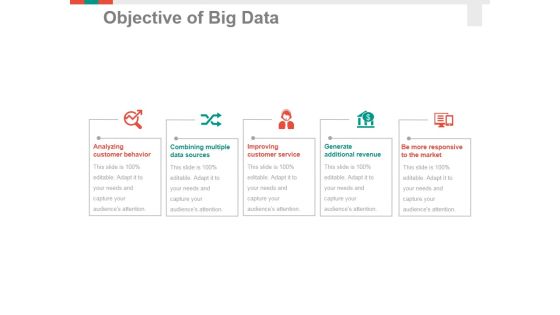
Objective Of Big Data Ppt PowerPoint Presentation Professional Sample
This is a objective of big data ppt powerpoint presentation professional sample. This is a five stage process. The stages in this process are analyzing customer behavior, combining multiple data sources, improving customer service, generate additional revenue, be more responsive to the market.

Setting The M And A Criteria Ppt PowerPoint Presentation Infographic Template Backgrounds
This is a setting the m and a criteria ppt powerpoint presentation infographic template backgrounds. This is a six stage process. The stages in this process are deal size, industry, target company revenue, target company pat margins, country, new analytical tool.

Budget And Financial Snapshot Ppt PowerPoint Presentation Example
This is a budget and financial snapshot ppt powerpoint presentation example. This is a two stage process. The stages in this process are sales, operating income, net income.

Area Ppt PowerPoint Presentation Themes
This is a area ppt powerpoint presentation themes. This is a two stage process. The stages in this process are area chart, management, growth, strategy, business.

Combo Chart Ppt PowerPoint Presentation Portfolio Infographics
This is a combo chart ppt powerpoint presentation portfolio infographics. This is a eight stage process. The stages in this process are market size, growth, years, finance, business.

Summary Financials Wc Analysis Roce Roe Ppt PowerPoint Presentation Pictures Outfit
This is a summary financials wc analysis roce roe ppt powerpoint presentation pictures outfit. This is a two stage process. The stages in this process are business, finance, analysis, marketing, strategy, growth.

Scatter Chart Template 3 Ppt PowerPoint Presentation Styles Demonstration
This is a scatter chart template 3 ppt powerpoint presentation styles demonstration. This is a one stage process. The stages in this process are sales in percentage, finance, business, marketing, growth.

Combo Chart Ppt PowerPoint Presentation Layouts Visual Aids
This is a combo chart ppt powerpoint presentation layouts visual aids. This is a three stage process. The stages in this process are combo chart, process, growth, success, strategy.

Area Chart Ppt PowerPoint Presentation Visual Aids Show
This is a area chart ppt powerpoint presentation visual aids show. This is a two stage process. The stages in this process are area chart, growth, strategy, finance, business.
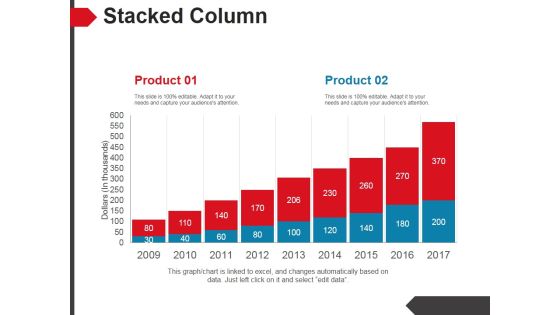
Stacked Column Ppt PowerPoint Presentation Example
This is a stacked column ppt powerpoint presentation example. This is a two stage process. The stages in this process are product, stacked column, business, marketing, strategy, success.

Column Chart Ppt PowerPoint Presentation Layouts Design Inspiration
This is a column chart ppt powerpoint presentation layouts design inspiration. This is a two stage process. The stages in this process are sales in percentage, financial year in, graph, business, finance, marketing.

Competitor Analysis Template 2 Ppt PowerPoint Presentation File Picture
This is a competitor analysis template 2 ppt powerpoint presentation file picture. This is a four stage process. The stages in this process are your company, market share, competitor, analysis.

Competitor Analysis Template 3 Ppt PowerPoint Presentation Infographic Template Shapes
This is a competitor analysis template 3 ppt powerpoint presentation infographic template shapes. This is a four stage process. The stages in this process are your company, market share, competitor, analysis.
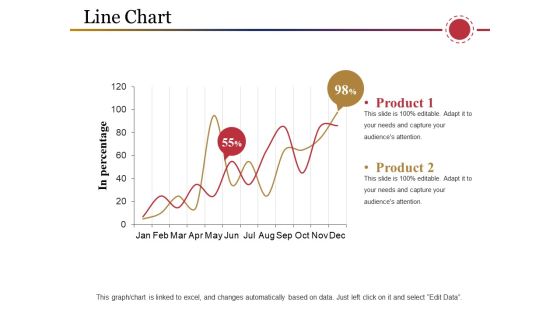
Line Chart Ppt PowerPoint Presentation Inspiration Samples
This is a line chart ppt powerpoint presentation inspiration samples. This is a two stage process. The stages in this process are product, in percentage, business, marketing, graph.

Area Chart Ppt PowerPoint Presentation Outline Deck
This is a area chart ppt powerpoint presentation outline deck. This is a two stage process. The stages in this process are area chart, finance, marketing, analysis, business.

Combo Chart Ppt PowerPoint Presentation Icon Portrait
This is a combo chart ppt powerpoint presentation icon portrait. This is a three stage process. The stages in this process are combo chart, finance, marketing, strategy, analysis.
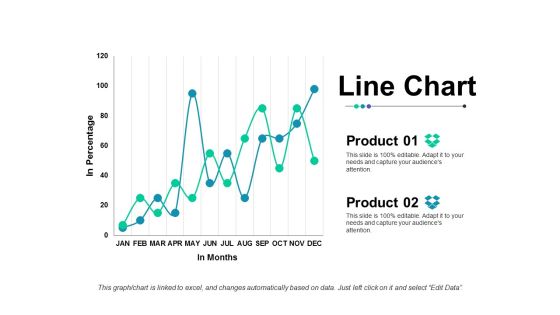
Line Chart Ppt Powerpoint Presentation Outline Slide Portrait
This is a line chart ppt powerpoint presentation outline slide portrait. This is a two stage process. The stages in this process are line chart, finance, strategy, business, analysis.

Global Healthcare Device Sale Trends Microsoft PDF
This slide shows international market sale trends that can be used to frame future marketing strategies to boost overall revenue of organization. It include projected sales over next five years, current growth data and top global players etc.Showcasing this set of slides titled Global Healthcare Device Sale Trends Microsoft PDF. The topics addressed in these templates are Market Growth, Incremental Growth, Growth Current. All the content presented in this PPT design is completely editable. Download it and make adjustments in color, background, font etc. as per your unique business setting.

Sales Report Of Diversified Product Portfolio Diagrams PDF
This slide illustrates report on revenue generation across diversified product portfolio. It includes sales in USD MM, internal growth, pricing, overall growth etc.Persuade your audience using this Sales Report Of Diversified Product Portfolio Diagrams PDF. This PPT design covers one stage, thus making it a great tool to use. It also caters to a variety of topics including Internal Growth, Overall Growth, Total Group. Download this PPT design now to present a convincing pitch that not only emphasizes the topic but also showcases your presentation skills.

Combo Chart Ppt PowerPoint Presentation Inspiration Images
This is a combo chart ppt powerpoint presentation inspiration images. This is a three stage process. The stages in this process are market size, in years, growth rate, product.
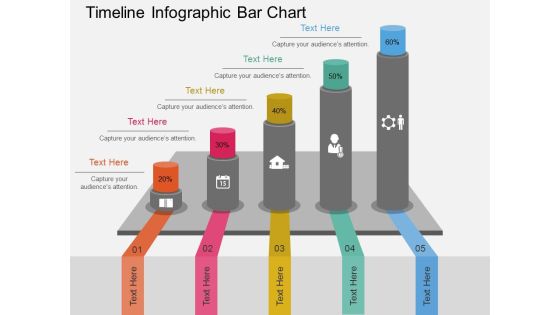
Timeline Infographic Bar Chart Powerpoint Template
This business diagram has been designed with timeline infographic bar chart. You may use this slide to display success and growth concepts. Make your mark with this unique slide and create an impression that will endure.

Current Quarter Portfolio Ppt PowerPoint Presentation Visual Aids
This is a current quarter portfolio ppt powerpoint presentation visual aids. This is a two stage process. The stages in this process are business, strategy, marketing, finance, growth strategy, bar graph.

Business Turnaround Plan To Boost Product Sales Guidelines PDF
This slide signifies the turn around strategy used to increase organisation revenue through. It includes stages like problem investigation, develop strategy, implement and monitor business growth Presenting business turnaround plan to boost product sales guidelines pdf to dispense important information. This template comprises four stages. It also presents valuable insights into the topics including problem investigation, develop strategy, monitor business growth This is a completely customizable PowerPoint theme that can be put to use immediately. So, download it and address the topic impactfully.
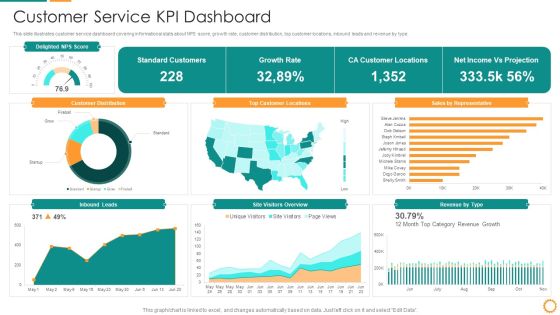
IT Consolidation Post Mergers And Acquisition Customer Service KPI Dashboard Brochure PDF
This slide illustrates customer service dashboard covering informational stats about NPS score, growth rate, customer distribution, top customer locations, inbound leads and revenue by type. Deliver an awe inspiring pitch with this creative IT Consolidation Post Mergers And Acquisition Customer Service KPI Dashboard Brochure PDF bundle. Topics like Customer Locations, Growth Rate, Standard Customers, Net Income, Projection can be discussed with this completely editable template. It is available for immediate download depending on the needs and requirements of the user.

Traction Ppt PowerPoint Presentation Show Information
This is a traction ppt powerpoint presentation show information. This is a three stage process. The stages in this process are any awards like best start up best tech transforming company etc, were performing amazing for these clients look at these results, growing fast generating good revenues, .

Conversion Rate Template 1 Ppt PowerPoint Presentation Portfolio
This is a conversion rate template 1 ppt powerpoint presentation portfolio. This is a three stage process. The stages in this process are gross revenue, net revenue, from last year.
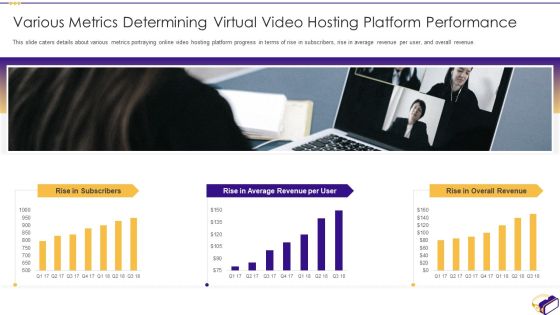
Virtual Video Hosting Applications Investor Fundraising Elevator Various Metrics Determining Professional PDF
This slide caters details about various metrics portraying online video hosting platform progress in terms of rise in subscribers, rise in average revenue per user, and overall revenue. Deliver and pitch your topic in the best possible manner with this virtual video hosting applications investor fundraising elevator various metrics determining professional pdf. Use them to share invaluable insights on average, revenue and impress your audience. This template can be altered and modified as per your expectations. So, grab it now.

Critical Success Factors Table Sample Ppt Presentation
This is a critical success factors table sample ppt presentation. This is a four stage process. The stages in this process are client, operational excellence, people, financial, new clients, increased client satisfaction, improved clients service, improved service delivery, more aggressive marketing campaign, presentation skill training, marketing skills training, on the job training, technology training, delivering more than is promised, improved client turnaround, revenue per existing client, revenue from new clients, revenue per service, targeting, critical success factors.
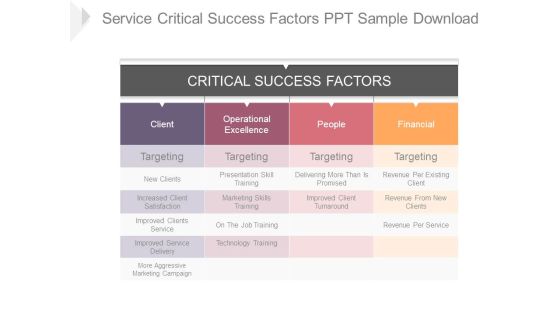
Service Critical Success Factors Ppt Sample Download
This is a service critical success factors ppt sample download. This is a four stage process. The stages in this process are critical success factors, client, operational excellence, people, financial, targeting, new clients, increased client satisfaction, improved clients service, improved service delivery, more aggressive marketing campaign, presentation skill training, marketing skills training, on the job training, technology training, delivering more than is promised, improved client turnaround, revenue per existing client, revenue from new clients, revenue per service.
Successful Brand Development Plan Business Performance Measuring KPI Dashboard Icons PDF
Following slide covers business performance dashboard of the firm. It include KPIs such as average weekly sales revenue, above sales target, sales revenue and profit generated.Deliver and pitch your topic in the best possible manner with this successful brand development plan business performance measuring kpi dashboard icons pdf Use them to share invaluable insights on average revenue, customer lifetime value, customer acquisition cost and impress your audience. This template can be altered and modified as per your expectations. So, grab it now.
Improving Brand Awareness Through WOM Marketing Dashboard For Tracking Essential Marketing Activities Actions Download PDF
This slide covers information regarding the dashboard for tracking essential marketing activities in terms of revenue generated, sign ups, promoters, pending actions, owed and paid, etc. Deliver an awe inspiring pitch with this creative improving brand awareness through wom marketing dashboard for tracking essential marketing activities actions download pdf bundle. Topics like revenue, customers, cancellations, revenue generated can be discussed with this completely editable template. It is available for immediate download depending on the needs and requirements of the user.

B2B Sales Representative Insights Dashboard Ppt Icon PDF
This slide covers the sales reps dashboard wherein teams contribution to leads, managing SQLs and revenue targets are evaluated.Deliver an awe-inspiring pitch with this creative B2B sales representative insights dashboard ppt icon pdf. bundle. Topics like sales representatives leads actual, sales representatives revenue actual, revenue pace can be discussed with this completely editable template. It is available for immediate download depending on the needs and requirements of the user.
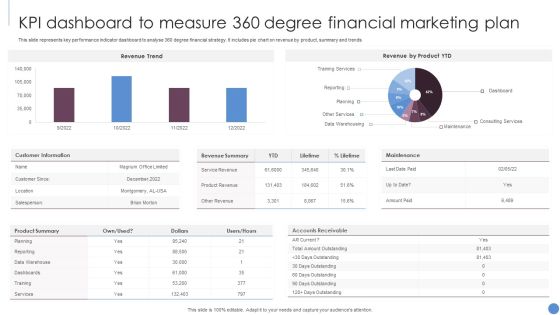
KPI Dashboard To Measure 360 Degree Financial Marketing Plan Slides PDF
This slide represents key performance indicator dashboard to analyse 360 degree financial strategy. It includes pie chart on revenue by product, summary and trends. Showcasing this set of slides titled KPI Dashboard To Measure 360 Degree Financial Marketing Plan Slides PDF. The topics addressed in these templates are Revenue Trend, Revenue Product YTD, Customer Information. All the content presented in this PPT design is completely editable. Download it and make adjustments in color, background, font etc. as per your unique business setting.

Substitute Financing Pitch Deck Financial Summary Of The Company Template PDF
the slide provides the key financial highlights revenue, operating and net income trend for last five tears and revenue split by product categories and geography for the latest year of the company. Deliver an awe inspiring pitch with this creative substitute financing pitch deck financial summary of the company template pdf bundle. Topics like services, revenue, product ,income can be discussed with this completely editable template. It is available for immediate download depending on the needs and requirements of the user.

Establishing Successful Brand Strategy To Captivate Consumers Business Performance Dashboard Microsoft PDF
Following slide covers business performance dashboard of the firm. It include KPIs such as average weekly sales revenue, above sales target, sales revenue and profit generated. Deliver an awe inspiring pitch with this creative establishing successful brand strategy to captivate consumers business performance dashboard microsoft pdf bundle. Topics like customer acquisition cost, customer lifetime value, average revenue per unit can be discussed with this completely editable template. It is available for immediate download depending on the needs and requirements of the user.

Challenges Faced By Cloud Based Business Model Inspiration PDF
The slide carries the problems faced by SaaS business start-ups in getting a stable revenue inflow. Various challenges included are brand awareness, database management and revenue stability. Presenting Challenges Faced By Cloud Based Business Model Inspiration PDF to dispense important information. This template comprises three stages. It also presents valuable insights into the topics including Brand Awareness, Database Management, Revenue Stability. This is a completely customizable PowerPoint theme that can be put to use immediately. So, download it and address the topic impactfully.
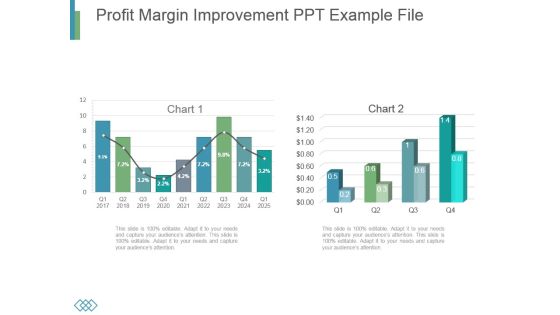
Profit Margin Improvement Ppt Example File
This is a profit margin improvement ppt example file. This is a two stage process. The stages in this process are business, marketing, growth, timeline, analysis.

Earned Value Ppt PowerPoint Presentation Gallery Design Templates
This is a earned value ppt powerpoint presentation gallery design templates. This is a three stage process. The stages in this process are planned value, earned value, actual cost, growth, finance.

Profitability Ratios Template Ppt PowerPoint Presentation Topics
This is a profitability ratios template ppt powerpoint presentation topics. This is a two stage process. The stages in this process are marketing, strategy, growth, graph, business.
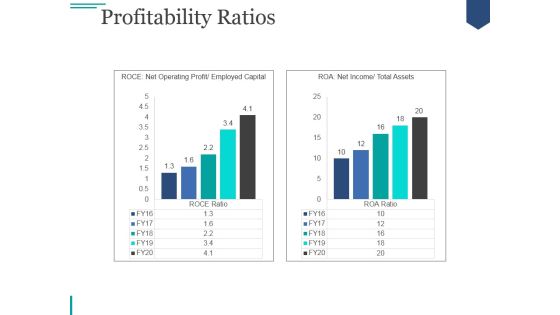
Profitability Ratios Template 2 Ppt PowerPoint Presentation Professional
This is a profitability ratios template 2 ppt powerpoint presentation professional. This is a two stage process. The stages in this process are graph, business, marketing, strategy, growth.

Monetary Gains Stack Of Coins Ppt PowerPoint Presentation Styles Graphics
This is a monetary gains stack of coins ppt powerpoint presentation styles graphics. This is a five stage process. The stages in this process are mutual funds, funds to buy, investment slide.
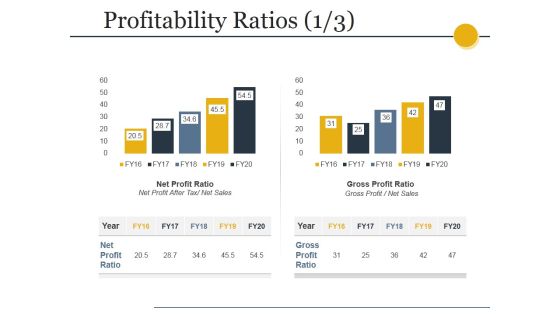
Profitability Ratios Template 1 Ppt PowerPoint Presentation Slides Inspiration
This is a profitability ratios template 1 ppt powerpoint presentation slides inspiration. This is a two stage process. The stages in this process are net profit ratio, net profit after tax net sales, gross profit ratio, gross profit net sales.

Budgeting Planned Actual Comparison Ppt PowerPoint Presentationpictures Files
This is a budgeting planned actual comparison ppt powerpoint presentationpictures files. This is a two stage process. The stages in this process are deviation, planned costs vs actual costs, planned cost, actual cost.

Financial Statement Price Management Diagram Powerpoint Layout
This is a financial statement price management diagram powerpoint layout. This is a two stage process. The stages in this process are opex, earning before interest taxes.

Improve Profitability Powerpoint Slide Designs
This is a improve profitability powerpoint slide designs. This is a three stage process. The stages in this process are improve profitability, increase revenue per carload, decrease losses.
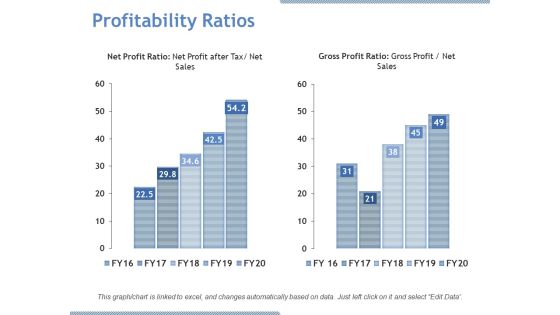
Profitability Ratios Ppt PowerPoint Presentation File Portrait
This is a profitability ratios ppt powerpoint presentation file portrait. This is a two stage process. The stages in this process are net profit ratio, gross profit ratio, growth.
Dollar Raise Money Investment Vector Icon Ppt Powerpoint Presentation Inspiration Outline
This is a dollar raise money investment vector icon ppt powerpoint presentation inspiration outline. This is a four stage process. The stages in this process are market growth, market opportunity, market profitability.
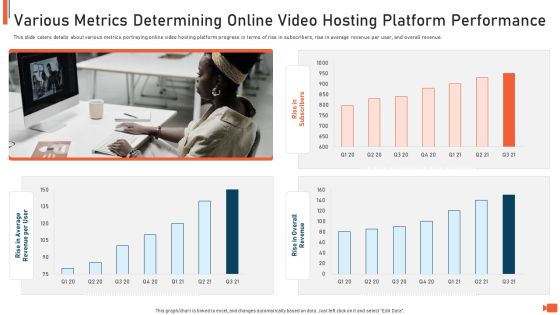
Online Video Streaming Site Capital Raising Elevator Various Metrics Determining Online Video Hosting Platform Performance Graphics PDF
This slide caters details about various metrics portraying online video hosting platform progress in terms of rise in subscribers, rise in average revenue per user, and overall revenue. Deliver an awe inspiring pitch with this creative online video streaming site capital raising elevator various metrics determining online video hosting platform performance graphics pdf bundle. Topics like rise in overall revenue, rise in subscribers, rise in average revenue per user can be discussed with this completely editable template. It is available for immediate download depending on the needs and requirements of the user.

Secured Video Hosting Platform Investor Capital Funding Various Metrics Determining Online Video Hosting Platform Performance Elements PDF
This slide caters details about various metrics portraying online video hosting platform progress in terms of rise in subscribers, rise in average revenue per user, and overall revenue. Deliver and pitch your topic in the best possible manner with this secured video hosting platform investor capital funding various metrics determining online video hosting platform performance elements pdf. Use them to share invaluable insights on rise in subscribers, rise in average revenue per user, rise in overall revenue and impress your audience. This template can be altered and modified as per your expectations. So, grab it now.

Economic Cycle Stages Diagram Powerpoint Show
This is a economic cycle stages diagram powerpoint show. This is a four stage process. The stages in this process are economic boom, prosperity, recession, expansion, depression.
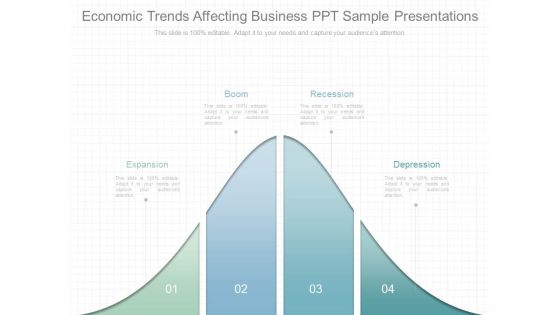
Economic Trends Affecting Business Ppt Sample Presentations
This is a economic trends affecting business ppt sample presentations. This is a four stage process. The stages in this process are expansion, boom, recession, depression.
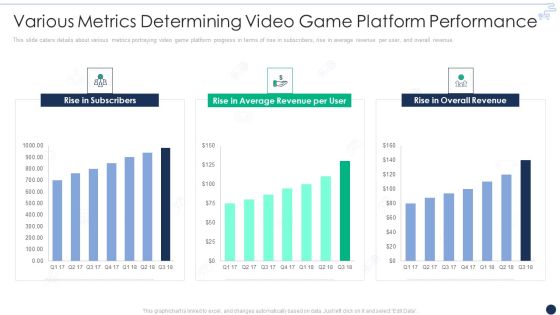
Online Gaming Funding Pitch Deck Various Metrics Determining Video Game Platform Performance Brochure PDF
This slide caters details about various metrics portraying video game platform progress in terms of rise in subscribers, rise in average revenue per user, and overall revenue. Deliver an awe inspiring pitch with this creative online gaming funding pitch deck various metrics determining video game platform performance brochure pdf bundle. Topics like rise in subscribers, rise in average revenue per user, rise in overall revenue can be discussed with this completely editable template. It is available for immediate download depending on the needs and requirements of the user.

Virtual Adventure Gaming Investor Elevator Pitch Deck Various Metrics Determining Video Professional PDF
This slide caters details about various metrics portraying video game platform progress in terms of rise in subscribers, rise in average revenue per user, and overall revenue. Deliver an awe inspiring pitch with this creative virtual adventure gaming investor elevator pitch deck various metrics determining video professional pdf bundle. Topics like rise in subscribers, rise in average revenue per user, rise in overall revenue can be discussed with this completely editable template. It is available for immediate download depending on the needs and requirements of the user.

Computerized Game Pitch Deck Various Metrics Determining Video Game Platform Performance Information PDF
This slide caters details about various metrics portraying video game platform progress in terms of rise in subscribers, rise in average revenue per user, and overall revenue. Deliver an awe inspiring pitch with this creative computerized game pitch deck various metrics determining video game platform performance information pdf bundle. Topics like rise in subscribers, rise in average revenue per user, rise in overall revenue can be discussed with this completely editable template. It is available for immediate download depending on the needs and requirements of the user.

Online Gaming Fundraising Pitch Deck Various Metrics Determining Video Game Platform Performance Structure PDF
This slide caters details about various metrics portraying video game platform progress in terms of rise in subscribers, rise in average revenue per user, and overall revenue. Deliver an awe inspiring pitch with this creative online gaming fundraising pitch deck various metrics determining video game platform performance structure pdf bundle. Topics like rise in subscribers, rise in average revenue per user, rise in overall revenue can be discussed with this completely editable template. It is available for immediate download depending on the needs and requirements of the user.

Multiplayer Gameplay System Venture Capitalist PPT Various Metrics Determining Video Game Platform Performance Infographics PDF
This slide caters details about various metrics portraying video game platform progress in terms of rise in subscribers, rise in average revenue per user, and overall revenue.Deliver an awe inspiring pitch with this creative multiplayer gameplay system venture capitalist ppt various metrics determining video game platform performance infographics pdf bundle. Topics like rise in subscribers, rise in average revenue, rise in overall revenue can be discussed with this completely editable template. It is available for immediate download depending on the needs and requirements of the user.
