Revenue Growth

Combo Chart Ppt PowerPoint Presentation Infographics Example Topics
This is a combo chart ppt powerpoint presentation infographics example topics. This is a eight stage process. The stages in this process are business, marketing, growth, combo chart, management.
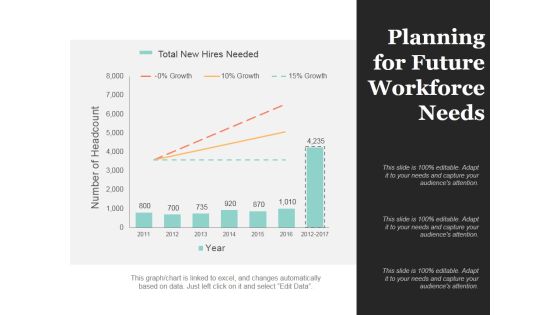
Planning For Future Workforce Needs Ppt PowerPoint Presentation Styles Professional
This is a planning for future workforce needs ppt powerpoint presentation styles professional. This is a seven stage process. The stages in this process are business, growth, finance, analysis, strategy.
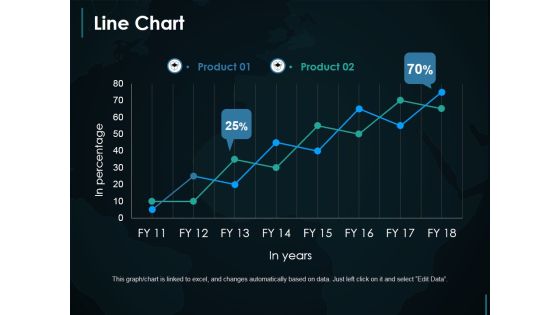
Line Chart Ppt PowerPoint Presentation Infographic Template Demonstration
This is a line chart ppt powerpoint presentation infographic template demonstration. This is a two stage process. The stages in this process are line chart, growth, finance, marketing, strategy.

Column Chart Ppt PowerPoint Presentation Infographic Template Example File
This is a column chart ppt powerpoint presentation infographic template example file. This is a two stage process. The stages in this process are growth, finance, business, marketing, analysis.
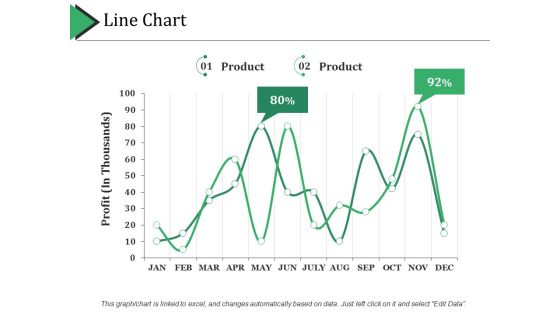
Line Chart Ppt PowerPoint Presentation Portfolio Graphics Pictures
This is a line chart ppt powerpoint presentation portfolio graphics pictures. This is a two stage process. The stages in this process are line chart, finance, growth, strategy, business.

Digital Trading Platform Fundraising Pitch Deck Financial Performance Download PDF
Following slide highlights company financial performance that helps to estimate future growth. It provides insights about company annual revenue, users, net income and trading volume. Take your projects to the next level with our ultimate collection of Digital Trading Platform Fundraising Pitch Deck Financial Performance Download PDF. Slidegeeks has designed a range of layouts that are perfect for representing task or activity duration, keeping track of all your deadlines at a glance. Tailor these designs to your exact needs and give them a truly corporate look with your own brand colors they will make your projects stand out from the rest.
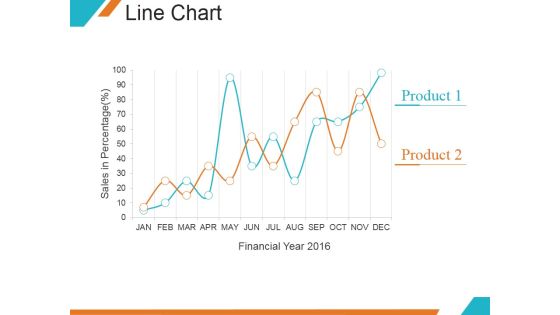
Line Chart Ppt PowerPoint Presentation Samples
This is a line chart ppt powerpoint presentation samples. This is a two stage process. The stages in this process are financial year, product, growth, marketing.

Column Chart Ppt PowerPoint Presentation Slides Smartart
This is a column chart ppt powerpoint presentation slides smartart. This is a two stage process. The stages in this process are sales in percentage, financial year in, business, growth, strategy.
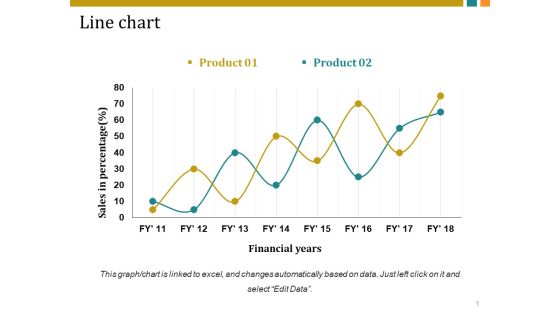
Line Chart Ppt PowerPoint Presentation Inspiration Vector
This is a line chart ppt powerpoint presentation inspiration vector. This is a two stage process. The stages in this process are sales in percentage, financial years, business, marketing, growth.

Line Chart Ppt PowerPoint Presentation Infographics Graphic Images
This is a line chart ppt powerpoint presentation infographics graphic images. This is a two stage process. The stages in this process are sales in percentage, financial years, growth, business, marketing.

Line Chart Ppt PowerPoint Presentation Pictures Templates
This is a line chart ppt powerpoint presentation pictures templates. This is a two stage process. The stages in this process are sales in percentage, financial years, business, marketing, growth.

Stacked Line Chart Ppt PowerPoint Presentation Shapes
This is a stacked line chart ppt powerpoint presentation shapes. This is a two stage process. The stages in this process are product, profit in thousands, finance, analysis, growth.

Area Chart Ppt PowerPoint Presentation Model Examples
This is a area chart ppt powerpoint presentation model examples. This is a two stage process. The stages in this process are year profit in dollars, business, strategy, growth.

Scatter With Smooth Lines And Markers Ppt PowerPoint Presentation Ideas Deck
This is a scatter with smooth lines and markers ppt powerpoint presentation ideas deck. This is a one stage process. The stages in this process are profit, dollar, percentage, business, growth.
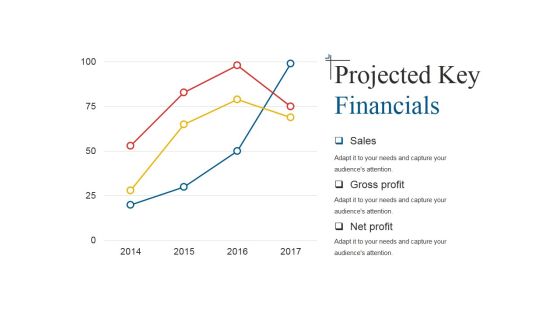
Projected Key Financials Template 1 Ppt PowerPoint Presentation Infographic Template Graphics
This is a projected key financials template 1 ppt powerpoint presentation infographic template graphics. This is a three stage process. The stages in this process are sales, gross profit, net profit.
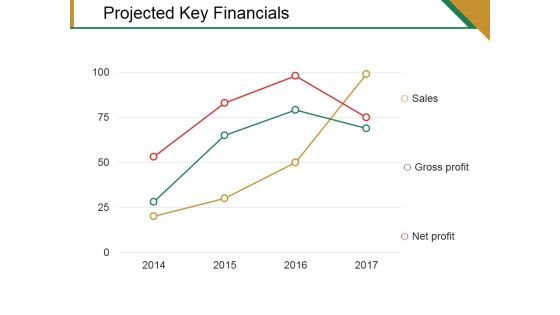
Projected Key Financials Template 2 Ppt PowerPoint Presentation Pictures Graphics Template
This is a projected key financials template 2 ppt powerpoint presentation pictures graphics template. This is a three stage process. The stages in this process are sales, gross profit, net profit.
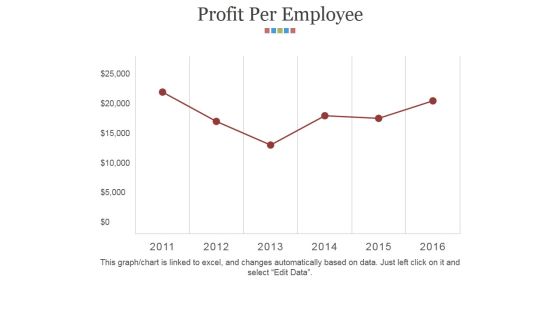
Profit Per Employee Ppt PowerPoint Presentation Summary Slides
This is a profit per employee ppt powerpoint presentation summary slides. This is a six stage process. The stages in this process are profit per employee, business, marketing, management, success.
Non Profit Fundraising Ppt PowerPoint Presentation Icon Ideas Cpb
This is a non profit fundraising ppt powerpoint presentation icon ideas cpb. This is a five stage process. The stages in this process are non profit fundraising.

Area Chart Ppt PowerPoint Presentation File Graphic Tips
This is a area chart ppt powerpoint presentation file graphic tips. This is a two stage process. The stages in this process are product, in percentage, financial year, business, growth.

Column Chart Ppt PowerPoint Presentation Infographics Layout Ideas
This is a column chart ppt powerpoint presentation infographics layout ideas. This is a two stage process. The stages in this process are financial year in, business, marketing, growth, graph.
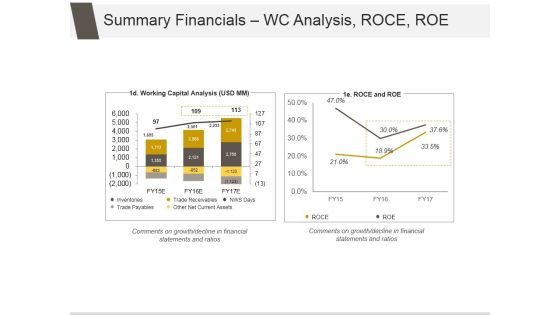
Summary Financials Wc Analysis Roce Roe Ppt PowerPoint Presentation Templates
This is a summary financials wc analysis roce roe ppt powerpoint presentation templates. This is a two stage process. The stages in this process are working capital analysis, inventories, trade receivables, trade payables.

Operational Challenges Ppt PowerPoint Presentation Summary Outfit
This is a operational challenges ppt powerpoint presentation summary outfit. This is a seven stage process. The stages in this process are customer facing, back office, entering the market sales marketing, customer care, organizational operations setup, optimize revenue sources, partners and alliances.

Customer Lifetime Value Model Powerpoint Shapes
This is a customer lifetime value model powerpoint shapes. This is a three stage process. The stages in this process are inactive nonprofit able customer, active profitable customers, very active very profitable customers.

Venture Capital Consumer Ppt PowerPoint Presentation File Gallery
This is a venture capital consumer ppt powerpoint presentation file gallery. This is a four stage process. The stages in this process are venture capital consumer.

Scatter With Smooth Lines And Markers Ppt PowerPoint Presentation Show Template
This is a scatter with smooth lines and markers ppt powerpoint presentation show template. This is a nine stage process. The stages in this process are business, strategy, marketing, success, dollar in billions, profit in thousands.
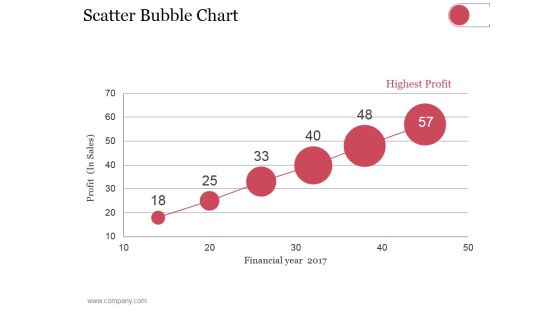
Scatter Bubble Chart Ppt PowerPoint Presentation Summary Pictures
This is a scatter bubble chart ppt powerpoint presentation summary pictures. This is a six stage process. The stages in this process are highest profit, financial year, profit in sales.
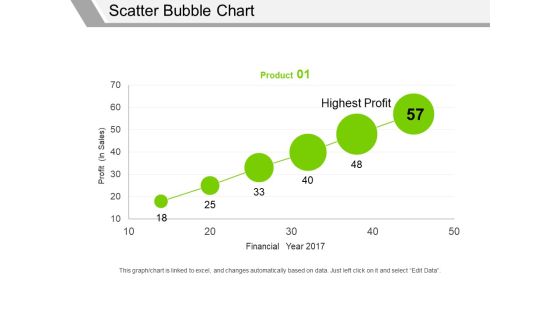
Scatter Bubble Chart Ppt PowerPoint Presentation Professional Graphics Pictures
This is a scatter bubble chart ppt powerpoint presentation professional graphics pictures. This is a one stage process. The stages in this process are profit in sales, financial year, highest profit, product.

Financial Projection Graph Template 1 Ppt PowerPoint Presentation Clipart
This is a financial projection graph template 1 ppt powerpoint presentation clipart. This is a three stage process. The stages in this process are annual, sales, forecast, finance, marketing.
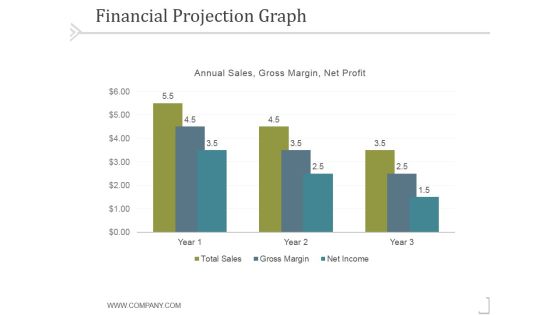
Financial Projection Graph Template 2 Ppt PowerPoint Presentation Template
This is a financial projection graph template 2 ppt powerpoint presentation template. This is a three stage process. The stages in this process are business, strategy, marketing, success, analysis.

Bar Graph With Upward Arrow For Financial Success Ppt PowerPoint Presentation Infographic Template Model
This is a bar graph with upward arrow for financial success ppt powerpoint presentation infographic template model. This is a five stage process. The stages in this process are rising arrow, growing arrow, increasing arrow.
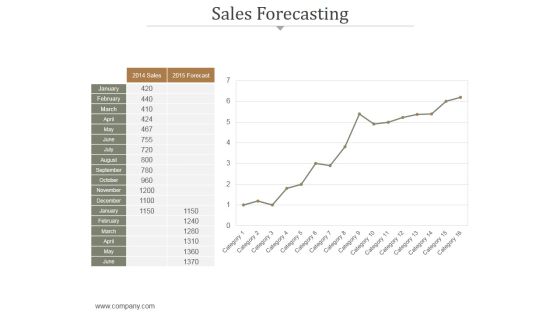
Sales Forecasting Ppt PowerPoint Presentation Example File
This is a sales forecasting ppt powerpoint presentation example file. This is a one stage process. The stages in this process are business, marketing, strategy, management, success, analysis.

Examples Financial Reports Ppt PowerPoint Presentation Infographic Template Vector
This is a examples financial reports ppt powerpoint presentation infographic template vector. This is a five stage process. The stages in this process are examples financial reports.
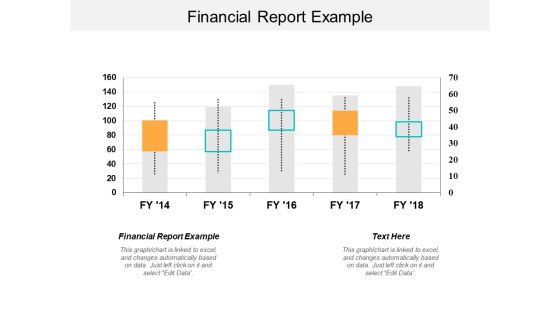
Financial Report Example Ppt PowerPoint Presentation Professional Styles Cpb
This is a financial report example ppt powerpoint presentation professional styles cpb. This is a five stage process. The stages in this process are financial report example.
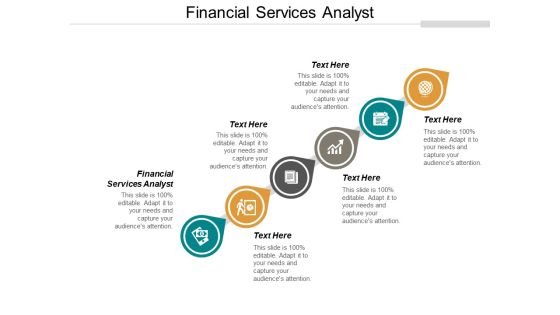
Financial Services Analyst Ppt PowerPoint Presentation Pictures Graphic Tips Cpb
This is a financial services analyst ppt powerpoint presentation pictures graphic tips cpb. This is a six stage process. The stages in this process are financial services analyst.

Current State Analysis Financial Comparison Ppt PowerPoint Presentation Graphics
This is a current state analysis financial comparison ppt powerpoint presentation graphics. This is a five stage process. The stages in this process are financial, comparison, strategy, management, business.

Projected Sales Volume Ppt PowerPoint Presentation Pictures
This is a projected sales volume ppt powerpoint presentation pictures. This is a five stage process. The stages in this process are business, strategy, marketing, analysis, liner process, bar graph.

Key Financials Ppt PowerPoint Presentation Model File Formats
This is a key financials ppt powerpoint presentation model file formats. This is a three stage process. The stages in this process are planning, marketing, business, management, strategy.

Financial Predictions Template 1 Ppt PowerPoint Presentation Summary Deck
This is a financial predictions template 1 ppt powerpoint presentation summary deck. This is a three stage process. The stages in this process are monthly breakeven, aggregate breakeven.

Financial Management Operational Excellence Ppt PowerPoint Presentation Inspiration Example Cpb
Presenting this set of slides with name financial management operational excellence ppt powerpoint presentation inspiration example cpb. This is an editable Powerpoint five stages graphic that deals with topics like financial management operational excellence to help convey your message better graphically. This product is a premium product available for immediate download and is 100 percent editable in Powerpoint. Download this now and use it in your presentations to impress your audience.
Financial Chart For Investment Portfolio Management Vector Icon Rules PDF
Persuade your audience using this financial chart for investment portfolio management vector icon rules pdf. This PPT design covers three stages, thus making it a great tool to use. It also caters to a variety of topics including financial chart for investment portfolio management vector icon. Download this PPT design now to present a convincing pitch that not only emphasizes the topic but also showcases your presentation skills.
Financial Planning With Investment Chart Vector Icon Inspiration PDF
Persuade your audience using this financial planning with investment chart vector icon inspiration pdf. This PPT design covers three stages, thus making it a great tool to use. It also caters to a variety of topics including financial planning with investment chart vector icon. Download this PPT design now to present a convincing pitch that not only emphasizes the topic but also showcases your presentation skills.
Financial Downfall Vector Icon Ppt PowerPoint Presentation Slides Download
Presenting this set of slides with name financial downfall vector icon ppt powerpoint presentation slides download. This is a three stage process. The stages in this process are loss, decrease graph, stock market. This is a completely editable PowerPoint presentation and is available for immediate download. Download now and impress your audience.
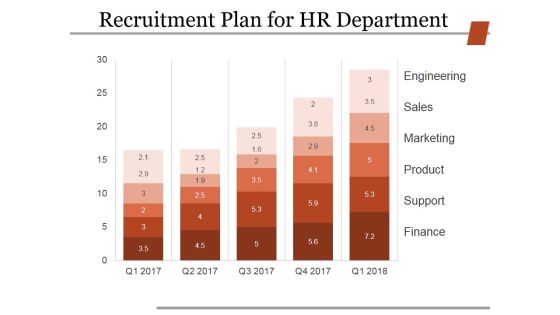
Recruitment Plan For Hr Department Ppt PowerPoint Presentation Infographic Template Design Inspiration
This is a recruitment plan for hr department ppt powerpoint presentation infographic template design inspiration. This is a five stage process. The stages in this process are engineering, sales, marketing, product, support, finance.
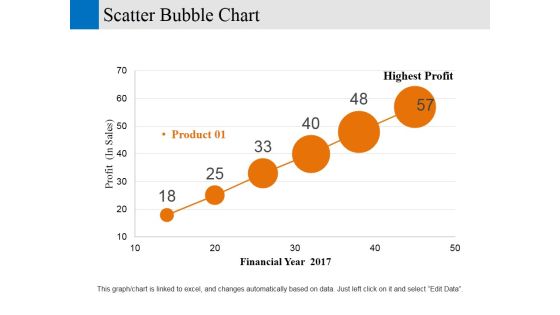
Scatter Bubble Chart Ppt PowerPoint Presentation Gallery Designs Download
This is a scatter bubble chart ppt powerpoint presentation gallery designs download. This is a six stage process. The stages in this process are financial year, profit, business, marketing, strategy.
Stacked Line With Marker Ppt PowerPoint Presentation Icon Format
This is a stacked line with marker ppt powerpoint presentation icon format. This is a twelve stage process. The stages in this process are business, strategy, marketing, success, profit million dollars, stacked column.

Financial Success Arrow On Bar Chart Ppt PowerPoint Presentation Ideas Display
This is a financial success arrow on bar chart ppt powerpoint presentation ideas display. This is a four stage process. The stages in this process are rising arrow, growing arrow, increasing arrow.

Financial Services Call Center Ppt PowerPoint Presentation Portfolio Example File Cpb
This is a financial services call center ppt powerpoint presentation portfolio example file cpb. This is a three stage process. The stages in this process are financial services call center.

Bar Chart And Pie Graph For Financial Planning Ppt PowerPoint Presentation Infographics Graphics Example PDF
Presenting bar chart and pie graph for financial planning ppt powerpoint presentation infographics graphics example pdf. to dispense important information. This template comprises four stages. It also presents valuable insights into the topics including bar chart and pie graph for financial planning. This is a completely customizable PowerPoint theme that can be put to use immediately. So, download it and address the topic impactfully.
Financial Projection Icon For Predicting Future Condition Ppt Slides Guide PDF
Persuade your audience using this financial projection icon for predicting future condition ppt slides guide pdf. This PPT design covers three stages, thus making it a great tool to use. It also caters to a variety of topics including financial projection icon for predicting future condition. Download this PPT design now to present a convincing pitch that not only emphasizes the topic but also showcases your presentation skills.

5S Methodology Diagram For Financial Planning Process Ppt PowerPoint Presentation Professional Graphics Download PDF
Persuade your audience using this 5s methodology diagram for financial planning process ppt powerpoint presentation professional graphics download pdf. This PPT design covers five stages, thus making it a great tool to use. It also caters to a variety of topics including 5s methodology diagram for financial planning process. Download this PPT design now to present a convincing pitch that not only emphasizes the topic but also showcases your presentation skills.

Graph With Arrow Showing Financial Downfall Ppt PowerPoint Presentation Summary Objects
Presenting this set of slides with name graph with arrow showing financial downfall ppt powerpoint presentation summary objects. This is a three stage process. The stages in this process are loss, decrease graph, stock market. This is a completely editable PowerPoint presentation and is available for immediate download. Download now and impress your audience.

Crm Dashboard Deals By Expected Close Date Ppt PowerPoint Presentation Show Information
This is a crm dashboard deals by expected close date ppt powerpoint presentation show information. This is a three stage process. The stages in this process are deals by expected close date, percentage, business, finance, success.

Customer Lifetime Value Clv Ppt PowerPoint Presentation Designs Download
This is a customer lifetime value clv ppt powerpoint presentation designs download. This is a three stage process. The stages in this process are inactive nonprofit able customer, active profitable customers, very active very profitable customers.
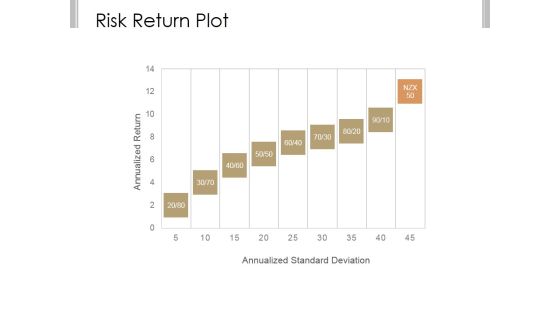
Risk Return Plot Ppt PowerPoint Presentation Styles
This is a risk return plot ppt powerpoint presentation styles. This is a nine stage process. The stages in this process are annualized return, annualized standard deviation.

Bridge Transition Model Template 2 Ppt PowerPoint Presentation Files
This is a bridge transition model template 2 ppt powerpoint presentation files. This is a four stage process. The stages in this process are uncertainty, skepticism, exploration, commitment, transition, ending, new beginnings.

Line Chart Ppt PowerPoint Presentation Summary
This is a line chart ppt powerpoint presentation summary. This is a two stage process. The stages in this process are business, marketing, line chart, finance, markers.

Crm Dashboard Opportunity By Rating Ppt PowerPoint Presentation Ideas Outfit
This is a crm dashboard opportunity by rating ppt powerpoint presentation ideas outfit. This is a three stage process. The stages in this process are open opportunity, count all opportunity, cold, hot, aram.
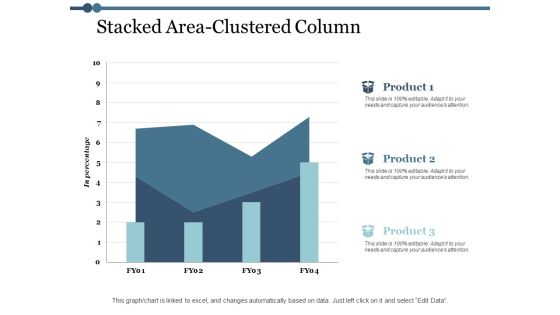
Stacked Area Clustered Column Ppt PowerPoint Presentation Model Topics
This is a stacked area clustered column ppt powerpoint presentation model topics. This is a three stage process. The stages in this process are area chart, finance, marketing, management, investment.

Corporate Web Strategy Ppt Powerpoint Presentation Infographics Layout Ideas Cpb
This is a corporate web strategy ppt powerpoint presentation infographics layout ideas cpb. This is a four stage process. The stages in this process are corporate web strategy.

Customer Relationship Value Powerpoint Slide Clipart
This is a customer relationship value powerpoint slide clipart. This is a three stage process. The stages in this process are active profitable customers, inactive nonprofit able customer, very active very profitable customers.
 Home
Home