Revenue Dashboard

Substitute Financing Pitch Deck Financial Summary Of The Company Template PDF
the slide provides the key financial highlights revenue, operating and net income trend for last five tears and revenue split by product categories and geography for the latest year of the company. Deliver an awe inspiring pitch with this creative substitute financing pitch deck financial summary of the company template pdf bundle. Topics like services, revenue, product ,income can be discussed with this completely editable template. It is available for immediate download depending on the needs and requirements of the user.
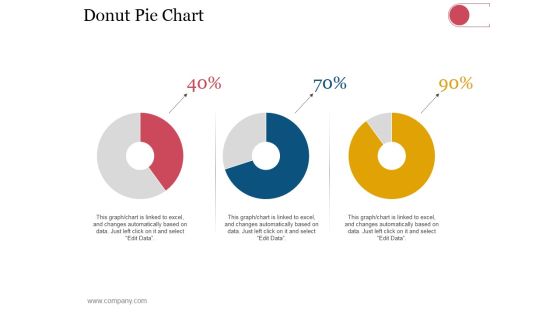
Donut Pie Chart Ppt PowerPoint Presentation Infographics Outfit
This is a donut pie chart ppt powerpoint presentation infographics outfit. This is a three stage process. The stages in this process are business, strategy, analysis, planning, dashboard, finance.

Financial Highlights Template 1 Ppt PowerPoint Presentation Slides
This is a financial highlights template 1 ppt powerpoint presentation slides. This is a two stage process. The stages in this process are sales, operating expenses, operating income, net income.
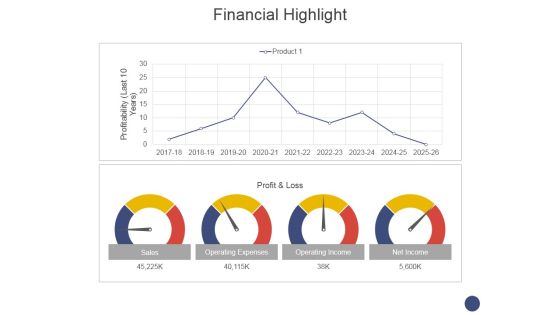
Financial Highlight Template 1 Ppt PowerPoint Presentation Model Deck
This is a financial highlight template 1 ppt powerpoint presentation model deck. This is a two stage process. The stages in this process are sales, operating expenses, operating income, net income.
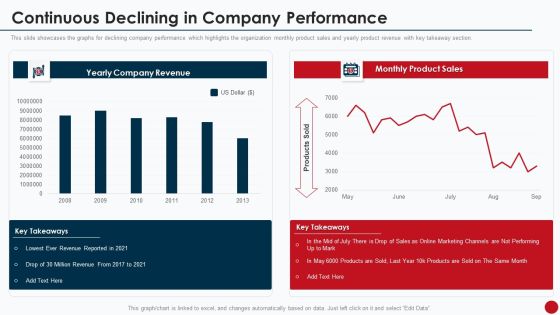
Marketing Manual For Product Promotion On Youtube Channel Continuous Declining In Company Performance Rules PDF
This slide showcases the graphs for declining company performance which highlights the organization monthly product sales and yearly product revenue with key takeaway section.Deliver and pitch your topic in the best possible manner with this Marketing Manual For Product Promotion On Youtube Channel Continuous Declining In Company Performance Rules PDF. Use them to share invaluable insights on Marketing Channels, Revenue Reported, Million Revenue and impress your audience. This template can be altered and modified as per your expectations. So, grab it now.

Agile QA Procedure Forfeiture Of Poor Quality Projects Topics PDF
This slide highlights the companys year over year financial statistics covering details about the loss incur, revenue generated, and expenses made. Deliver an awe inspiring pitch with this creative agile qa procedure forfeiture of poor quality projects topics pdf bundle. Topics like dashboard for tracking the agile quality assurance process effectiveness can be discussed with this completely editable template. It is available for immediate download depending on the needs and requirements of the user.
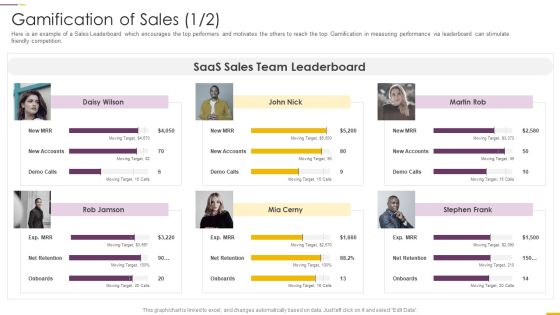
How Build Gamification Advertising Plan Gamification Of Sales Team Ppt Pictures Demonstration PDF
Here is another example of gamification of sales. This boosts revenue generation by pushing sales persons to be on top of their game.Deliver an awe inspiring pitch with this creative how build gamification advertising plan gamification of sales team ppt pictures demonstration pdf bundle. Topics like gamification dashboard can be discussed with this completely editable template. It is available for immediate download depending on the needs and requirements of the user.

Clock With Money Bag Vector Icon Ppt PowerPoint Presentation File Outline PDF
Presenting this set of slides with name clock with money bag vector icon ppt powerpoint presentation file outline pdf. This is a three stage process. The stages in this process are clock with money bag vector icon. This is a completely editable PowerPoint presentation and is available for immediate download. Download now and impress your audience.
Time Is Money Vector Icon Ppt PowerPoint Presentation Icon Backgrounds PDF
Presenting this set of slides with name time is money vector icon ppt powerpoint presentation icon backgrounds pdf. This is a three stage process. The stages in this process are time is money vector icon. This is a completely editable PowerPoint presentation and is available for immediate download. Download now and impress your audience.
Website Performance Review Ppt PowerPoint Presentation Icon Deck
This is a website performance review ppt powerpoint presentation icon deck. This is a three stage process. The stages in this process are conversion rate, average visit value goal, visits.
Product Marketing Report Integral Brand Strategy Business Financial Ppt PowerPoint Presentation Inspiration Backgrounds
This is a product marketing report integral brand strategy business financial ppt powerpoint presentation inspiration backgrounds. This is a three stage process. The stages in this process are product marketing report, integral brand strategy, business financial.
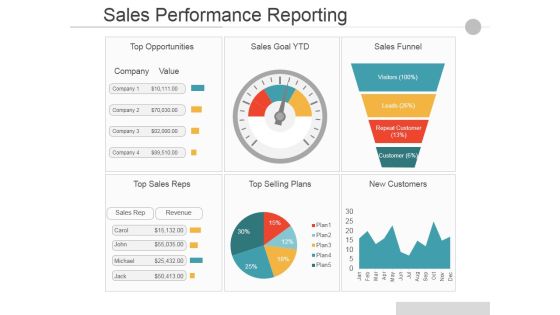
Sales Performance Reporting Ppt PowerPoint Presentation Infographics Portrait
This is a Sales Performance Reporting Ppt PowerPoint Presentation Infographics Portrait. This is a six stage process. The stages in this process are Top Opportunities, Sales Goal Ytd, Sales Funnel, Top Sales Reps, Top Selling Plans, New Customers.

Financial Analysis Vector Bar Graph With Magnifying Glass Ppt PowerPoint Presentation Gallery Design Ideas
This is a financial analysis vector bar graph with magnifying glass ppt powerpoint presentation gallery design ideas. This is a four stage process. The stages in this process are marketing analytics, marketing performance, marketing discovery.
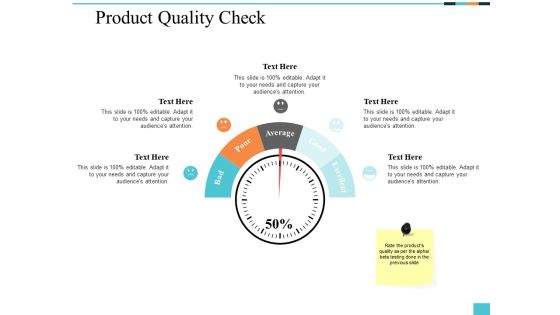
Product Quality Check Ppt PowerPoint Presentation Model Microsoft
This is a product quality check ppt powerpoint presentation model microsoft. This is a five stage process. The stages in this process are finance, marketing, management, investment, analysis.

Organization Transformation Strategies For Successful Business Elements PDF
This slide shows how transformation has taken place in an organization over a long period of time with the economic impact. It includes digital products and infrastructure, digital distribution and web strategy and business models. Presenting Organization Transformation Strategies For Successful Business Elements PDF to dispense important information. This template comprises three stages. It also presents valuable insights into the topics including Workplace Tools, Digital Workflows, Digitalizing The Business. This is a completely customizable PowerPoint theme that can be put to use immediately. So, download it and address the topic impactfully.

Financial Performance Introduction Of Supply Chain Management Organization Infographics PDF
This slide showcases introduction to statistics that can help supply chain management organization to evaluate the financial performance. Its key components are revenue, net income and revenue sources.Pitch your topic with ease and precision using this Financial Performance Introduction Of Supply Chain Management Organization Infographics PDF This layout presents information on Revenue Sources, Revenue Increased, Income Increased It is also available for immediate download and adjustment. So, changes can be made in the color, design, graphics or any other component to create a unique layout.

Multiplayer Gameplay System Venture Capitalist PPT Various Metrics Determining Video Game Platform Performance Infographics PDF
This slide caters details about various metrics portraying video game platform progress in terms of rise in subscribers, rise in average revenue per user, and overall revenue.Deliver an awe inspiring pitch with this creative multiplayer gameplay system venture capitalist ppt various metrics determining video game platform performance infographics pdf bundle. Topics like rise in subscribers, rise in average revenue, rise in overall revenue can be discussed with this completely editable template. It is available for immediate download depending on the needs and requirements of the user.

Customer Relationship Management Action Plan Crm Data Analysis Source Template PDF
Deliver and pitch your topic in the best possible manner with this customer relationship management action plan crm data analysis source template pdf. Use them to share invaluable insights on no of deals, open deals, revenue, expected revenue and impress your audience. This template can be altered and modified as per your expectations. So, grab it now.
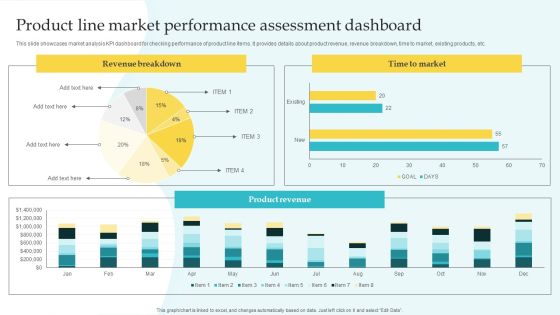
Commodity Line Expansion Product Line Market Performance Assessment Download PDF
This slide showcases market analysis KPI dashboard for checking performance of product line items. It provides details about product revenue, revenue breakdown, time to market, existing products, etc. Explore a selection of the finest Commodity Line Expansion Product Line Market Performance Assessment Download PDF here. With a plethora of professionally designed and pre-made slide templates, you can quickly and easily find the right one for your upcoming presentation. You can use our Commodity Line Expansion Product Line Market Performance Assessment Download PDF to effectively convey your message to a wider audience. Slidegeeks has done a lot of research before preparing these presentation templates. The content can be personalized and the slides are highly editable. Grab templates today from Slidegeeks.
Role Of IT In Business Communication Social Media Customer Service Tracking Ideas PDF
This slide represents the social dashboard for tracking media customer service by covering the total number of requests and requests answered, total revenue, support costs rate to revenue rate, customer satisfaction, the average time to solve an issue, and so on. This Role Of IT In Business Communication Social Media Customer Service Tracking Ideas PDF from Slidegeeks makes it easy to present information on your topic with precision. It provides customization options, so you can make changes to the colors, design, graphics, or any other component to create a unique layout. It is also available for immediate download, so you can begin using it right away. Slidegeeks has done good research to ensure that you have everything you need to make your presentation stand out. Make a name out there for a brilliant performance.
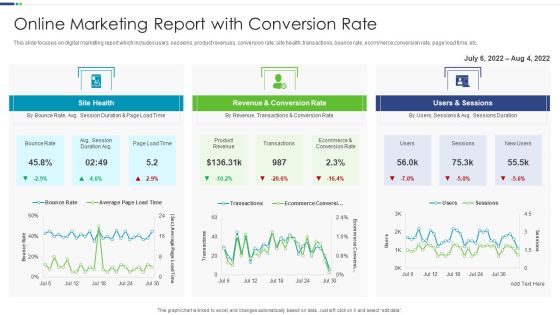
Online Marketing Report With Conversion Rate Brochure PDF
This slide focuses on digital marketing report which includes users, sessions, product revenues, conversion rate, site health, transactions, bounce rate, ecommerce conversion rate, page load time, etc. Showcasing this set of slides titled Online Marketing Report With Conversion Rate Brochure PDF The topics addressed in these templates are Revenue Conversion, Revenue Transactions, Sessions Duration All the content presented in this PPT design is completely editable. Download it and make adjustments in color, background, font etc. as per your unique business setting.

Key Performance Indicators To Tract Success Rate Of Strategy Summary PDF
The slide shows the key Performance Indicators KPIs, that might help the company to track the success rate of implemented strategies. Major KPIs include revenue, number of passengers, revenue per available seat, number of pilots, number of flights etc. Deliver and pitch your topic in the best possible manner with this key performance indicators to tract success rate of strategy summary pdf. Use them to share invaluable insights on revenue per available seat, target and impress your audience. This template can be altered and modified as per your expectations. So, grab it now.

Marketing Agency Company Outline Key Statistics Structure PDF
The following slide highlights the financial statistics for the year 2021. The stats show the change in global data and insights revenue, total revenue, EBITDA, SaaS platform revenue and operating net cash flow. The Marketing Agency Company Outline Key Statistics Structure PDF is a compilation of the most recent design trends as a series of slides. It is suitable for any subject or industry presentation, containing attractive visuals and photo spots for businesses to clearly express their messages. This template contains a variety of slides for the user to input data, such as structures to contrast two elements, bullet points, and slides for written information. Slidegeeks is prepared to create an impression.

Data And Customer Analysis Company Outline Diversified And Growing Business Elements PDF
This slide highlights the Nielsen diversified and growing business which includes solutions revenue share, customer base and revenue by geography, contracted revenue and years of experience. Find a pre designed and impeccable Data And Customer Analysis Company Outline Diversified And Growing Business Elements PDF. The templates can ace your presentation without additional effort. You can download these easy to edit presentation templates to make your presentation stand out from others. So, what are you waiting for Download the template from Slidegeeks today and give a unique touch to your presentation.

Key Metrics In Software Sales Strategy Pictures PDF
This slide presents key metrics to be tracked in software sales plan, that helps organisations to keep track of growth and profits generated over time. It includes monthly recurring revenue, average revenue per user, customer lifetime value and lead velocity rate Presenting Key Metrics In Software Sales Strategy Pictures PDF to dispense important information. This template comprises four stages. It also presents valuable insights into the topics including Monthly Recurring Revenue, Customer Lifetime Value, Lead Velocity Rate. This is a completely customizable PowerPoint theme that can be put to use immediately. So, download it and address the topic impactfully.

Competitors Global Market Share And Earnings Comparative Analysis Report Slides PDF
This slide covers comparison matrix of company and competitors market share and revenue. It also includes pie chart depicting the total global revenue market share. Showcasing this set of slides titled Competitors Global Market Share And Earnings Comparative Analysis Report Slides PDF. The topics addressed in these templates are Revenue, Global Market Share, Earnings Comparative Analysis Report. All the content presented in this PPT design is completely editable. Download it and make adjustments in color, background, font etc. as per your unique business setting.

Hotels Social Infrastructure Development Business Executive Report Topics PDF
This slide showcase business summary of hotel social infrastructure development to increase profit and revenue of hotel chains. It includes elements such as target market, competitors, management team, problems solutions competitive advantages, revenue model. Persuade your audience using this Hotels Social Infrastructure Development Business Executive Report Topics PDF. This PPT design covers ten stages, thus making it a great tool to use. It also caters to a variety of topics including Revenue Model, Competitive Advantages, Solutions, Problems. Download this PPT design now to present a convincing pitch that not only emphasizes the topic but also showcases your presentation skills.

Consumption Based Pricing Model Challenges In Recurring Business Model Slides PDF
The purpose of the following slide is to show multiple challenges that the company can face while implementing a recurring revenue model , these challenges can be customer management, payment security and invoicing. Make sure to capture your audiences attention in your business displays with our gratis customizable Consumption Based Pricing Model Business Performance Dashboard Demonstration PDF. These are great for business strategies, office conferences, capital raising or task suggestions. If you desire to acquire more customers for your tech business and ensure they stay satisfied, create your own sales presentation with these plain slides.

Table Of Contents Continued Ppt PowerPoint Presentation Inspiration Slides
This is a table of contents continued ppt powerpoint presentation inspiration slides. This is a fourteen stage process. The stages in this process are business model, revenue model, growth strategy, marketing strategy, market size.
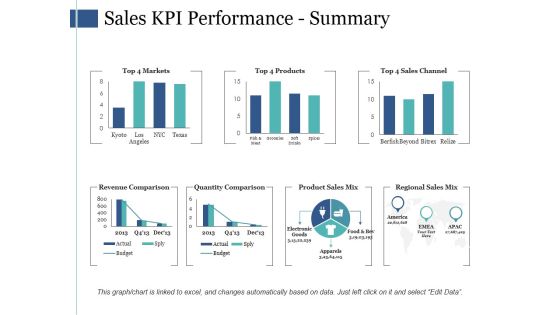
Sales Kpi Performance Summary Ppt PowerPoint Presentation Infographic Template Infographics
This is a sales kpi performance summary ppt powerpoint presentation infographic template infographics. This is a seven stage process. The stages in this process are revenue comparison, quantity comparison, product sales mix, regional sales mix.

Sales Kpi Performance Summary Ppt PowerPoint Presentation Infographic Template Elements
This is a sales kpi performance summary ppt powerpoint presentation infographic template elements. This is a seven stage process. The stages in this process are revenue comparison, quantity comparison, product sales mix, regional sales mix, budget.
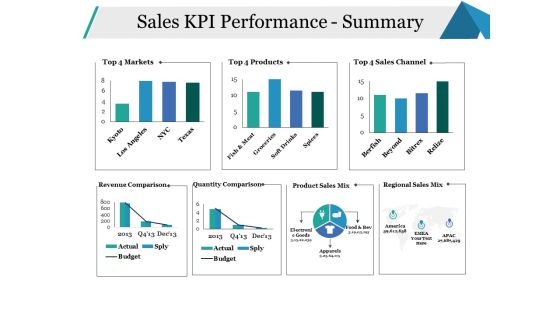
Sales KPI Performance Summary Ppt PowerPoint Presentation Infographics Model
This is a sales kpi performance summary ppt powerpoint presentation infographics model. This is a seven stage process. The stages in this process are sales channel, revenue comparison, quantity comparison, business, marketing.
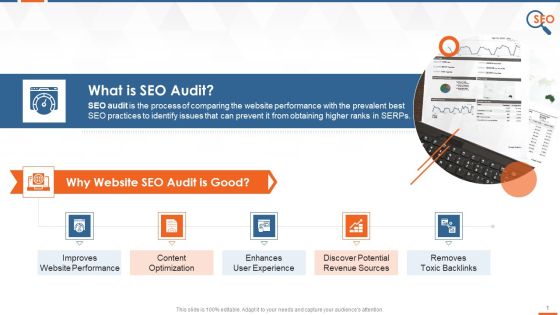
What Is SEO Audit And Its Significance Training Ppt
This slide provides information regarding the SEO audit. It also covers details of its importance in improving website performance, content optimization, enhancing user experience, discovering potential revenue sources, and removing toxic backlinks.
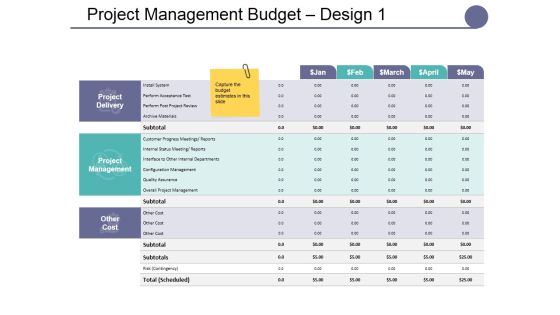
Project Management Budget Design Template 1 Ppt PowerPoint Presentation Show Model
This is a project management budget design template 1 ppt powerpoint presentation show model. This is a four stage process. The stages in this process are internal funding, department budget, existing revenue streams, government grants, itemized income.
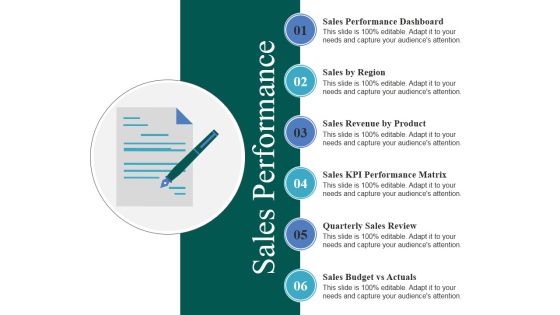
Sales Performance Ppt PowerPoint Presentation Infographics Visuals
This is a sales performance ppt powerpoint presentation infographics visuals. This is a six stage process. The stages in this process are sales by region, sales revenue by product, sales kpi performance matrix, quarterly sales review, sales budget vs actuals.

Data Requirements For Employee Performance Analytics Graphics PDF
The following slide highlights data requirement for employee performance analysis which includes elements such as absenteeism rate, revenue per employee, overtime per employee and efficiency are along with key insights. Pitch your topic with ease and precision using this data requirements for employee performance analytics graphics pdf. This layout presents information on revenue, employee, rate. It is also available for immediate download and adjustment. So, changes can be made in the color, design, graphics or any other component to create a unique layout.

Barriers To Digital Transformation Ppt PowerPoint Presentation Styles Backgrounds
This is a barriers to digital transformation ppt powerpoint presentation styles backgrounds. This is a six stage process. The stages in this process are processes, digital skills shortage, data issues, short term revenue targets, employee training.
Website Performance Review Template 2 Ppt PowerPoint Presentation Icon Design Ideas
This is a website performance review template 2 ppt powerpoint presentation icon design ideas. This is a four stage process. The stages in this process are column two, revenue trends, traffic sources.
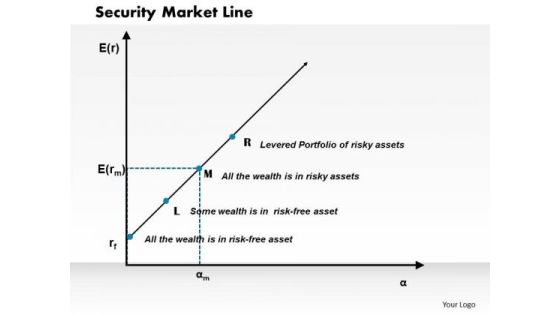
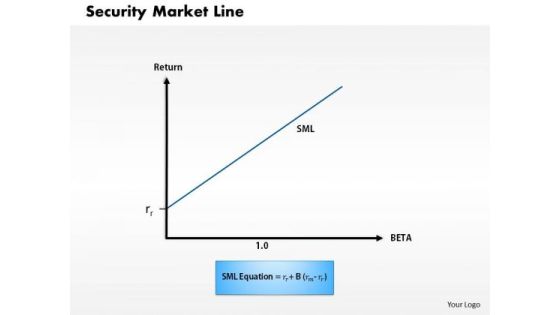
Business Framework Security Market Line PowerPoint Presentation
This diagram displays graph of security market line. You can use line graph to plot changes in data over time, such as monthly revenue and earnings changes or daily changes in stock market prices.
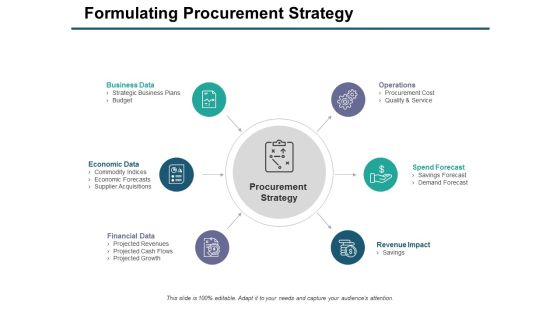
Formulating Procurement Strategy Ppt PowerPoint Presentation Model Visual Aids
This is a formulating procurement strategy ppt powerpoint presentation model visual aids. This is a six stage process. The stages in this process are business data, operations, revenue impact, financial data, economic data.
Business Framework Security Market Line 1 PowerPoint Presentation
This diagram displays graph of security market line. You can use line graph to plot changes in data over time, such as monthly revenue and earnings changes or daily changes in stock market prices.

Business Framework Security Market Line 11 PowerPoint Presentation
This diagram displays graph of security market line. You can use line graph to plot changes in data over time, such as monthly revenue and earnings changes or daily changes in stock market prices.
Techniques Of Demand Forecasting Ppt Sample Presentations
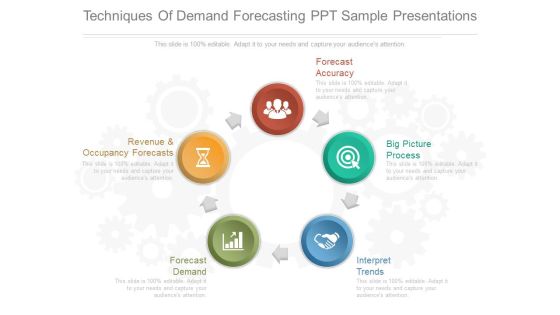
This is a techniques of demand forecasting ppt sample presentations. This is a five stage process. The stages in this process are revenue and occupancy forecasts, forecast accuracy, big picture process, interpret trends, forecast demand.

Formulating Procurement Strategy Ppt PowerPoint Presentation Styles Gallery
This is a formulating procurement strategy ppt powerpoint presentation styles gallery. This is a six stage process. The stages in this process are formulating procurement strategy, operations, financial data, procurement strategy, revenue impact.

Customer Behavioral Data And Analytics Cart Abandonment Email Campaign And Recovery Sample PDF
Cart Abandonments can be targeted to increase revenue for the company. Measure which email campaign helped you recover the most revenue. Deliver an awe inspiring pitch with this creative customer behavioral data and analytics cart abandonment email campaign and recovery sample pdf bundle. Topics like cart abandonment email campaign and recovery can be discussed with this completely editable template. It is available for immediate download depending on the needs and requirements of the user.

Analyzing Impact Of Blockchain Iot On Major Kpis Icons PDF
This slide showcases impact analysis of blockchain internet of things IoT on key performance indicators KPIs. It provides information about efficiency, security, risk, costs, business models, revenue resources, etc. Deliver an awe inspiring pitch with this creative Analyzing Impact Of Blockchain Iot On Major Kpis Icons PDF bundle. Topics like Blockchain Integration, Business Model, Revenue Sources can be discussed with this completely editable template. It is available for immediate download depending on the needs and requirements of the user.

Identifying Key Metrics For Evaluating Performance Ppt Styles Files PDF
Following slide focusses on highlighting key metrics for evaluating performance of newly launched subscription revenue model. This slide covers detailed description and calculation approach for evaluating each metrics. Deliver and pitch your topic in the best possible manner with this identifying key metrics for evaluating performance ppt styles files pdf. Use them to share invaluable insights on revenue, growth, goals, potential, customer and impress your audience. This template can be altered and modified as per your expectations. So, grab it now.

Data And Analytics Playbook How To Overcome Search Driven Analytics Barriers Template PDF
This template depicts that intuitive search-driven analytics gives users an easy way to ask questions, receive suggestions on what to query, and visualize their data. Deliver and pitch your topic in the best possible manner with this Data And Analytics Playbook How To Overcome Search Driven Analytics Barriers Template PDF. Use them to share invaluable insights on Total Revenue, Region And Department, Revenue and impress your audience. This template can be altered and modified as per your expectations. So, grab it now.

Accounting Pitch Deck Key Financial Projections For Upcoming Years Designs PDF
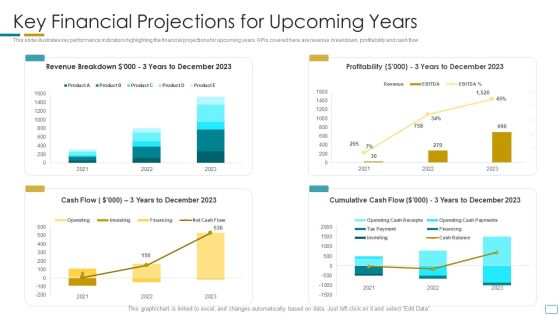
This slide illustrates key performance indicators highlighting the financial projections for upcoming years. KPIs covered here are revenue breakdown, profitability and cash flow.Deliver an awe inspiring pitch with this creative accounting pitch deck key financial projections for upcoming years designs pdf bundle. Topics like revenue breakdown, profitability, cumulative cash flow can be discussed with this completely editable template. It is available for immediate download depending on the needs and requirements of the user.
Fundraising Pitch Deck For Startup Company Key Financial Projections For Upcoming Years Brochure PDF
This slide illustrates key performance indicators highlighting the financial projections for upcoming years. KPIs covered here are revenue breakdown, profitability and cash flow Deliver an awe inspiring pitch with this creative fundraising pitch deck for startup company key financial projections for upcoming years brochure pdf bundle. Topics like profitability, revenue can be discussed with this completely editable template. It is available for immediate download depending on the needs and requirements of the user.

Linkedin Company Outline Executive Summary Portrait PDF
The slide highlights the company snapshot to provide the overview of LinkedIn corporation. It showcases company logo, chief executive officer, estimated revenue, revenue CAGR, key stats and company market value.Deliver an awe inspiring pitch with this creative Linkedin Company Outline Executive Summary Portrait PDF bundle. Topics like Talent Solutions, Marketing Solutions, Learning Solutions can be discussed with this completely editable template. It is available for immediate download depending on the needs and requirements of the user.

Customer Support Services Company Profile Financial Performance Comparison Infographics PDF
This slide highlights the financial performance analysis of multiple call centers on the basis of operating margin, and revenue growth. It includes Sykes, TeleTech, Convergys and ABC Pvt ltd. Deliver and pitch your topic in the best possible manner with this Customer Support Services Company Profile Financial Performance Comparison Infographics PDF. Use them to share invaluable insights on Revenue Growth, Operating Margin and impress your audience. This template can be altered and modified as per your expectations. So, grab it now.
Financials Projections Masterclass Investor Fund Raising Elevator Pitch Deck Mockup PDF
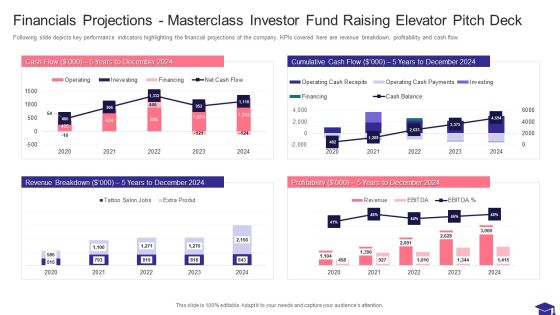
Following slide depicts key performance indicators highlighting the financial projections of the company. KPIs covered here are revenue breakdown, profitability and cash flow.Deliver an awe inspiring pitch with this creative Financials Projections Masterclass Investor Fund Raising Elevator Pitch Deck Mockup PDF bundle. Topics like Cumulative Cash, Profitability, Revenue Breakdown can be discussed with this completely editable template. It is available for immediate download depending on the needs and requirements of the user.
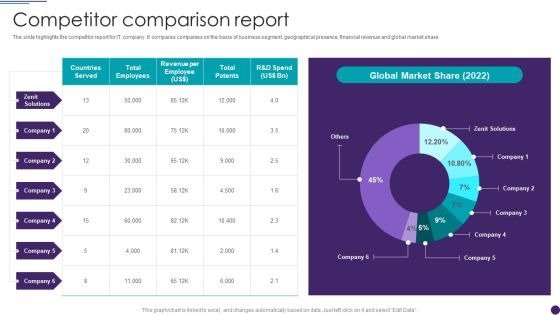
IT Services Business Profile Competit Or Comparison Report Microsoft PDF
The slide highlights the competitor report for IT company. It compares companies on the basis of business segment, geographical presence, financial revenue and global market share Deliver an awe inspiring pitch with this creative IT Services Business Profile Competit Or Comparison Report Microsoft PDF bundle. Topics like Revenue Per Employee, Global Market Share can be discussed with this completely editable template. It is available for immediate download depending on the needs and requirements of the user.

Medical Care Company Overview Competitor Comparison Analysis Report Introduction PDF
The slide comparative analysis of company with competitors on the basis ratings, number of employees, funding, market capitalization, revenue, net profit and total assets. It describes the company position in global market. Deliver an awe inspiring pitch with this creative Medical Care Company Overview Competitor Comparison Analysis Report Introduction PDF bundle. Topics like Employees, Market, Revenue can be discussed with this completely editable template. It is available for immediate download depending on the needs and requirements of the user.

Competitor Comparison Report IT Software Development Company Profile Background PDF
The slide highlights the competitor report for IT company. It compares companies on the basis of business segment, geographical presence, financial revenue and global market share. Deliver an awe inspiring pitch with this creative Competitor Comparison Report IT Software Development Company Profile Background PDF bundle. Topics like Competitor Comparison Report, Revenue Per Employee can be discussed with this completely editable template. It is available for immediate download depending on the needs and requirements of the user.

IT Application Services Company Outline Competitor Comparison Report Elements PDF
The slide highlights the competitor report for IT company. It compares companies on the basis of business segment, geographical presence, financial revenue and global market share. Deliver an awe inspiring pitch with this creative IT Application Services Company Outline Competitor Comparison Report Elements PDF bundle. Topics like Total Employees, Revenue Per Employee, Countries Served can be discussed with this completely editable template. It is available for immediate download depending on the needs and requirements of the user.
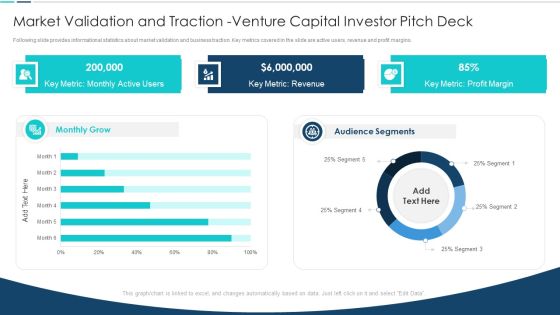
Market Validation And Traction Venture Capital Investor Pitch Deck Microsoft PDF
Following slide provides informational statistics about market validation and business traction. Key metrics covered in the slide are active users, revenue and profit margins. Deliver an awe inspiring pitch with this creative Market Validation And Traction Venture Capital Investor Pitch Deck Microsoft PDF bundle. Topics like Monthly Grow Segment, Audience Segments Monthly, Key Metric Revenue, Key Metric Profit can be discussed with this completely editable template. It is available for immediate download depending on the needs and requirements of the user.
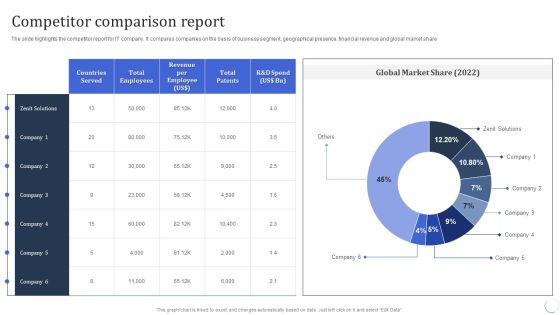
Infotech Solutions Research And Development Company Summary Competitor Comparison Report Slides PDF
The slide highlights the competitor report for IT company. It compares companies on the basis of business segment, geographical presence, financial revenue and global market share. Deliver an awe inspiring pitch with this creative Infotech Solutions Research And Development Company Summary Competitor Comparison Report Slides PDF bundle. Topics like Revenue Per Employee, Global Market Share, Countries Served can be discussed with this completely editable template. It is available for immediate download depending on the needs and requirements of the user.

Market Validation And Traction Private Equity Funding Ppt Portfolio Smartart PDF
Following slide provides informational statistics about market validation and business traction. Key metrics covered in the slide are active users, revenue and profit margins. Deliver an awe inspiring pitch with this creative alidation And Traction Private Equity Funding Ppt Portfolio Smartart PDF bundle. Topics like Monthly Grow Segment, Audience Segments Monthly, Key Metric Revenue, Key Metric Profit can be discussed with this completely editable template. It is available for immediate download depending on the needs and requirements of the user.
 Home
Home